
This week we look at the faltering PMI stats from China, and a relatively stable but mixed PMI result from the US for July. We then review the monetary policy decisions this week from the RBA, BoE, and ECB, then we analyze the employment reports from the US and New Zealand.
1. China PMI
2. US PMI
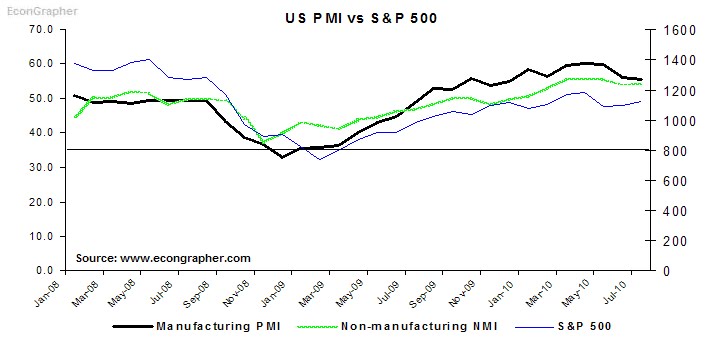
In the US the PMI results also softened slightly, but the standout was the non-manufacturing PMI which came in at 54.3 vs 53.8 in the previous month, driven by new orders, and new export orders. The manufacturing PMI on the other hand dropped to 55.5 from 56.2 with the largest falls in new orders and production. The results are symptomatic of where the US economy is tracking; signs of slowing down, but still riding relatively high from the bounce-back - but remember the bounce-back was brought on by the stimulus measures and the inventory cycle. What we're seeing now is the part where the engine is spinning and the clutch is about to engage - but will it stall? the risks are certainly there.
3. Monetary Policy review
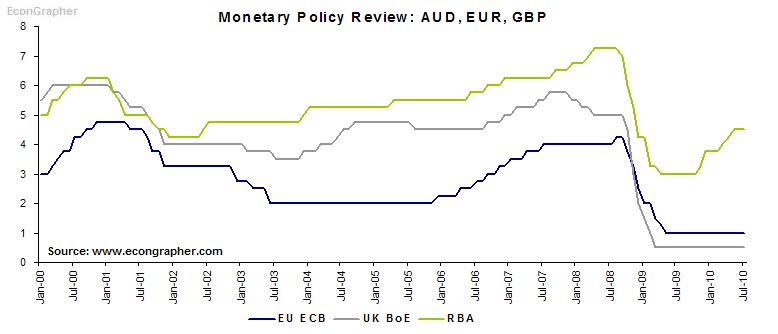
This week we saw monetary policy decisions from Australia, Europe, and the UK. The Reserve Bank of Australia held again at 4.50%, which will probably be the new neutral for now; the RBA is basically taking a wait and see approach at this point to gauge how the recovery is tracking in Australia and around the world. The European Central Bank also held steady at the record low 1.00% which was no surprise, likewise the Bank of England help its key rate at 0.50% and held the Asset Purchase Program unchanged at GBP 200 billion. The ECB and BoE are both unlikely to make any substantive tightening moves before the year is out, but of course this depends on how the recovery at home and abroad continues (or otherwise).
4. New Zealand unemployment
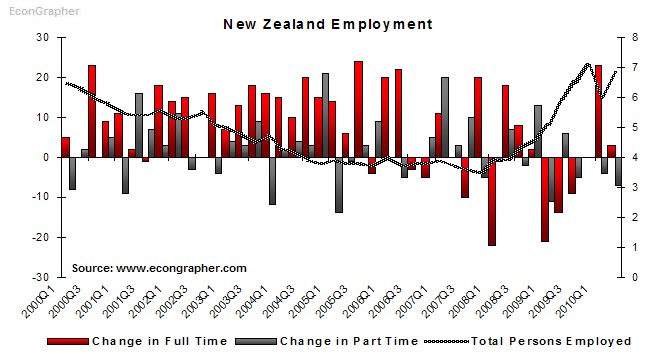
Over in New Zealand the quarterly employment report was released for Q2 2010, with the progress made in Q1 almost all lost as the unemployment rate bounced back to 6.8% from 6% in Q1 (but below the high of 7%). Within the results the number of unemployed persons rose 13.9% to 159k, and the number not in the labour force grew 0.6% to 1,094k, while the number of persons employed dropped -0.3% to 2,170k. But within the employment numbers the number of full time employees increased 3k, while the number of part time employees dropped by 7k; which is a relatively positive sign from the perspective that during a recovery its better to see full time jobs growing rather than part-time jobs. The employment situation will likely improve during the second quarter as the economy limps forward on its recovery.
5. US nonfarm payrolls
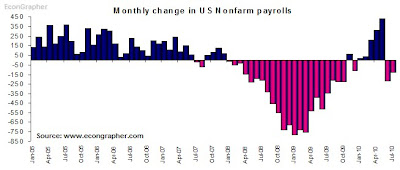
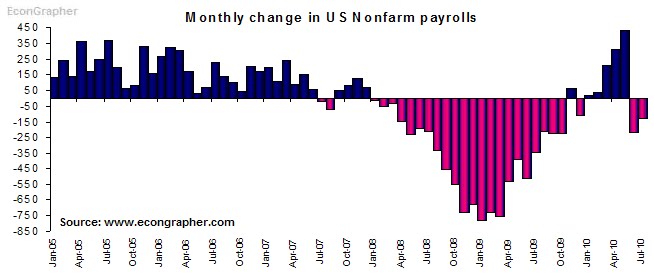
US nonfarm payrolls fell -131k in July (vs consensus -70k), after falling an adjusted -221k in June. In the detail, 202 government jobs were cut (with 143k being census related), however private payrolls increased by 71k (83k in June). Also in the detail, average hourly earnings increased 0.2% and the average work week increased to 34.2 hours from 34.1 in June. So there are some positives in the payrolls employment report, it is a positive signs to see both hours and earnings on the rise, as well as some growth in the private sector. Of course there's a long way to go to recover the losses made during the crisis, but data like this at least slightly improve the mixed picture of where the US economy is headed.
Summary
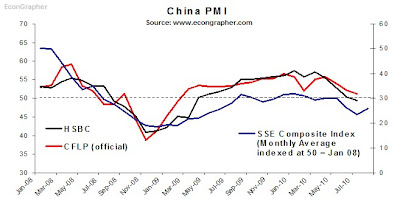
So we had China's PMI falling, with the HSBC index tracking into the sub-50 territory, but it remains to be seen whether this is the start of a significant slowdown, or just a temporary pullback. It's likely to be the latter unless any catalysts trigger a more systemic slowdown.
In the US, the PMI's are sending mixed signals, with the non-manufacturing sector improving on the back of increased orders, while the manufacturing sector is slowing as orders fall. Taken together with the employment results it shows a picture of an economy that is muddling its way along out of the recession, with the training wheels of stimulus and the inventory cycle close to falling off...
On the monetary policy front, the theme is simply wait and see. More and more countries are seeing more stop-start activity, with the mixed signals, and slow progress; as we saw with New Zealand's employment figures. More and more the course of domestic monetary policy is looking outwards to the course of the global economy, the easy part of the recovery is officially over - now comes the hard part!
Sources
1. CFLP www.chinawuliu.com.cn & Markit/HSBC www.markiteconomics.com & Yahoo Finance finance.yahoo.com
2. US Institute for Supply Management www.ism.ws
3. Reserve Bank of Australia www.rba.gov.au & European Central Bank www.ecb.int & Bank of England www.bankofengland.co.uk
4. Statistics New Zealand www.stats.govt.nz
5. Bureau of Labour Statistics www.bls.gov
Article Source: http://www.econgrapher.com/top5graphs7aug.html
1. China PMI
The Chinese PMI indexes both fell in the July reading, with the official CFLP index falling to 51.2 from 52.1, and the HSBC index dipping below 50 for the first time since March 2009, at 49.4 vs 50.4 in June. The PMI numbers are showing an easing of industrial activity in China, but the numbers are still above the low point reached late 2008 to early 2009. The July industrial production result is likely to come in lower again next week when the monthly data release comes out (which also includes CPI, fixed asset investment, PPI, and retail sales). The biggest question around the PMI result is whether or not it's temporary; is it a seasonal movement? is it the result of artificial tightening moves? or is it a more fundamentally driven decline? Next week will surely bring extra pieces to the puzzle.

2. US PMI
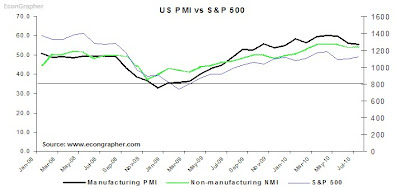
In the US the PMI results also softened slightly, but the standout was the non-manufacturing PMI which came in at 54.3 vs 53.8 in the previous month, driven by new orders, and new export orders. The manufacturing PMI on the other hand dropped to 55.5 from 56.2 with the largest falls in new orders and production. The results are symptomatic of where the US economy is tracking; signs of slowing down, but still riding relatively high from the bounce-back - but remember the bounce-back was brought on by the stimulus measures and the inventory cycle. What we're seeing now is the part where the engine is spinning and the clutch is about to engage - but will it stall? the risks are certainly there.
3. Monetary Policy review
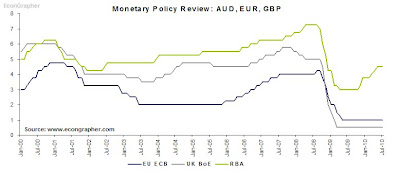
This week we saw monetary policy decisions from Australia, Europe, and the UK. The Reserve Bank of Australia held again at 4.50%, which will probably be the new neutral for now; the RBA is basically taking a wait and see approach at this point to gauge how the recovery is tracking in Australia and around the world. The European Central Bank also held steady at the record low 1.00% which was no surprise, likewise the Bank of England help its key rate at 0.50% and held the Asset Purchase Program unchanged at GBP 200 billion. The ECB and BoE are both unlikely to make any substantive tightening moves before the year is out, but of course this depends on how the recovery at home and abroad continues (or otherwise).
4. New Zealand unemployment
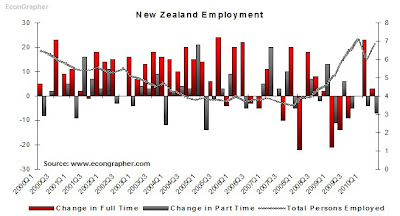
Over in New Zealand the quarterly employment report was released for Q2 2010, with the progress made in Q1 almost all lost as the unemployment rate bounced back to 6.8% from 6% in Q1 (but below the high of 7%). Within the results the number of unemployed persons rose 13.9% to 159k, and the number not in the labour force grew 0.6% to 1,094k, while the number of persons employed dropped -0.3% to 2,170k. But within the employment numbers the number of full time employees increased 3k, while the number of part time employees dropped by 7k; which is a relatively positive sign from the perspective that during a recovery its better to see full time jobs growing rather than part-time jobs. The employment situation will likely improve during the second quarter as the economy limps forward on its recovery.
5. US nonfarm payrolls
US nonfarm payrolls fell -131k in July (vs consensus -70k), after falling an adjusted -221k in June. In the detail, 202 government jobs were cut (with 143k being census related), however private payrolls increased by 71k (83k in June). Also in the detail, average hourly earnings increased 0.2% and the average work week increased to 34.2 hours from 34.1 in June. So there are some positives in the payrolls employment report, it is a positive signs to see both hours and earnings on the rise, as well as some growth in the private sector. Of course there's a long way to go to recover the losses made during the crisis, but data like this at least slightly improve the mixed picture of where the US economy is headed.
Summary
So we had China's PMI falling, with the HSBC index tracking into the sub-50 territory, but it remains to be seen whether this is the start of a significant slowdown, or just a temporary pullback. It's likely to be the latter unless any catalysts trigger a more systemic slowdown.
In the US, the PMI's are sending mixed signals, with the non-manufacturing sector improving on the back of increased orders, while the manufacturing sector is slowing as orders fall. Taken together with the employment results it shows a picture of an economy that is muddling its way along out of the recession, with the training wheels of stimulus and the inventory cycle close to falling off...
On the monetary policy front, the theme is simply wait and see. More and more countries are seeing more stop-start activity, with the mixed signals, and slow progress; as we saw with New Zealand's employment figures. More and more the course of domestic monetary policy is looking outwards to the course of the global economy, the easy part of the recovery is officially over - now comes the hard part!
Sources
1. CFLP www.chinawuliu.com.cn & Markit/HSBC www.markiteconomics.com & Yahoo Finance finance.yahoo.com
2. US Institute for Supply Management www.ism.ws
3. Reserve Bank of Australia www.rba.gov.au & European Central Bank www.ecb.int & Bank of England www.bankofengland.co.uk
4. Statistics New Zealand www.stats.govt.nz
5. Bureau of Labour Statistics www.bls.gov
Article Source: http://www.econgrapher.com/top5graphs7aug.html