
Learning from the Past
One of the things that we find useful as portfolio managers is to review past decisions in order to see if there are any lessons to be learned. We ran a screen today on tech stocks that were in value with a dividend yield of at least 2%. One prominent tech stock that screened out was Microsoft (MSFT). As this is a company we once invested in, we thought it would be useful to review our buy/sell decisions on this tech giant.
Thanks to our EDMP, Inc. F.A.S.T. Graphs™ we enjoy a level of transparency regarding past decisions that most investors do not have. Figure 1 below looks at Microsoft (MSFT) through the lens of our price and earnings correlated research tool since 1992. The EDMP, Inc. F.A.S.T. Graph™ is marked with a green dot depicting where we purchased Microsoft (MSFT), and with red dots marking where we sold it. Reviewing these transactions revealed a powerful lesson in the importance of valuation.
Figure 1 Microsoft 20yr. EPS Earnings Correlated to Price
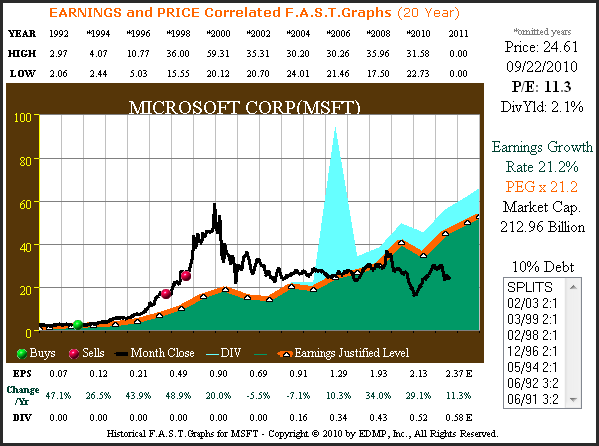
In calendar year-end1999 Microsoft’s stock price hit an all-time high. As you will soon see, this price was significantly higher than fundamental values justified. Since that time, Microsoft’s stock price has fallen precipitously, causing many to doubt the merit of Microsoft’s business model. This can be a very misleading attitude as the following quote from Warren Buffett points out:
"For some reason, people take their cues from price action rather than from values. What doesn't work is when you start doing things that you don't understand or because they worked last week for somebody else. The dumbest reason in the world to buy a stock is because it's going up." Warren Buffett
In 1993 when we purchased Microsoft (green dot) at a split-adjusted price of $2.69, the black price line was touching the orange earnings justified value line, which indicated fair value. In October of 1997 we sold half of our original position at a split-adjusted price of $16.68 (red dot) because the black price line had risen significantly above the orange earnings justified value line which indicated significant overvaluation.
We held our remaining shares until September of 1998 upon which time we sold completely out at a split-adjusted $25 a share (second red dot). When we sold our final shares we were convinced that Microsoft, at $25 a share, was a significantly overvalued tech stock. However, inexplicably, Microsoft more than doubled in price as it peaked at over $58 a share by December 31, 1999. Although our short-term decision was wrong based on price movement, it was clearly a correct one based on soundness of valuation.
Unbelievably yesterday, almost exactly 12 years later Microsoft (MSFT) closed at less than we sold out of it in 1998. The moral of this story, is a clear and undeniable lesson in the dangers of owning, or even worse, buying an overvalued company.
Figure 2 below looks at Microsoft (MSFT) since 1998 showing only earnings and dividends. From Figure 2 it is clear that Microsoft (MSFT) produced strong business results as earnings grew at 10.1 percent per annum.
Microsoft started paying a dividend in 2003, and paid a special three dollar dividend in 2004. This is not a picture of a losing enterprise; however, as we will show later on, long-term buy-and-hold Microsoft shareholders would have lost their shirts holding Microsoft.
Figure 2 Microsoft 12yr. Earnings History
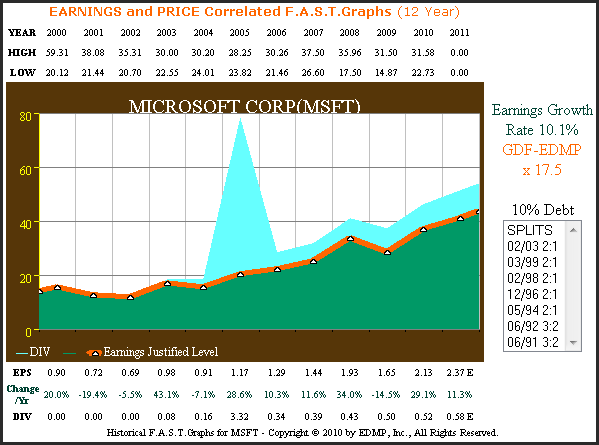
Figure 3 below graphs the S&P 500 since 1998 plotting only earnings and dividends. Not only were the earnings of the stock market (S&P 500) much more cyclical than Microsoft's, they only grew at 5.2% per annum, roughly half of the growth Microsoft (MSFT) achieved.
Figure 3 S&P 500 12yr. Earnings History

Figure 4 below adds monthly closing stock price to the earnings and dividends only Microsoft graph. The orange earnings justified value line indicates a fair value of $14.44 for Microsoft on December 31, 1998, the beginning point of this graph. However, Microsoft (MSFT) was trading at $58.38 more than four times fair value. This is a quintessential example of what Alan Greenspan dubbed irrational exuberance.
Figure 4 Microsoft 12yr. EPS Growth Correlated to Price
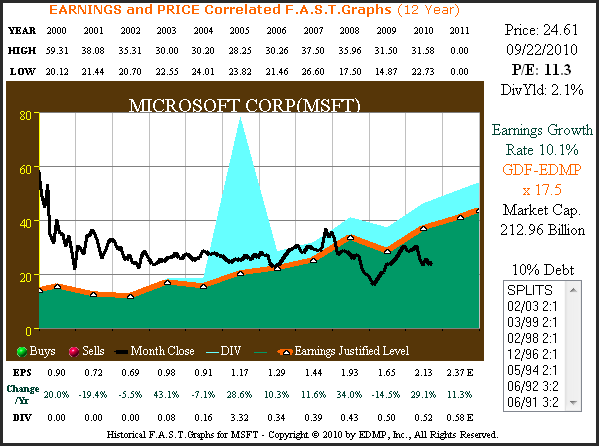
Figure 5 below calculates the performance associated with Figure 4. Due to excessive overvaluation, Microsoft (MSFT) shareholders would have lost almost 57% of their original investment had they held the stock since December 31, 1999. This catastrophic loss also occurred during a time that Microsoft Corp. (MSFT) delivered earnings growth that was more than twice the earnings growth rate of the average company as measured by the S&P 500.
Figure 5 Microsoft 12yr. Performance
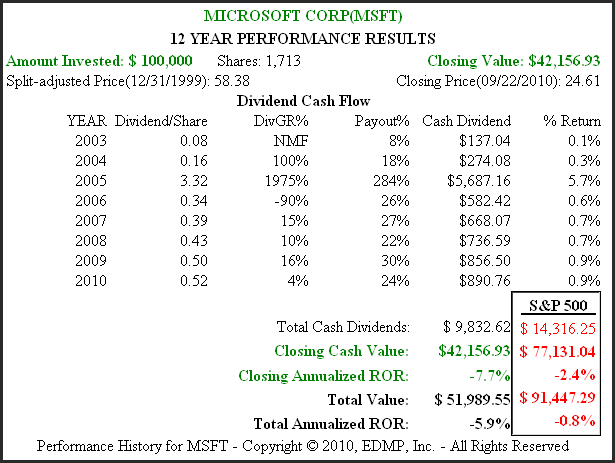
I've read where people have criticized Microsoft (MSFT) as being a lousy investment during this time frame, and they are certainly correct. However, I disagree with the notion that Microsoft (MSFT) was a poorly run business during this time frame. Consistently averaging 10% growth over a decade that included two recessions is, in our opinion, a monumental achievement.
What caused these great losses was a stock market gone mad that ridiculously overpriced this profitable tech giant in 1999. That wasn't Microsoft's fault; this was the market’s fault.
Why overvaluation is so dangerous
It's one thing to point out that overvaluation is dangerous, it's an entirely different thing to understand precisely why. Personally, I'm the kind of person that needs to understand the “why” behind the principle. Therefore, I feel compelled to provide the following explanation of why overvaluation in Microsoft’s stock starting in 1998, then peaking in 1999 before beginning to fall in calendar year 2000, led to such abysmal results. The answer is all about running the numbers through to their logical conclusion.
Figure 6 below looks at Microsoft (MSFT) through the lens of our EDMP, Inc. F.A.S.T. Graphs™ for the period 1992 through 1999. Note how closely Microsoft's stock price tracked earnings from 1992 through 1997 before disconnecting in calendar years 1998 and 1999 where the price peaked at over $58 per share. By calendar year end 1999, Microsoft’s stock price was trading at a lofty PE ratio of over 74 times earnings. Even though earnings were growing at 40% per annum over this time frame, they clearly did not justify this lofty valuation. In other words, price was dramatically above earnings justified levels.
Figure 6 Microsoft 1992 through 1999 Price & Earnings Correlated
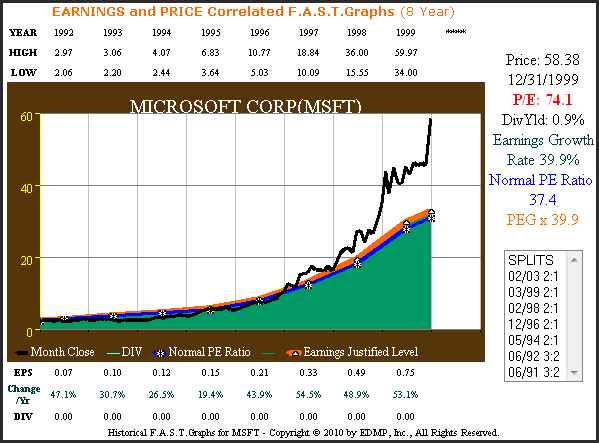
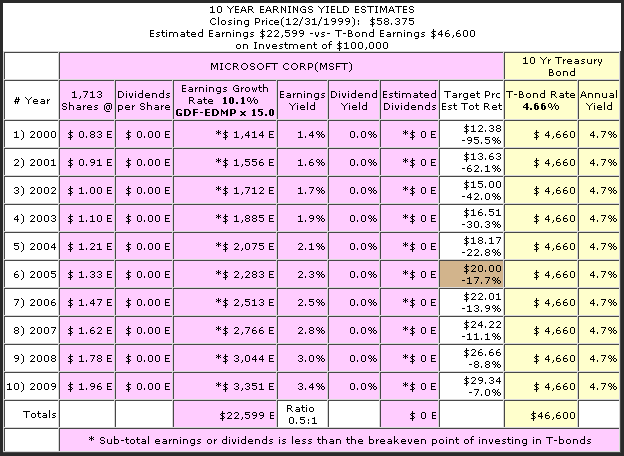
As previously mentioned, Microsoft's earnings growth rate did slow down to approximately 10% per annum which further exasperated the problem. Even when Microsoft (MSFT) was growing at 40% per annum the 74 PE multiple was too high, but at 10% growth it was ludicrously overpriced. Figure 7 below provides the mathematical calculations that illustrate how insane Microsoft’s price had become.
Figure 7 utilizes our EDMP, Inc. F.A.S.T. Graphs™ Earnings Yield Estimator (EYE Chart) that compares a company's total cash flows generated from earnings to investing an equal amount of money into a 10-year treasury bond. When drawing current charts, the EYE Chart is an estimator tool based on current consensus earnings estimates versus current 10-year T-bill rates. However, when looking at historical time periods our tool calculates the numbers that were actually generated historically.
Figure 7 shows that Microsoft Corp. (MSFT) generated earnings growth of 10.1% from calendar year 2000 through 2009, a 10-year period. At that time, a 10-year treasury bond was yielding 4.66%. Therefore, what this chart compares is a $100,000 investment in Microsoft (MSFT) versus an equal $100,000 investment in a treasury bond. For the 10-year period, calendar year 2000 through 2009, Microsoft (MSFT) would have generated $22,500 worth of total cumulative earnings.
The same investment at the same time in a 10-year treasury bond would have generated $46,600 of riskless interest. This is more than twice the total cumulative earnings that Microsoft (MSFT) would have generated for shareholders. Furthermore, keep in mind that Microsoft (MSFT) didn't even pay a dividend at this time, while the treasury bond would have paid their investors 100% of the interest.
This begs the question: Why would you take the risk of owning a tech stock that didn't even pay dividends when a 10-year treasury bond would generate more than twice the cash flow virtually risklessly? Paying more for a company than it's worth will eventually destroy capital.
Figure 7 Microsoft Earnings Yield Estimator Chart (EYE) calendar year 2000 through 2009
Conclusions
After more than a decade of wringing out excessive overvaluation, we believe that Microsoft (MSFT) appears attractively priced at today's levels. The consensus of leading analysts reporting to FirstCall forecast Microsoft (MSFT) to grow earnings over the next five years at 11% per annum. Today, Microsoft trades at a mere 11 times earnings which is equal to this forecast growth rate and yields over 2.1%. Moreover, they have increased their regular dividend every year since they instituted one in 2003. This is true when you exclude the three-dollar one-time special dividend they paid in 2005.
It is our contention, backed by years of research, that there are two important factors that generate long-term returns. The first and most important is the rate of change of earnings growth. In the long run the company's common stock will track earnings and grow at a rate that is consistent with earnings growth. However, this is only true when you get the second important factor right. The second important factor is valuation. True Worth™ valuation is a function of earnings and cash flows and can be calculated utilizing common formulas for valuing a business. If you overpay for even the best of companies you can lose your money even when the company performs well or as expected.
The opinions in this document are for informational and educational purposes only and should not be construed as a recommendation to buy or sell the stocks mentioned or to solicit transactions or clients. Past performance of the companies discussed may not continue and the companies may not achieve the earnings growth as predicted. The information in this document is believed to be accurate, but under no circumstances should a person act upon the information contained within. We do not recommend that anyone act upon any investment information without first consulting an investment advisor as to the suitability of such investments for his specific situation.