
The primary focus of this series on how to know when and why to buy a stock, has thus far dealt primarily with traditional operating companies. In this fourth installment we will alter our focus as we look at master limited partnerships (MLPs). One of the big advantages that a publicly traded common stock has over a limited partnership is liquidity. Master limited partnerships (MLPs) offer the advantage of the liquidity of a common stock and the tax advantages of a limited partnership. Traded on the New York Stock Exchange, master limited partnerships only date back to the 1980s, as they are a product of the US Tax Reform Act of 1986 and the US Revenue Act of 1987. Their limited history and track record is a risk that conservative investors seeking yield should carefully consider.
To qualify for classification as a master limited partnership a firm must earn 90% of its income through activities related to natural resources. Therefore, the majority of master limited partnerships operate in the energy related industry. Most master limited partnerships are known as pipeline MLPs. Generally they are distributors of energy resources such as natural gas and oil and can be thought of as a toll road for these important resources. Therefore, their cash flows tend to be less volatile than commodity oriented energy companies. Since the demand for energy tends to increase over time, pipeline master limited partnerships are known for producing predictable cash flows.
"What gives the business (stock) value?
Ultimately, any business, public or private, has its value derived from the amount of cash flow it is capable of generating for its stakeholders (stockholders). Not only will capital appreciation depend on the level of earnings, dividends are also a function of earnings. It is because of this principle that the discounted cash flow method of valuing a business is so widely accepted by scholars and professional investors. Consequently, this series of articles on how to value a business are going to be strongly based on utilizing fundamental valuations based on cash flows (earnings) as the primary method for finding True Worth™.
Cash Flow Per Unit
To qualify for classification as a master limited partnership a firm must earn 90% of its income through activities related to natural resources. Therefore, the majority of master limited partnerships operate in the energy related industry. Most master limited partnerships are known as pipeline MLPs. Generally they are distributors of energy resources such as natural gas and oil and can be thought of as a toll road for these important resources. Therefore, their cash flows tend to be less volatile than commodity oriented energy companies. Since the demand for energy tends to increase over time, pipeline master limited partnerships are known for producing predictable cash flows.
Although master limited partnerships have different capital structures and are treated differently under the U. S. tax codes, there is an important characteristic they share with traditional operating companies. This important characteristic is the foundational principle that this entire series on how to know when and why to buy a common stock is based on. As you will discover later, although the principle for determining fair value is fundamentally the same, the specific process for calculating it differs from traditional operating companies.
In our first article in this series we laid this foundational principle down as follows:
"What gives the business (stock) value?
Ultimately, any business, public or private, has its value derived from the amount of cash flow it is capable of generating for its stakeholders (stockholders). Not only will capital appreciation depend on the level of earnings, dividends are also a function of earnings. It is because of this principle that the discounted cash flow method of valuing a business is so widely accepted by scholars and professional investors. Consequently, this series of articles on how to value a business are going to be strongly based on utilizing fundamental valuations based on cash flows (earnings) as the primary method for finding True Worth™.
Cash Flow Per Unit
This foundational principle applies just as equally to master limited partnerships, as it does to traditional operating businesses. However, there is a subtle difference. Due to their unique tax structure and business organization, pipeline master limited partnerships do not have the same earnings and stock price correlation that you find with a traditional operating business. When analyzing a master limited partnership, earnings per unit, which would closely equate to operating earnings for a traditional operating business, are less important than cash flow per unit.
There are non-cash related accounting adjustments that apply to limited partnerships that reduce reportable earnings. Because of this, if the payout ratios for master limited partnerships were based on earnings per unit, payout ratios would routinely exceed 100%. This is misleading, because it implies that the master limited partnership does not have the cash flow to cover their quarterly required distribution (QRD), the master limited partnerships equivalent of a quarterly dividend. In reality, cash flow per unit without the non cash accounting adjustments will normally exceed the distribution declared per unit.
There are non-cash related accounting adjustments that apply to limited partnerships that reduce reportable earnings. Because of this, if the payout ratios for master limited partnerships were based on earnings per unit, payout ratios would routinely exceed 100%. This is misleading, because it implies that the master limited partnership does not have the cash flow to cover their quarterly required distribution (QRD), the master limited partnerships equivalent of a quarterly dividend. In reality, cash flow per unit without the non cash accounting adjustments will normally exceed the distribution declared per unit.
We're going to look at six prominent pipeline MLPs through the lens of our EDMP, Inc. F.A.S.T. Graphs™ in order to highlight the investment merit they offer. However, since our EDMP, Inc. F.A.S.T. Graphs™ were programmed to evaluate operating businesses, the price and earnings correlations that you would typically find with an operating business are not as clear. On the other hand, the relationship between cash flows and shareholder returns still holds. The EDMP, Inc. F.A.S.T. Graph™ was designed to help investors determine when it was prudent to buy hold or sell a common stock.
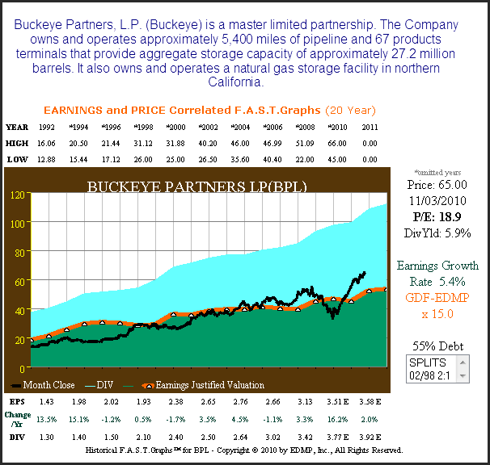
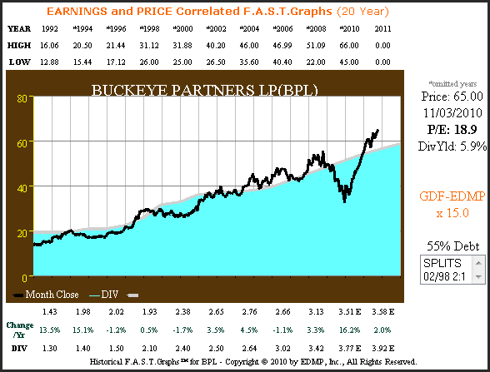
The following F.A.S.T. Graph™ looks at Buckeye Partners (BPL, Financial), one of the oldest and most established master limited partnerships. At first glance, it will appear that the price-to-earnings relationship that is normally found through the lens of our F.A.S.T. Graph™ holds true. However, closer scrutiny will reveal that this relationship between earnings and stock price is not as clear as initial analysis would indicate.
BPL 20yr. Price Earnings Correlated F.A.S.T. Graph™
KMP 20yr. Price Earnings Correlated F.A.S.T. Graph™
KMP 20yr. Performance Results

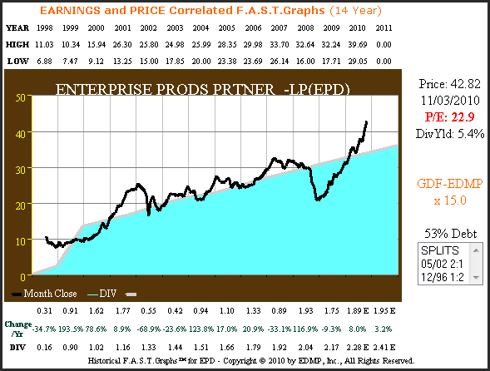
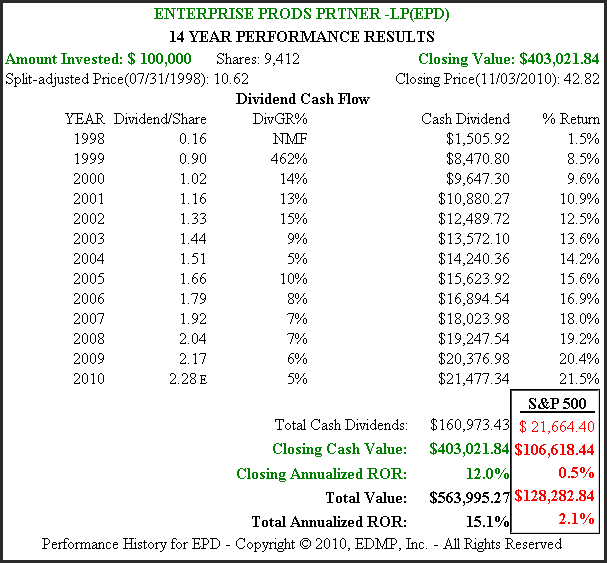
EPD 11yr. Price Earnings Correlated F.A.S.T. Graph™


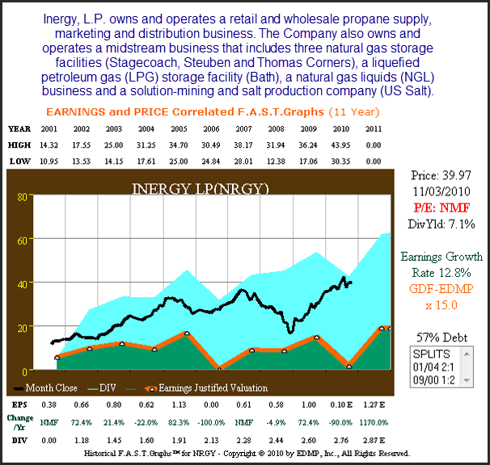
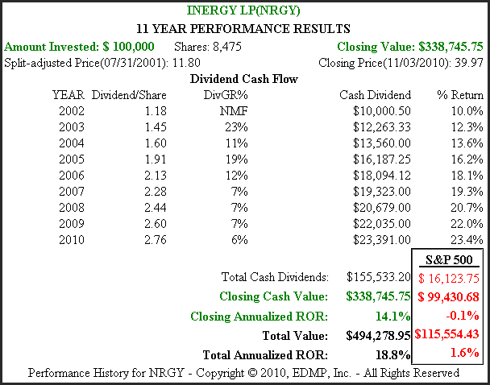
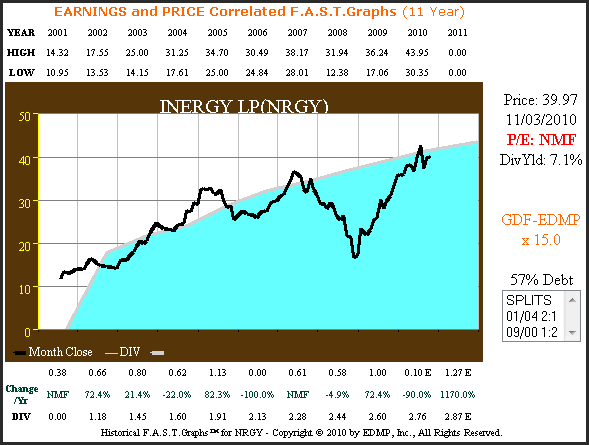
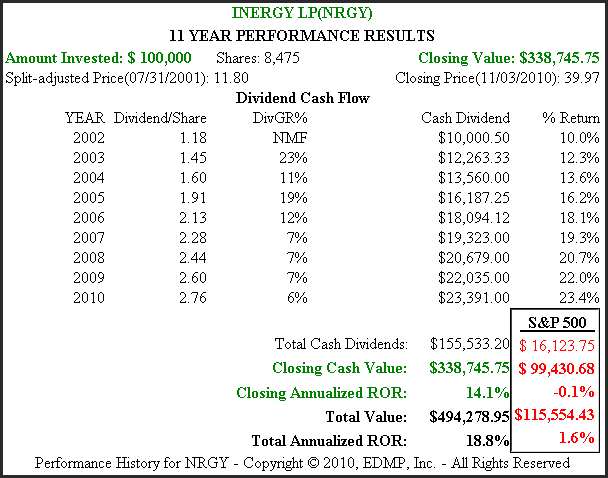
NRGY 11yr. Price Earnings Correlated F.A.S.T. Graph™

The following F.A.S.T. Graph™ looks at Buckeye Partners (BPL, Financial), one of the oldest and most established master limited partnerships. At first glance, it will appear that the price-to-earnings relationship that is normally found through the lens of our F.A.S.T. Graph™ holds true. However, closer scrutiny will reveal that this relationship between earnings and stock price is not as clear as initial analysis would indicate.
BPL 20yr. Price Earnings Correlated F.A.S.T. Graph™

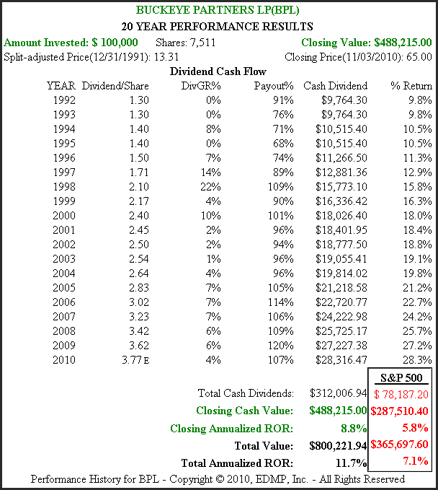
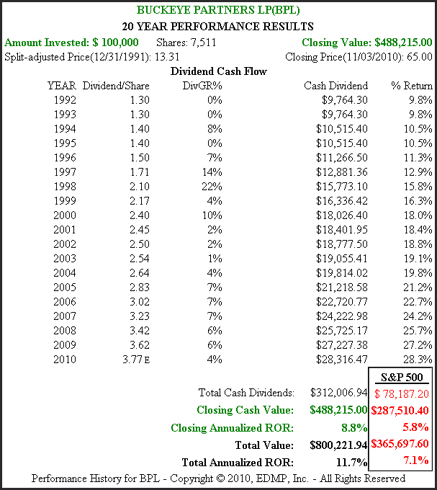
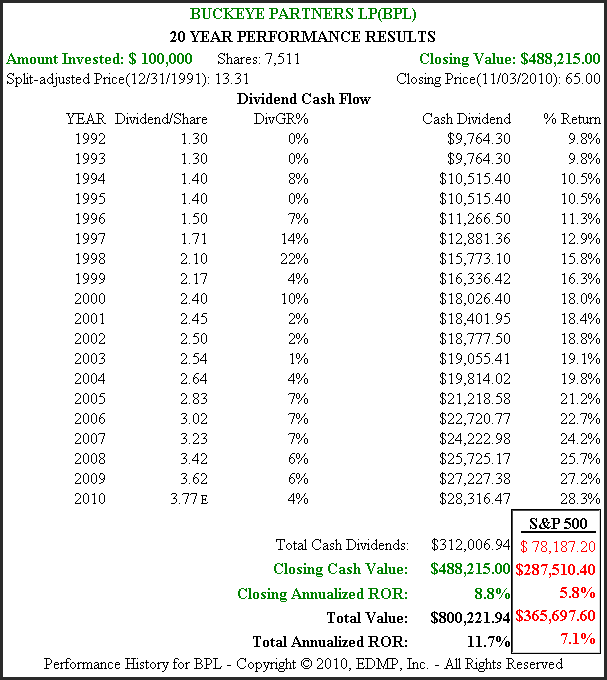
The following performance chart calculating the returns associated with the price-earnings correlated F.A.S.T. Graph™ for BPL reveals a very unusual payout ratio relationship. In calendar year 1998 and calendar year 2000 the payout ratio for Buckeye Partners exceeded 100%. Each year since calendar year 2005 the payout ratio again exceeds 100%. Since this ratio is calculated against operating earnings per unit which are represented by the orange line on the above F.A.S.T. Graph™ it's clear that operating earnings do not cover distributions (dividends).
BPL 20yr. Performance Results

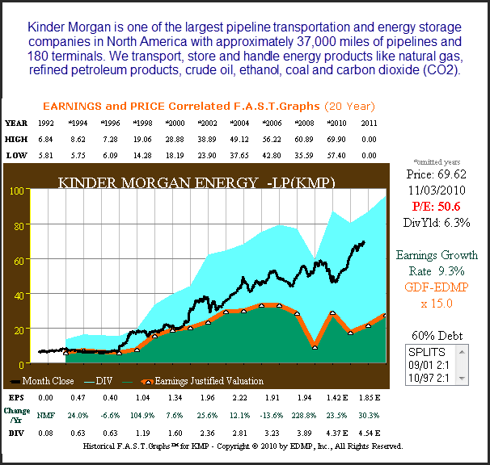
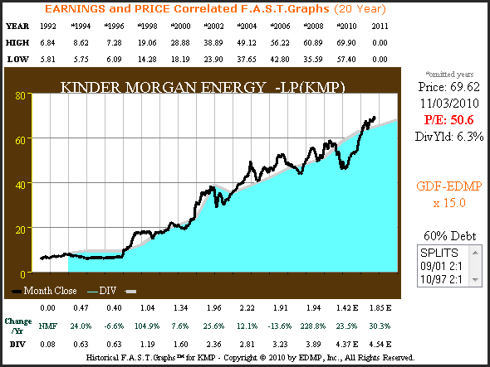
Our next F.A.S.T. Graph™ looks at Kinder Morgan Energy one of the better known pipeline master limited partnerships. In this example, it is much more evident that the normal price-to-earnings functional relationship and correlation does not exist. This could lead the researcher to conclude that earnings are not the primary determinant of shareholder returns for this asset class. However, this would not be entirely correct reasoning. Remember, due to certain non-cash accounting conventions relating to limited partnerships, earnings per unit did not necessarily reflect cash flow per unit. If our F.A.S.T. Graph™ was programmed to calculate cash flow per unit when producing its graphs on MLPs, the stock price to cash flow relationship would be more clear.
KMP 20yr. Price Earnings Correlated F.A.S.T. Graph™

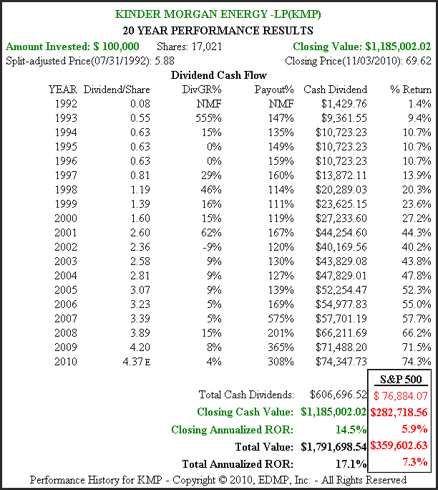
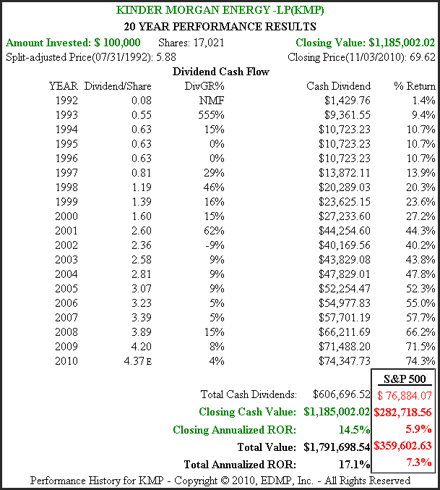
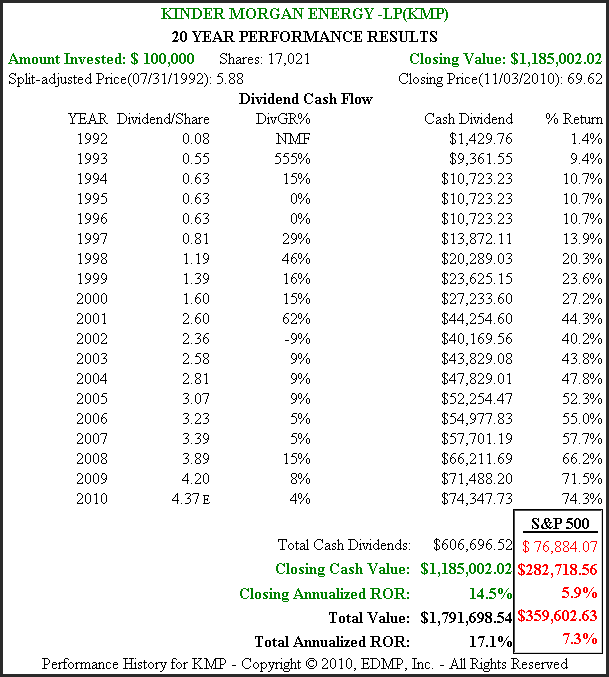
The 20-year performance chart associated with Kinder Morgan illustrates a payout ratio that would clearly be impossible if the quarterly cash distribution had to come out of operating earnings. No company could possibly pay out more than 100% of their cash flows, and in some cases 200%, even as high as 500% over a 20-year time frame. The cash would simply not be there. The price-earnings correlated F.A.S.T. Graph™ on Kinder Morgan is virtually useless in helping investor ascertain the right time to buy sell or hold this master limited partnership.
KMP 20yr. Performance Results

This was frustrating because we knew that the functional relationship between cash flows and shareholder returns was irrefutable. The problem was that with MLPs, earnings per unit did not fully reflect cash flows. The only reason earnings per unit were less than distributions declared per unit were because of non-cash adjustments to cash flows per unit. As an aside, much of the tax benefits to unit holders relate to the special tax treatments that limited partnerships offer. However, the purpose of this series is to help investors determine the proper times to buy sell or hold. Therefore, for purposes of achieving this objective, we will refrain from discussions on tax benefits.
As we analyzed MLPs with our powerful "tools to think with" we soon discovered a very interesting relationship between dividends and stock values. Since cash distributions per-unit were highly correlated to total cash flow per unit, we surmised that they might be a good proxy representing the equivalent of operating earnings to a traditional operating company. Therefore, we shut off our earnings per share (unit) calculation and looked at these master limited partnerships solely from the perspective of dividends (cash distributions declared per unit). What we found was both astonishing and intriguing; stock price tracked dividends very closely.
The following graphs on Buckeye Partners and Kinder Morgan illustrate a stock price and dividend high correlation. The gray line on the dividend chart becomes the "dividend justified value line." In other words, the prudent investor should only buy when the price either touches the gray dividend line or is below it. This is the equivalent of the orange earnings justified valuation line for traditional companies.
BPL 20yr. Price Correlated to Dividends Only F.A.S.T. Graph™
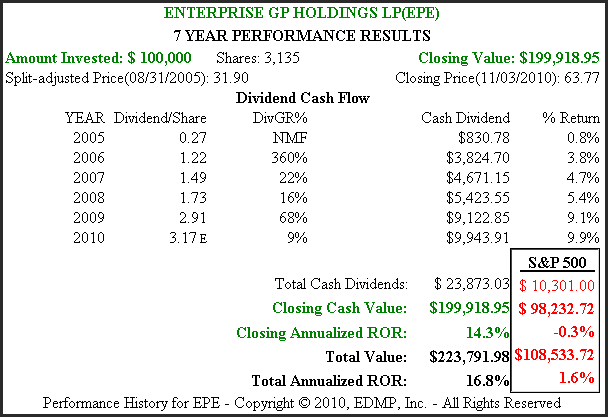
The following fundamentals at a glance analysis through the lens of our F.A.S.T. Graph™ research tool reviews four additional MLPs. Although each has a relatively short history, the majority of these MLPs offer performance results that span the period known as the lost decade. The automatic calculation of past performance is one of the real benefits of the F.A.S.T. Graph™ tool. Instead of relying on statistical references, the researcher is provided specifics on each individual company. Therefore, a more learned perspective is accomplished.
Although the total return provided by each of these MLPs is significantly greater than the S&P 500, it's important to also note that volatility was very significant at times. There is a general impression that MLPs provide stable and predictable income, and this is true. However, as the following analysis illustrates, their stock prices can be very volatile over shorter periods of time. Understanding that this is true could provide the investor the fortitude to stay the course when stock prices are fluctuating wildly. The F.A.S.T. Graphs™ that look at these hybrids from the perspective of price correlated to dividends only, do provide a glimpse of stability. If the investor focuses on the dividend, while ignoring the price volatility it is easier to stay calm.
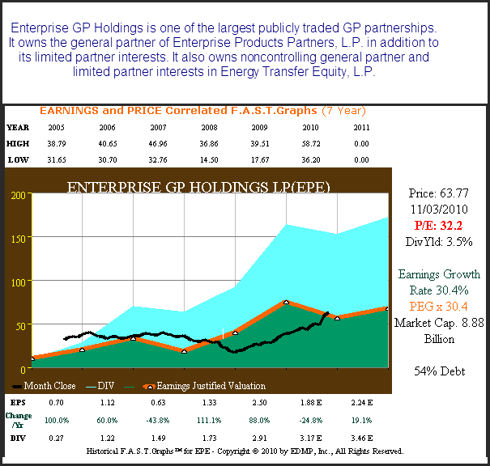
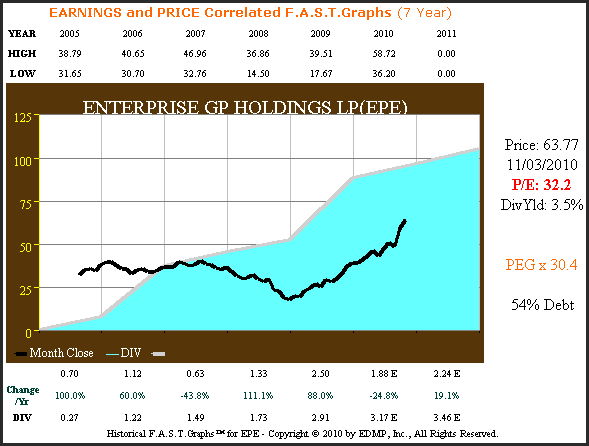
EPE 7yr. Price Earnings Correlated F.A.S.T. Graph™
The following graphs on Buckeye Partners and Kinder Morgan illustrate a stock price and dividend high correlation. The gray line on the dividend chart becomes the "dividend justified value line." In other words, the prudent investor should only buy when the price either touches the gray dividend line or is below it. This is the equivalent of the orange earnings justified valuation line for traditional companies.
BPL 20yr. Price Correlated to Dividends Only F.A.S.T. Graph™

BPL 20yr. Performance (No Payout Ratio) F.A.S.T. Graph™
KMP 20yr. Price Correlated to Dividends Only F.A.S.T. Graph™

KMP 20yr. Performance (No Payout Ratio) F.A.S.T. Graph™
The following fundamentals at a glance analysis through the lens of our F.A.S.T. Graph™ research tool reviews four additional MLPs. Although each has a relatively short history, the majority of these MLPs offer performance results that span the period known as the lost decade. The automatic calculation of past performance is one of the real benefits of the F.A.S.T. Graph™ tool. Instead of relying on statistical references, the researcher is provided specifics on each individual company. Therefore, a more learned perspective is accomplished.
Although the total return provided by each of these MLPs is significantly greater than the S&P 500, it's important to also note that volatility was very significant at times. There is a general impression that MLPs provide stable and predictable income, and this is true. However, as the following analysis illustrates, their stock prices can be very volatile over shorter periods of time. Understanding that this is true could provide the investor the fortitude to stay the course when stock prices are fluctuating wildly. The F.A.S.T. Graphs™ that look at these hybrids from the perspective of price correlated to dividends only, do provide a glimpse of stability. If the investor focuses on the dividend, while ignoring the price volatility it is easier to stay calm.
EPE 7yr. Price Earnings Correlated F.A.S.T. Graph™

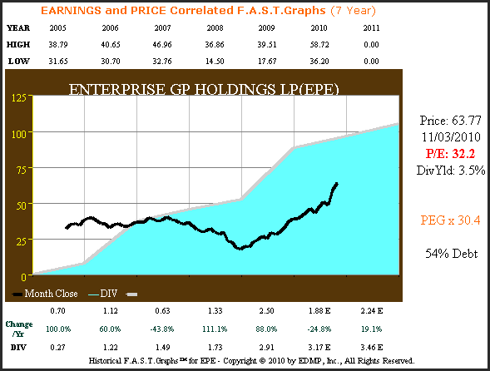
EPE 7yr. Price Correlated to Dividends Only F.A.S.T. Graph™
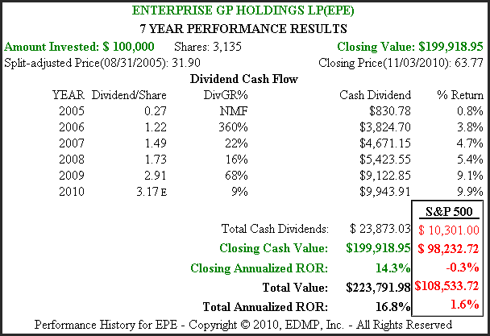
EPE 7yr. Performance (No Payout Ratio) F.A.S.T. Graph™
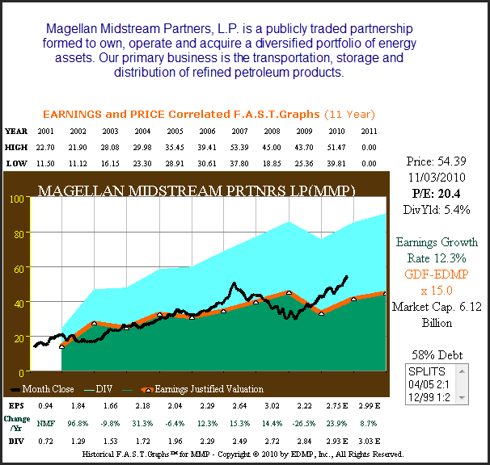
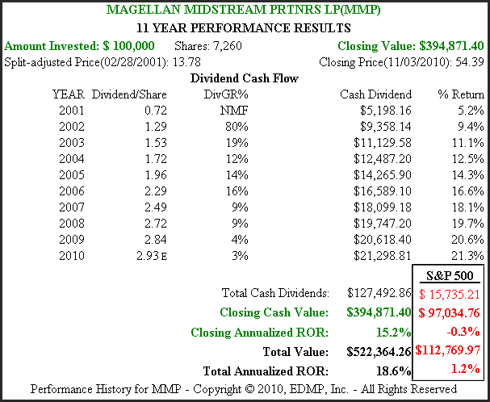
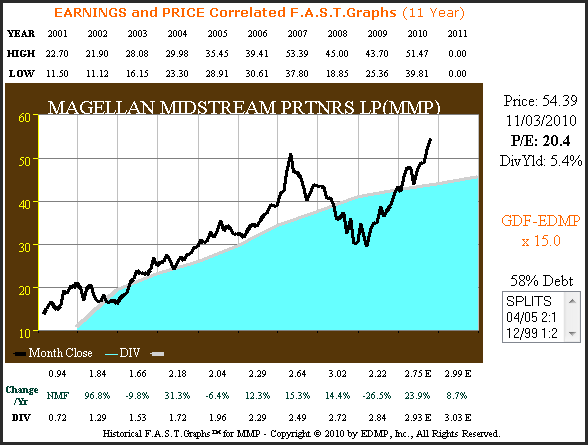
MMP 11yr. Price Earnings Correlated F.A.S.T. Graph™[/b]

[b]MMP 11yr. Price Correlated to Dividends Only F.A.S.T. Graph™
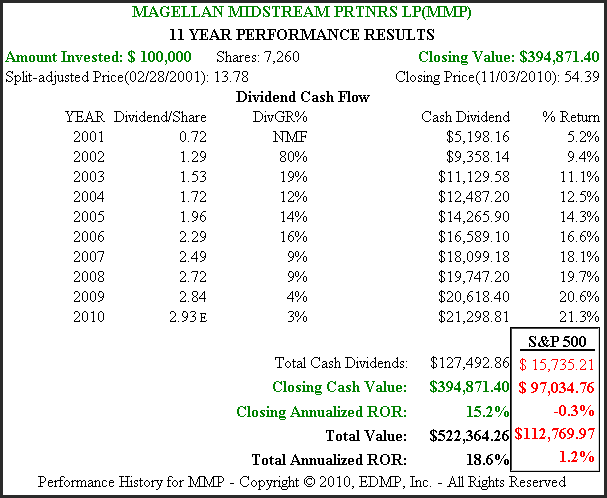
MMP 11yr. Performance (No Payout Ratio) F.A.S.T. Graph™
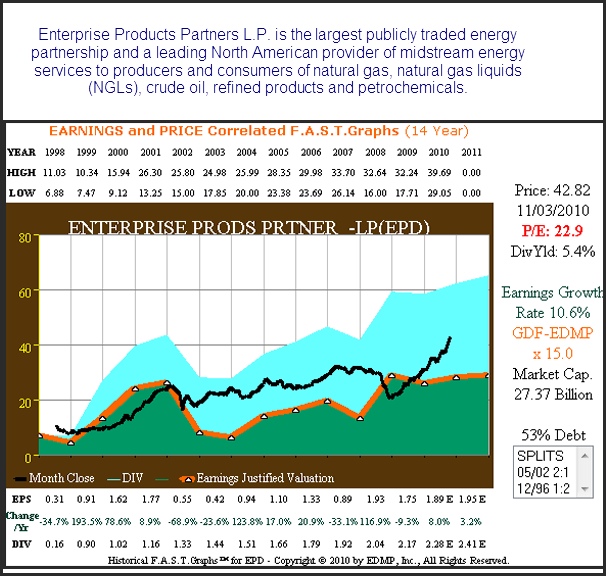
EPD 11yr. Price Earnings Correlated F.A.S.T. Graph™
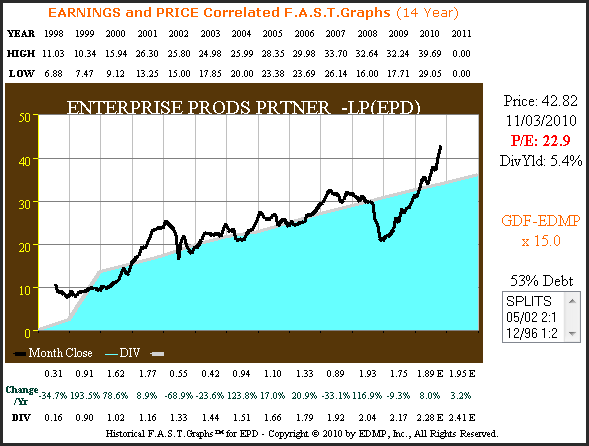
EPD 11yr. Price Correlated to Dividends Only F.A.S.T. Graph™
EPD 11yr. Performance (No Payout Ratio) F.A.S.T. Graph™
NRGY 11yr. Price Earnings Correlated F.A.S.T. Graph™
NRGY 11yr. Price Correlated to Dividends Only F.A.S.T. Graph™
NRGY 11yr. Performance (No Payout Ratio) F.A.S.T. Graph™
Summary and Conclusions
MLPs provide income seeking investors an unconventional, but potentially very attractive investment opportunity. Higher than normal yield and above average capital appreciation provide a total return potential that could be quite rewarding.
Additionally, as the above performance graphs illustrated, MLPs are not correlated with the general stock market or the average publicly traded company. Therefore, they also provide interesting diversification. The quarterly required distribution (QRD) feature of a master limited partnership provides the benefit of a reliable above-average yield coupled with tax benefits.
Additionally, as the above performance graphs illustrated, MLPs are not correlated with the general stock market or the average publicly traded company. Therefore, they also provide interesting diversification. The quarterly required distribution (QRD) feature of a master limited partnership provides the benefit of a reliable above-average yield coupled with tax benefits.
The double taxation normally associated with corporations is avoided because taxes are only paid when distributions are received. The actual rate of the quarterly required distribution is contractually derived between the unit holders and the general partners. However, each unit holders is responsible for paying their own share of the partnerships income taxes. This can lead to complications and complexity when the time comes to file and pay your taxes. Consequently, this particular asset class may not be suitable for everyone.
Finally, as you review the graphs above, pay special attention to valuation. Notice that much of the closing annualized rate of return achieved has been the result of steadily rising prices over the last few years. Therefore, you need to ask yourself whether or not you are comfortable building a position in any or all of these companies at this time.
In our next article in this series we will cover royalty trusts.
The opinions in this document are for informational and educational purposes only and should not be construed as a recommendation to buy or sell the stocks mentioned or to solicit transactions or clients. Past performance of the companies discussed may not continue and the companies may not achieve the earnings growth as predicted. The information in this document is believed to be accurate, but under no circumstances should a person act upon the information contained within. We do not recommend that anyone act upon any investment information without first consulting an investment advisor as to the suitability of such investments for his specific situation.