
This week we review the Q3 GDP revisions from the US and UK, then we look at the October CPI data from Canada and Japan, before finishing with a summary of a selection of emerging market monetary policy decisions over the past week.
1. US Q3 GDP Revision
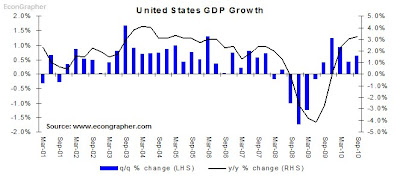
US Q3 GDP was revised up to a 2.5% seasonally adjusted annualised rate, from the previous estimate of 2.0%, this was ahead of expectations for 2.4%. Within the results final demand was revised up, and net exports made a smaller negative contribution. Year on year GDP is up 3.2% vs 3.0% in the September quarter. Overall the result is relatively strong, showing a continuation of the bounce back, and it could well gain momentum, but the more likely outcome is ups and downs over the next year.
2. UK Q3 GDP Revision
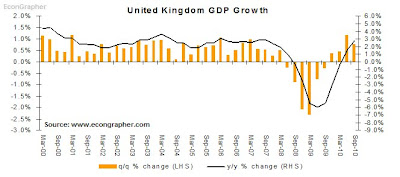
UK GDP expanded 0.8% from the June quarter, in line with previous data, and placing the UK economy ahead by 2.8% compared to 2009. In the detail the stronger sectors were construction, manufacturing, exports, and transport, storage and communication services. While the weaker sectors were mining and utilities. The UK economies continues to bumble along out of recession, but it is quite promising that exports are expanding, the test will be how the UK government can manage its budget and how monetary policy plays out from here.
3. Japan Consumer Price Index
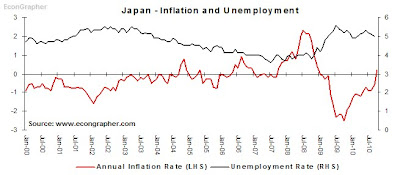
Japan saw its first positive year on year inflation rate in October, with CPI increasing 0.2% year on year, vs -0.6% in September. But it can't really be said that deflation is done, as much of the increase in the CPI was related to an increase in tobacco taxes. But it will be a welcome result to the Bank of Japan, which has been trying and trying to stimulate the economy and start inflation going again, instead of the persistent and pernicious deflation.
4. Canada Consumer Price Index
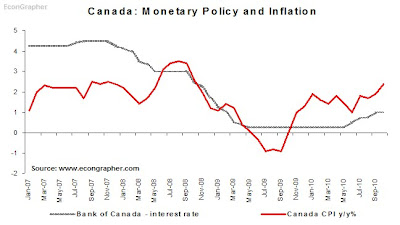
Canada saw a bit of a jump in inflation in October, with the CPI increasing 2.4% year on year vs 1.9% in September. This has caused the market to anticipate further rate rises from the Bank of Canada, which last changed the key policy rate to 1.00% in September, as part of a gradual normalization of monetary policy. Canada in many ways has been relatively lucky in coming through the crisis, and is in some ways similar to Australia, with its rich natural resources.
5. Monetary Policy Review
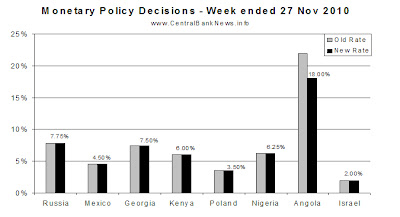
The past week saw several emerging market economies review their monetary policy interest rate settings, including; Russia, Mexico, Georgia, Kenya, Poland, Nigeria, Angola, and Israel. The main standout was Angola, which slashed its benchmark rate -394 basis points to 18.00% as a new central bank governor took the helm. Nigeria and Israel also made adjustments to the spread between borrowing and lending around the main policy rate, as steps towards policy normalisation following the global recession. But basically the main theme was a lot of holding rates, with much of the justification being that rates were appropriate at current settings either due to inflation being contained or relatively high, and overall balancing the risks of growth and inflation.
Summary
So we saw GDP expanding in the US, and at a faster pace than expected, and with promising signs in the details. Meanwhile in the UK the results were also relatively positive. But for both nations the challenge for their economies will be to carry on the momentum of the initial bounce back - but in a sustainable manner.
On the inflation and monetary policy front, there were positive, but not fabulous results in Japan, as the first positive headline inflation figure came through in almost 2 years. While Canada saw an acceleration of inflation, and speculation of further rate hikes. On monetary policy, there was a few meetings over the week but very little action, as settings were seen appropriate in achieving the balance between growth risks and inflation risks.
Sources
1. US Bureau of Economic Analysis www.bea.gov
2. National Statistics Office www.statistics.gov.uk
3. Trading Economics www.tradingeconomics.com
4. Trading Economics www.tradingeconomics.com
5. Central Bank News www.centralbanknews.info
Article Source: http://www.econgrapher.com/top5graphs27nov.html
1. US Q3 GDP Revision
US Q3 GDP was revised up to a 2.5% seasonally adjusted annualised rate, from the previous estimate of 2.0%, this was ahead of expectations for 2.4%. Within the results final demand was revised up, and net exports made a smaller negative contribution. Year on year GDP is up 3.2% vs 3.0% in the September quarter. Overall the result is relatively strong, showing a continuation of the bounce back, and it could well gain momentum, but the more likely outcome is ups and downs over the next year.

2. UK Q3 GDP Revision
UK GDP expanded 0.8% from the June quarter, in line with previous data, and placing the UK economy ahead by 2.8% compared to 2009. In the detail the stronger sectors were construction, manufacturing, exports, and transport, storage and communication services. While the weaker sectors were mining and utilities. The UK economies continues to bumble along out of recession, but it is quite promising that exports are expanding, the test will be how the UK government can manage its budget and how monetary policy plays out from here.

3. Japan Consumer Price Index
Japan saw its first positive year on year inflation rate in October, with CPI increasing 0.2% year on year, vs -0.6% in September. But it can't really be said that deflation is done, as much of the increase in the CPI was related to an increase in tobacco taxes. But it will be a welcome result to the Bank of Japan, which has been trying and trying to stimulate the economy and start inflation going again, instead of the persistent and pernicious deflation.

4. Canada Consumer Price Index
Canada saw a bit of a jump in inflation in October, with the CPI increasing 2.4% year on year vs 1.9% in September. This has caused the market to anticipate further rate rises from the Bank of Canada, which last changed the key policy rate to 1.00% in September, as part of a gradual normalization of monetary policy. Canada in many ways has been relatively lucky in coming through the crisis, and is in some ways similar to Australia, with its rich natural resources.

5. Monetary Policy Review
The past week saw several emerging market economies review their monetary policy interest rate settings, including; Russia, Mexico, Georgia, Kenya, Poland, Nigeria, Angola, and Israel. The main standout was Angola, which slashed its benchmark rate -394 basis points to 18.00% as a new central bank governor took the helm. Nigeria and Israel also made adjustments to the spread between borrowing and lending around the main policy rate, as steps towards policy normalisation following the global recession. But basically the main theme was a lot of holding rates, with much of the justification being that rates were appropriate at current settings either due to inflation being contained or relatively high, and overall balancing the risks of growth and inflation.
Summary
So we saw GDP expanding in the US, and at a faster pace than expected, and with promising signs in the details. Meanwhile in the UK the results were also relatively positive. But for both nations the challenge for their economies will be to carry on the momentum of the initial bounce back - but in a sustainable manner.
On the inflation and monetary policy front, there were positive, but not fabulous results in Japan, as the first positive headline inflation figure came through in almost 2 years. While Canada saw an acceleration of inflation, and speculation of further rate hikes. On monetary policy, there was a few meetings over the week but very little action, as settings were seen appropriate in achieving the balance between growth risks and inflation risks.
Sources
1. US Bureau of Economic Analysis www.bea.gov
2. National Statistics Office www.statistics.gov.uk
3. Trading Economics www.tradingeconomics.com
4. Trading Economics www.tradingeconomics.com
5. Central Bank News www.centralbanknews.info
Article Source: http://www.econgrapher.com/top5graphs27nov.html