
Valuation Based on Fundamentals
In order to prudently answer the question of when to buy a stock, an investor first needs to know the value of the company behind the stock. At the most basic level, a company derives its value based on the fundamentals behind the business it operates. Focusing on, and calculating the fundamental value of a company, lies at the core that differentiates the investor from the speculator. Investors want to know what the business is worth, and where its value comes from past, present and future. Speculators, on the other hand, are mainly interested in the price of the stock and typically only concerned with its recent movement.
As we mentioned in part 1 of this series on valuation, Ben Graham often extolled the virtues of investing over speculating. In part I of Common Sense Investing: the papers of Benjamin Graham written by Benjamin Graham (courtesy of ValueHuntr), Ben started with a discussion titled; Investment versus Speculation. The first paragraph summarized his thoughts on this important matter, and we believe that Ben's basic ideas hold true today, and are quoted below:
"One of the disastrous consequences of the New Era madness in Wall Street has been the disappearance of the former clean-cut distinctions between investment and speculation in common stocks. Old-time investment, with its emphasis on book value and the past record was shortsighted and naïve, but it possessed the supreme virtue of moderation. Present day "investment," as practiced by investment trusts and everyone else, is not much more than an undisciplined wagering upon the future and as such logically indistinguishable from speculation."
If it's true that a company gets its value based on fundamentals, and we believe it is, then analyzing and evaluating the fundamental value of the common stock the investor is interested in purchasing, should be of paramount importance. Furthermore, having a sense of how well a company has performed on an operating basis should provide great insight into the value it provides to its shareholders. Unfortunately, most information provided to prospective investors is, as previously mentioned, focuses almost solely on price. Therefore, to paraphrase an adage; investors today know the price of every common stock and the value of none of them.Calculating the fundamental value of a business has typically been an arduous and time-consuming task. The investor was required to pore over complex financial statements and reports in order to glean the necessary information with which to make an informed judgment on valuation. Perhaps this is one of the primary reasons why so few investors have been up to the task. Most sane people would find this process too tedious and boring to even contemplate, let alone do. Even though the fundamentals are vital and necessary in order to make an informed decision, the job is just too complicated and/or tedious for most people to want to do.
F.A.S.T. Graphs™: Essential Fundamentals at a Glance
The F.A.S.T. Graphs™ research tool was developed in order to make it easier for prospective investors to ascertain the fundamental value of a business (common stock) they were interested in. The F.A.S.T. Graphs™ draw a picture that displays essential fundamentals at a glance, but they are not meant to be the final word in the due diligence process. However, they were designed to provide an insightful perspective of how well a company has historically been managed, to include how the market has generally valued the company's operating performance. This powerful research tool has been programmed to extract the essential fundamentals behind each publicly traded business and provide an easy to review graphical interface between price and fundamentals.
Most importantly, the primary focus of this research tool is on the company's earnings power, and then determining a fair value to apply to those earnings. Each company's earnings-per-share is plotted, and the growth rate of those earnings are calculated for any timeframe the investor chooses to review. This can be as short as the last two or three years or all the way out to the past couple of decades. It is recommended that users run various time periods in order to determine whether growth is accelerating, decelerating or remaining constant.
The central idea is to determine a fair and reasonable valuation that can, and should, be applied to each company under review. A fair valuation, which we call True Worth™, is functionally related to the rate of change of earnings growth the company achieves. In part 1 of this series, we focused on low growth companies (0% to 5%) and applied Ben Graham's famous formula in order to calculate True Worth™. However, for companies that have moderate growth, which we define as ranging between 5% and 15%, we apply a modified version of Ben Graham's formula. The following examples look at several companies and their stock price correlated to earnings growth through the lens of our F.A.S.T. Graphs™ research tool.We are going to compare four sets of two companies each that have very similar fundamentals statistically. Our goal is to illustrate how statistics alone do not often tell an adequate story in order to make a learned decision. We're first going to present the fundamentals only, which will display earnings and dividends. Then we will overlay stock prices in order to illustrate how stock prices follow or correlate with earnings over the long run. The important distinction with these F.A.S.T. Graphs™ is the focus on fundamentals first and stock price second. This is in contrast to most stock charts, including ones dealing in technical analysis, whose primary focus is on stock price and stock price movement.Our contention is that looking at price alone provides a lot of information, but no knowledge or wisdom. We believe that true wisdom occurs when stock prices are viewed in relation to the fundamental value of the business. Therefore, a perspective of whether a company is overvalued, fairly valued or undervalued becomes readily apparent. When information is presented in this way, we believe the investor can possess the wisdom to make truly informed, and therefore, sound decisions.
Here is a simple explanation on how to interpret the following F.A.S.T. Graphs™:
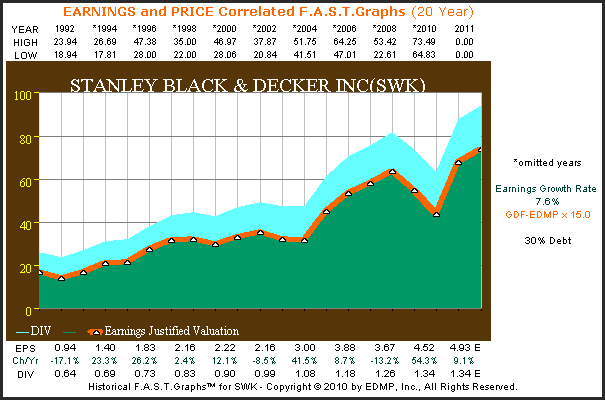
The first F.A.S.T. Graphs™ in each set of two will display earnings and dividends only. The green shaded area shows earnings, the light blue shaded area depicts dividends paid out of those earnings. The orange line represents True Worth™ based on valuing the earnings under a modified version of Ben Graham's formula that deals with moderate growth stocks. The earnings growth rate, the GDF-EDMP (modified Ben Graham formula) PE ratio and the debt to equity ratio are listed to the right of each graph.
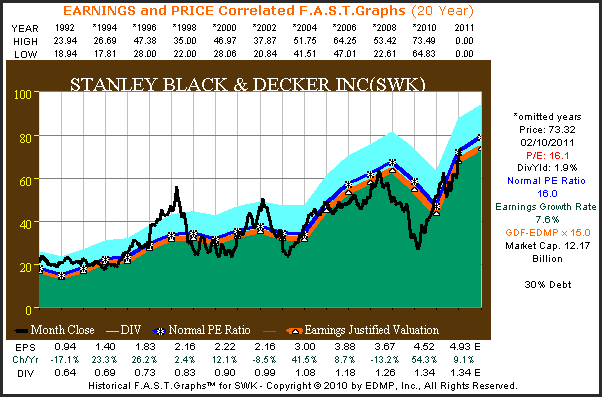
The next set of F.A.S.T. Graphs™ will add two additional, but very important lines. The black line represents monthly closing stock prices, and the royal blue line represents the calculated normal PE ratio that the market has historically applied to the company's stock price. Included with this set will be the calculated performance results for each company over the time period measured (note that there is one year of forecast on these charts which are not included in the return calculations). The most important takeaway from these calculated performance results is to observe how closely capital appreciation (closing annualized ROR) correlates to earnings growth, adjusted by valuation.
A brief commentary will be provided on each set of graphs for clarification. However, time and space restraints do not allow us to provide in-depth analysis on each company. There are two primary purposes behind this article. First, we illustrate how important fundamentals are to valuation. Second, our objective is to illustrate how earnings drive shareholder returns over the long run. In other words, capital appreciation will equate to earnings growth adjusted by valuation discrepancies. Also, note how dividends represent icing on the cake and will add to the total return.
F.A.S.T. Graphs™: Stanley Black & Decker versus Bemis Co. Inc.An advantage of the F.A.S.T. Graphs™ research tool is to provide an instant perspective of how well a company has performed on a fundamental basis over time. Although Stanley Black & Decker Inc. (SWK, Financial) has grown earnings at a compounded rate of 7.6% per annum since 1992, the road to growth was often bumpy.
 In contrast, Bemis (BMS, Financial) generated a slightly higher, but similar, earnings growth rate of 8.2% with a lot less cyclicality involved. However, Bemis did experience some cyclicality over the timeframe 2007 through 2009.
When stock prices are overlaid on top of the Stanley Black & Decker's (SWK) earnings only graph, we see a strong correlation between price and earnings. On the other hand, there are several instances where price gets temporarily disconnected from their earnings justified value (the orange line) but quickly return. This is a good example of how overvaluation, fair valuation and undervaluation can be easily recognized when price and fundamentals are looked at and correlated together.
 The performance results for Stanley Black & Decker (SWK) clearly illustrate the correlation between earnings growth and shareholder returns over the long run. Also, even though earnings growth has been somewhat cyclical, notice how consistently dividends have grown for this company since 1992.
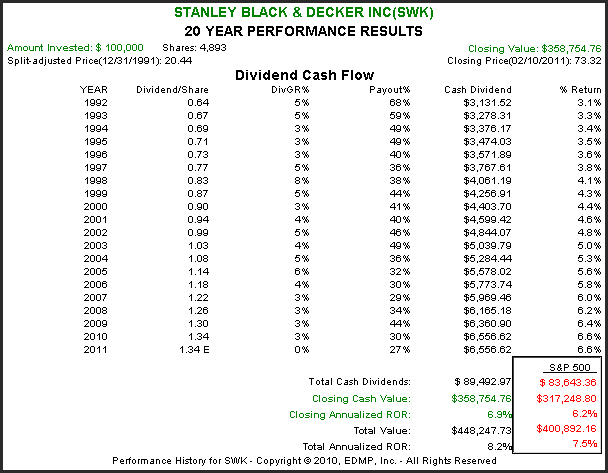 When looking at the price-earnings correlated F.A.S.T. Graphs™ on Bemis (BMS) we once again see a strong correlation between price and earnings. However, we also see that the market has tended to generally apply a premium valuation to this company's more consistent record of growth. This is a significant piece of information that prospective investors can benefit from.
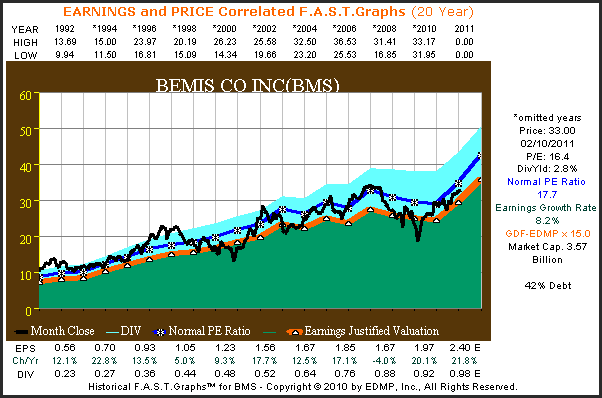 When evaluating the performance associated with Bemis since 1992, we find that the correlation between earnings growth and shareholder returns is closely correlated. However, we should note that modest overvaluation in the beginning of the period caused capital appreciation to fall slightly below the earnings growth rate.
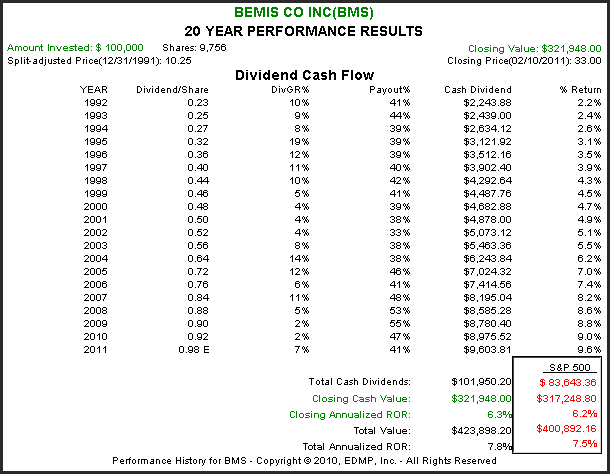 F.A.S.T. Graphs™: CR Bard Inc. versus Echo Lab Inc.The earnings and dividend only F.A.S.T. Graphs™ on CR Bard Inc. (BCR, Financial) depict a company that has generated very consistent earnings growth at an above-average double-digit rate. We also see that the company has a very low debt to equity ratio of only 6%.
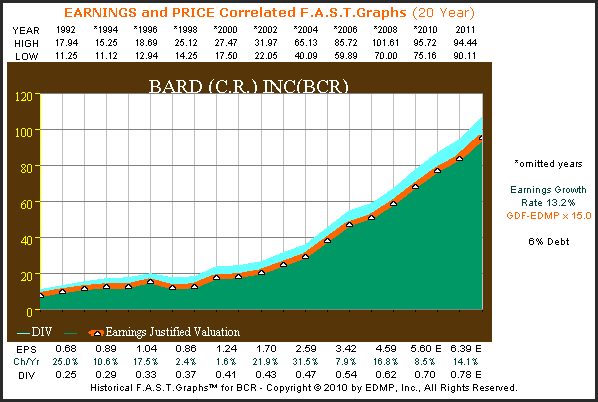 The earnings and dividends only F.A.S.T. Graphs™ on Echolab Inc. (ECL, Financial) show that they too have a very consistent record of increasing earnings at an above-average rate. However, Echolab Inc. (ECL) does have a higher debt to equity ratio at 30%.
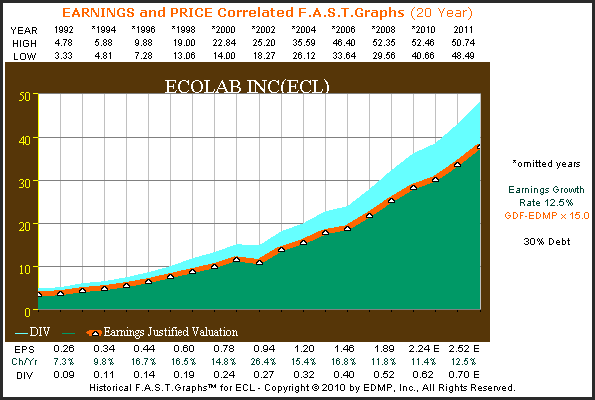 With the earnings and price correlated F.A.S.T. Graphs™ on CR Baird Inc. (BCR), you will notice that although the company pays dividends, both yield and the payout ratio are low. This generally applies to a company that is still in a strong growth phase, and therefore, in need of utilizing their capital to fund future growth. We also see that from 2003 to 2008 the market placed a premium valuation on their stock, until the great recession caused their price to revert to the mean. This period of overvaluation is what caused the historical PE ratio to be so high. This is a vivid example of how easy it is to recognize overvaluation, and the risk associated with it.
 The calculated performance results associated with the CR Bard F.A.S.T. Graphs™ above, once again, validates how the rate of change of earnings growth ultimately drives shareholder returns. The 10% capital appreciation (closing annualized ROR) is only lower than the 13% earnings growth due to greater overvaluation at the beginning than at the end of the timeframe measured. Also, even though dividends sweeten the pot a little, the majority of CR Bard's shareholder returns were the result of the market capitalizing earnings growth.
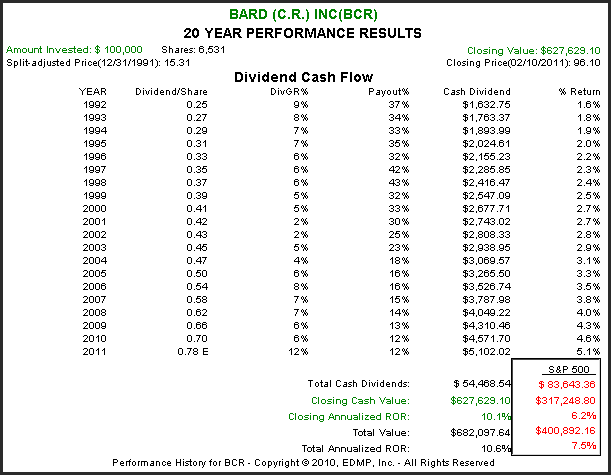 The earnings and price correlated F.A.S.T. Graphs™ on Ecolab Inc. (ECL) tell a very interesting story. For the first five years, 1992 to 1997, Ecolab Inc.'s stock price correlated very closely with their earnings growth. However, it is not only interesting but also important to recognize that since 1997, the stock market has placed a very high premium on Ecolab Inc.'s stock price relative to their earnings growth. Although we feel that this is irrational, it is nevertheless an important piece of information for investors to have. At least with this knowledge, the decision of whether to invest at such high valuations, or not, can be made with your eyes wide open.
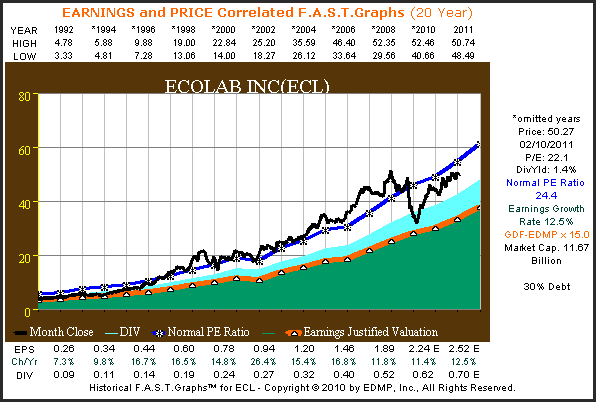 It is also very interesting to see how long-term returns have correlated closely with long-term earnings growth for Ecolab Inc. shareholders. The calculated performance results shown below illustrate that Ecolab Inc.'s capital appreciation (closing annualized ROR) is only moderately higher than earnings growth because of ending overvaluation.
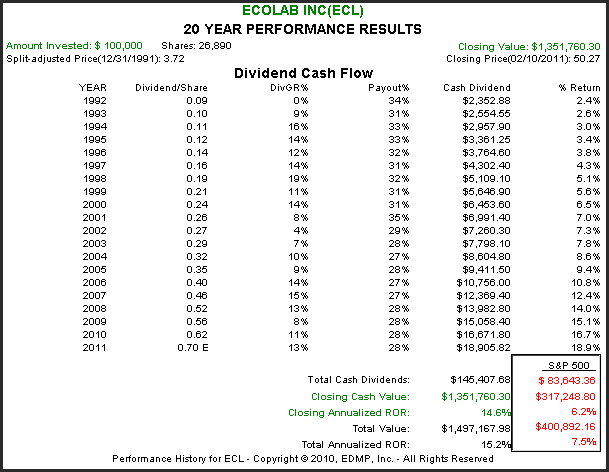 F.A.S.T. Graphs™: Target Corp. versus Sherwin Williams Co.The earnings and dividends only F.A.S.T. Graphs™ on Target Corp. (TGT, Financial) depict a company with above average and mostly consistent long-term earnings growth. Even though this company's earnings growth was interrupted during the great recession, 2008 was still one of the most profitable years that Target Corp. ever had. At a glance, we see a company with a very strong long-term operating record.
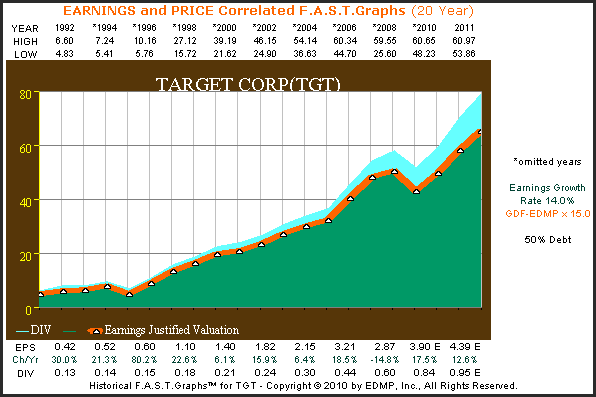 The earnings and dividends only F.A.S.T. Graphs™ on Sherwin Williams Co. (SHW, Financial) also display a very good long-term record of earnings growth. However, there are bouts of cyclicality that have arisen on occasion. Also we can see an earnings drop during the recession of 2001, and two years of falling earnings during the housing related great recession of 2008.
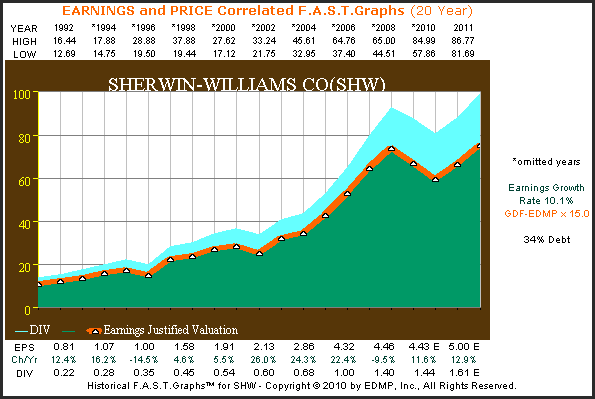 The earnings and price correlated F.A.S.T. Graphs™ on Target Corp. (TGT) depict a very strong long-term correlation between earnings and stock price. However, we also can see a lot of inter-year volatility, especially from 1998 through 2008. It's also interesting to see that since the great recession, Target Corp.'s stock price has recovered from excessive undervaluation and now trades at fair valuation as price currently tracks the orange earnings justified valuation line.
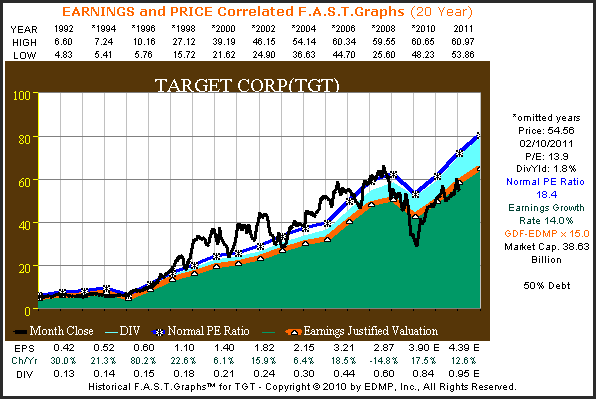 The calculated performance results for Target Corp. (TGT) from 1992 to current clearly show that the company's rate of change of earnings growth translated into similar shareholder returns. At the end of the day, Target Corp.'s stock price started out close to fair value and ended up at fair value. Therefore, Target Corp.'s capital appreciation (closing annualized ROR) mirrors their achieved earnings growth rate.
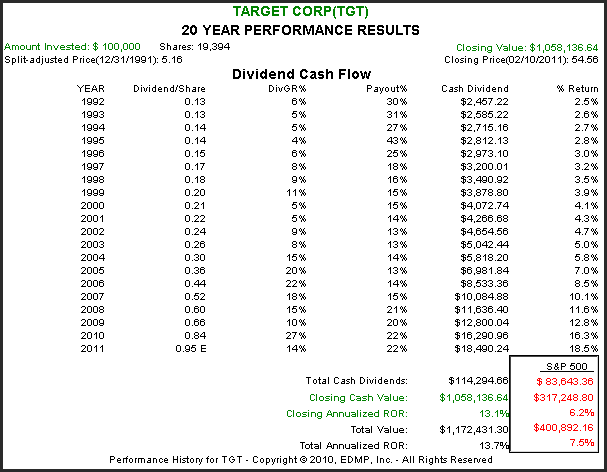 The earnings and price correlated F.A.S.T. Graphs™ on Sherwin Williams Co. (SHW) show that in the long run stock prices track and follow earnings. Once again, showing how fundamentals drive stock values over time.
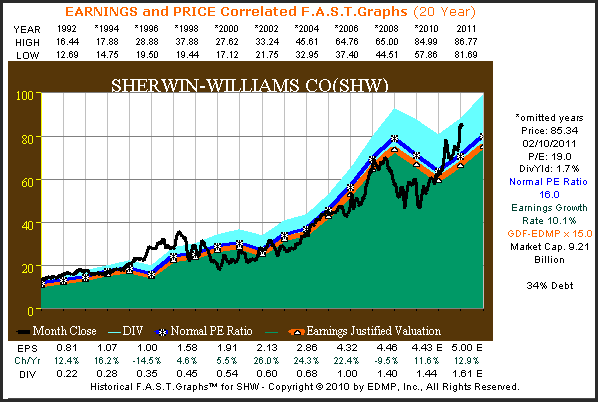 The calculated performance results for Sherwin-Williams Co. (SHW) illustrate that shareholder returns and operating results are almost perfectly matched. There will always be short-term volatility, but in the long-run earnings determine market price.
 F.A.S.T. Graphs™: Dover Corp. versus Sigma Aldrich Corp.The earnings and dividends only F.A.S.T. Graphs™ on Dover Corp. (DOV, Financial) instantly provides a clear insight into this company's operating results. When the economy is healthy, Dover Corp. has a history of growing earnings per share very nicely. However, it is also clear from the F.A.S.T. Graphs™ below that the company's operating results are very sensitive to recessions. During both the recessions of 2001 and 2008, Dover Corp.'s earnings experienced a precipitous drop. On the other hand, as the economy improved, earnings growth quickly recovers and grows again.
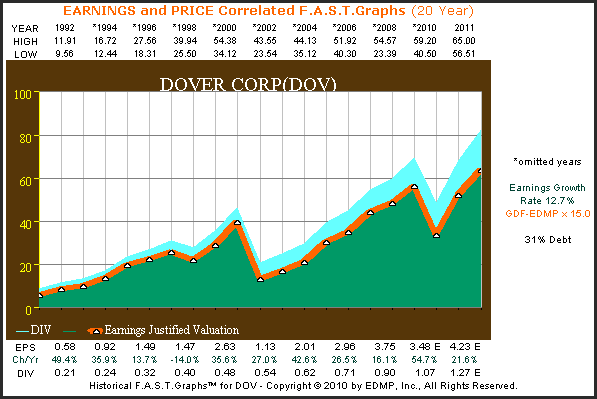 In contrast to Dover Corp., the earnings and dividend only F.A.S.T. Graphs™ on Sigma-Aldrich Corp. (SIAL, Financial) depict a company with very consistent earnings growth and a great deal of recession resistance. Although Sigma-Aldrich Corp.'s earnings growth was slightly lower than Dover Corp.'s, they achieved their growth a lot more reliably and consistently.
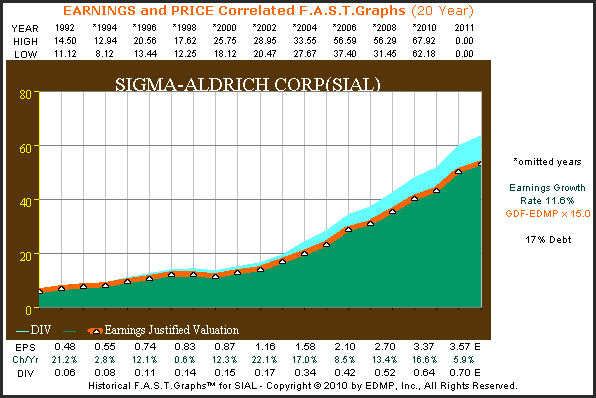 From the earnings and price correlated F.A.S.T. Graphs™ on Dover Corp., we once again see the strong relationship between earnings and stock price over time. During both recessions, 2001 and 2008, Dover Corp.'s stock price followed earnings down. But just like earnings, stock price recovered as the economy improved.
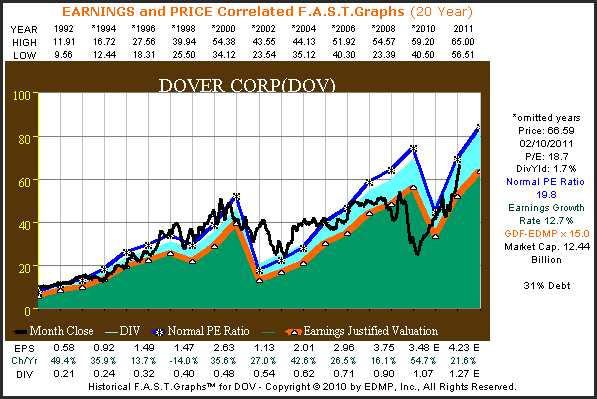 Once again, when we calculate performance associated with the F.A.S.T. Graphs™ on Dover Corp. (DOV) we find the strong relationship between earnings and stock price. The only reason that both numbers are not exact is based on minor valuation discrepancies at the beginning and ending periods.
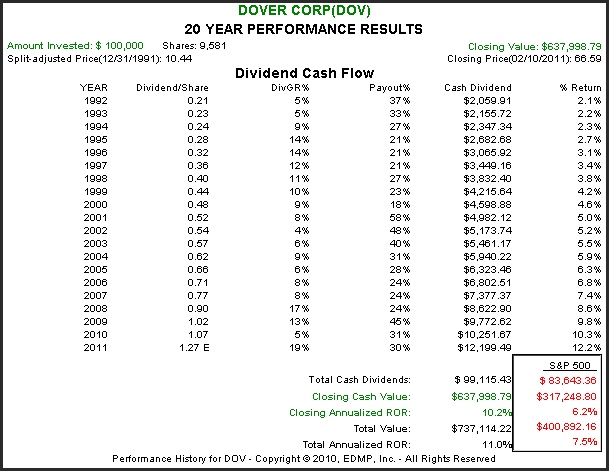 The earnings and price correlated F.A.S.T. Graphs™ on Sigma-Aldrich Corp. (SIAL) show that the stock market has generally applied a premium valuation to this company's stock price, apparently as a reward for its consistent operating results. Once again, this is an important piece of information for the investor to have. However, the decision to be willing to pay more for this company than earnings justify is left up to the perspective investor's discretion.
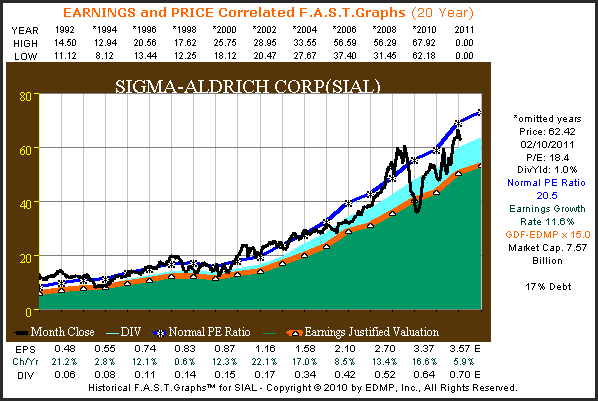 The most important point to be gleaned from the calculated performance results from the earnings and price correlated F.A.S.T. Graphs™ on Sigma-Aldrich relates to valuation. Since Sigma-Aldrich Corp. (SIAL) was overvalued starting out in 1992, long-term shareholder returns were less than earnings growth. On the other hand, thanks to their strong and consistent earnings growth, long-term shareholders still outperformed the S&P 500.
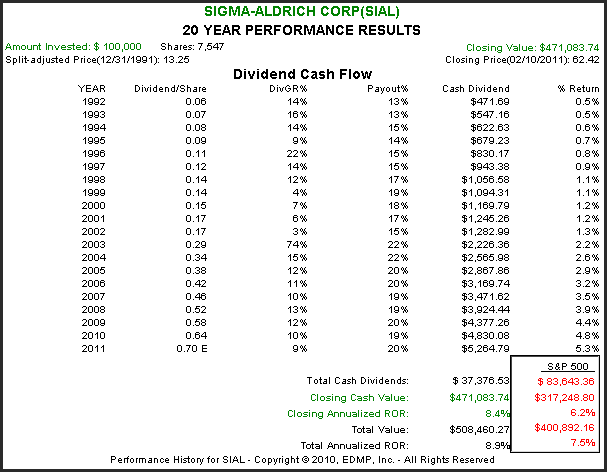 Summary and ConclusionsTo us, the evidence is crystal clear, fundamentals provide a critical perspective that investors should be aware of. Possessing a clear and accurate picture of how well a business has performed on an operating basis is a vital component towards making sound and prudent investment decisions. Contrary to what some might argue, the fundamental operating results of the business tend to persist. The nature of a company's business and the industry it operates in can be reliably evaluated and understood.There are two quotes from the venerable investor Martin J. Whitman, chairman of the board, Third Avenue Value Fund that nicely summarize the main points of this article. The first deals with how much easier it is to determine the True Worth™ value of a business, then it is to guess what its stock price might do in the short run, it is as follows:"I remain impressed with how much easier it is for us, and everybody else who has modicum of training, to determine what a business is worth, and what the dynamics of the business might be, compared with estimating the prices at which a non-arbitrage security will sell in near-term markets." Martin J. Whitman, Chairman of the Board, Third Avenue Value FundThis second and final quote addresses the notion that fundamental values are more important than short-term price volatility. Unfortunately, most people take their guide from price volatility while almost totally ignoring fundamental valuations. We believe this is a mistake, and humbly submit that our F.A.S.T. Graphs™ research tool can greatly assist investors in overcoming this error."Unrealized Market Depreciation occurs when the market price of a publicly traded security declines. Permanent impairment of Capital occurs when the Fundamental values of a business are dissipated with the consequent long-term adverse consequences." Martin J. Whitman, Chairman of the Board, Third Avenue Value FundAs we have stated before, we believe that measuring performance without simultaneously measuring valuation is a job half done. Finally, valuation matters a lot, and deserves more attention than it gets. Wise investors understand this, stand to earn higher long-term returns at lower levels of real risk.The opinions in this document are for informational and educational purposes only and should not be construed as a recommendation to buy or sell the stocks mentioned or to solicit transactions or clients. Past performance of the companies discussed may not continue and the companies may not achieve the earnings growth as predicted. The information in this document is believed to be accurate, but under no circumstances should a person act upon the information contained within. We do not recommend that anyone act upon any investment information without first consulting an investment advisor as to the suitability of such investments for his specific situation.