
Earthquake hits NYC, BAC blamed.
After a rare East Coast earthquake shook New York City Tuesday, this was one of a number of tweets I saw blaming the tremor on Bank of America (another suggested what we felt was BAC's implosion).
Bank of America is one of the top holdings of Bruce Berkowitz's Fairholme Fund, and when Berkowitz spoke at the American Association of Individual Investors in Manhattan earlier this summer, it was the stock he spent the most time talking about.
Meet the domestic stock fund manager of the decade

That's the title Morningstar gave Bruce Berkowitz (pictured above) earlier this year. As I mentioned above, Berkowitz spent most of his time talking about BAC in his AAII presentation in June. The steep drop in Bank of America shares since prompted me to look back at its relative hedging costs over time, as I've tracked them in posts about hedging the Dow.
High optimal hedging costs as a red flag?
Since late March, I've updated the hedging costs of each Dow component, and the SPDR Dow Jones Industrial Average ETF (DIA), using optimal puts, seven times. In five of those seven posts, starting with this one published on April 21, "Hedging the Dow, an Update", BAC had the highest hedging costs of any Dow component. Let's take a look at the table from that article published on April 21, but first, a quick reminder about optimal puts.
About optimal puts
Optimal puts are the ones that will give you the level of protection you want at the lowest possible cost. As University of Maine finance professor Dr. Robert Strong, CFA has noted, picking the most economical puts can be a complicated task. With Portfolio Armor (available on the web and as an Apple iOS app), you just enter the symbol of the stock or ETF you're looking to hedge, the number of shares you own, and the maximum decline you're willing to risk (your threshold — you can enter any percentage you like, but the larger the percentage, the greater the chance there will be optimal puts available for the position). Then the app uses an algorithm developed by a finance Ph.D. to sort through and analyze all of the available puts for your position, scanning for the optimal ones.
Hedging costs of the Dow and its components as of April 20th
The table below shows the costs, as of April 20, 2011, of hedging each Dow component, and the Dow-tracking ETF (DIA), against greater-than-20% declines over the next several months.
*Based on optimal puts expiring in September, 2011.
**Based on optimal puts expiring in October, 2011.
***Based on optimal puts expiring in November, 2011
Volatility and hedging costs on April 20 versus August 23
The VIX closed at $15.07 on April 20, prompting me to note in my article then that,
The highest hedging costs in the Dow on April 20
The cost of hegding BAC against a >20% drop over the next several months was 4.89%, the highest of any Dow component on April 20.
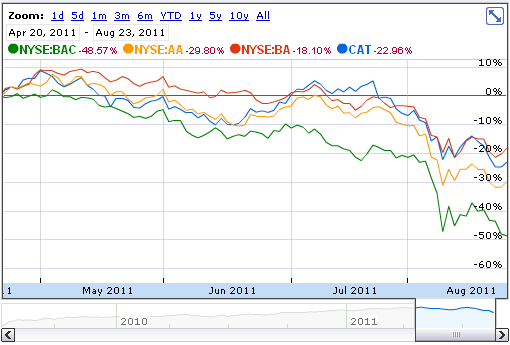
Four Dow stocks with the highest hedging costs on April 20.
Disregarding the differences in options expiration dates, BAC was one of four stocks in the table above for which the costs of hedging against >20% declines were greater than 3%. The others were Alcoa (AA), Boeing (BA), and Caterpillar (CAT). The Google finance chart below shows how they've performed since April 20.

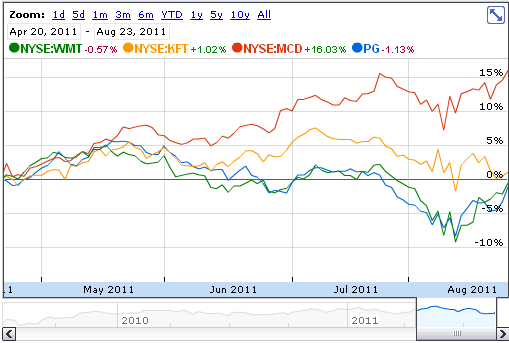
Four Dow stocks with the lowest hedging costs on April 20th
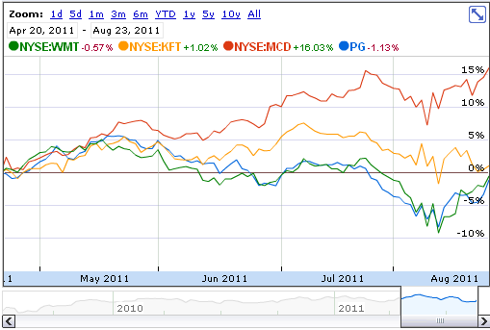
Disregarding the differences in options expiration dates, there were four stocks in the table above for which the costs of hedging against >20% declines was less than 1%: Walmart Stores Inc. (WMT), Kraft Foods Inc. (KFT), Procter & Gamble Company (PG), and McDonald's Corporation (MCD). The chart below shows how they've performed since April 20.
Are optimal hedging costs a tell?
It's an interesting hypothesis, but I would want to see a lot more data on it before using it as a basis for picking stocks. Fortunately, we may see that data soon. A quant on the Portfolio Armor team just started a postdoctoral fellowship at a particularly well-funded university where he'll have access to extensive historical options data. He's got another Portfolio Armor-related study lined up first (on the best times to hedge), but he may add this one to the queue. I'll post a follow up here after if he finds conclusive data, one way or another, about this.
Disclosure: I am long optimal puts on DIA as a hedge.
After a rare East Coast earthquake shook New York City Tuesday, this was one of a number of tweets I saw blaming the tremor on Bank of America (another suggested what we felt was BAC's implosion).

Bank of America is one of the top holdings of Bruce Berkowitz's Fairholme Fund, and when Berkowitz spoke at the American Association of Individual Investors in Manhattan earlier this summer, it was the stock he spent the most time talking about.
Meet the domestic stock fund manager of the decade
That's the title Morningstar gave Bruce Berkowitz (pictured above) earlier this year. As I mentioned above, Berkowitz spent most of his time talking about BAC in his AAII presentation in June. The steep drop in Bank of America shares since prompted me to look back at its relative hedging costs over time, as I've tracked them in posts about hedging the Dow.
High optimal hedging costs as a red flag?
Since late March, I've updated the hedging costs of each Dow component, and the SPDR Dow Jones Industrial Average ETF (DIA), using optimal puts, seven times. In five of those seven posts, starting with this one published on April 21, "Hedging the Dow, an Update", BAC had the highest hedging costs of any Dow component. Let's take a look at the table from that article published on April 21, but first, a quick reminder about optimal puts.
About optimal puts
Optimal puts are the ones that will give you the level of protection you want at the lowest possible cost. As University of Maine finance professor Dr. Robert Strong, CFA has noted, picking the most economical puts can be a complicated task. With Portfolio Armor (available on the web and as an Apple iOS app), you just enter the symbol of the stock or ETF you're looking to hedge, the number of shares you own, and the maximum decline you're willing to risk (your threshold — you can enter any percentage you like, but the larger the percentage, the greater the chance there will be optimal puts available for the position). Then the app uses an algorithm developed by a finance Ph.D. to sort through and analyze all of the available puts for your position, scanning for the optimal ones.
Hedging costs of the Dow and its components as of April 20th
The table below shows the costs, as of April 20, 2011, of hedging each Dow component, and the Dow-tracking ETF (DIA), against greater-than-20% declines over the next several months.
| Symbol | Name | Cost of Protection (as % of Position value) |
| (AA, Financial) | Alcoa Inc. Common Stock | 3.19%** |
| (AXP) | American Express | 2.13%** |
| (BA, Financial) | Boeing | 3.04%*** |
| (BAC, Financial) | Bank of America | 4.89%*** |
| (CAT, Financial) | Caterpillar | 4.39%*** |
| (CSCO) | Cisco Systems | 2.01%** |
| (CVX) | Chevron | 1.47%* |
| (DD) | E.I. du Pont de Nemours | 2.87%** |
| (DIS) | Walt Disney | 1.97%** |
| (GE) | General Electric | 1.91%* |
| (HD) | Home Depot | 2.53%*** |
| (HPQ) | Hewlett-Packard | 2.79%*** |
| (IBM) | International Business Machines | 1.20%** |
| (INTC) | Intel | 1.91%** |
| (JNJ) | Johnson & Johnson | 0.7%** |
| (JPM) | JP Morgan Chase | 1.57%* |
| (KFT, Financial) | Kraft Foods | 0.72%* |
| (KO) | Coca-Cola | 1.00%*** |
| (MCD, Financial) | McDonald's | 0.68%* |
| (MMM) | 3M | 1.95%** |
| (MRK) | Merck | 1.41%** |
| (MSFT) | Microsoft | 2.17%** |
| (PFE) | Pfizer | 1.47%* |
| (PG, Financial) | Procter & Gamble | 0.86%** |
| (T) | AT&T | 1.43%** |
| (TRV) | Travelers | 1.69%** |
| (UTX) | United Technologies | 2.15%*** |
| (VZ) | Verizon Communications | 1.53%** |
| (WMT, Financial) | Wal-Mart Stores | 0.75%* |
| (XOM) | Exxon Mobil | 1.39%** |
| (DIA) | SPDR Dow Jones Industrial Average ETF | 0.67%* |
**Based on optimal puts expiring in October, 2011.
***Based on optimal puts expiring in November, 2011
Volatility and hedging costs on April 20 versus August 23
The VIX closed at $15.07 on April 20, prompting me to note in my article then that,
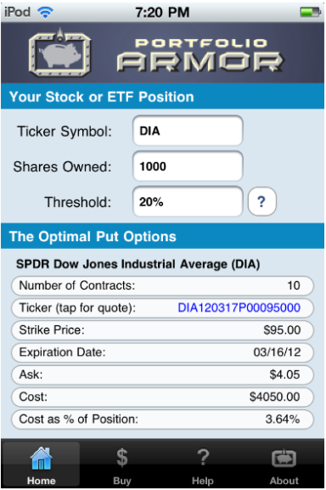
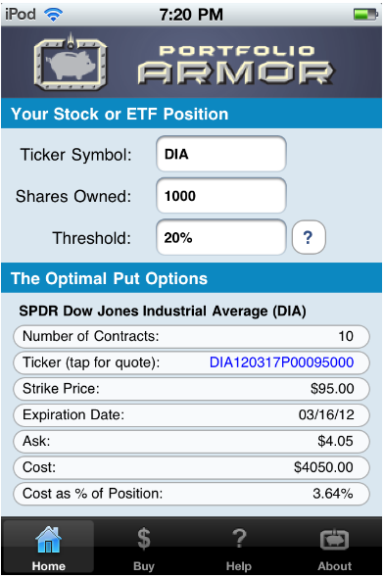
Volatility can spike quite quickly though, so if you are considering hedging, you may want to consider doing so while volatility remains relatively low.Note how low the costs of DIA against a >20% drop were back then — 0.67% of your position, using optimal puts expiring in September. Below is a screen shot showing the costs of hedging against a >20% drop in DIA between now and March, as of today, with the VIX at 36.27.
The highest hedging costs in the Dow on April 20
The cost of hegding BAC against a >20% drop over the next several months was 4.89%, the highest of any Dow component on April 20.
Four Dow stocks with the highest hedging costs on April 20.
Disregarding the differences in options expiration dates, BAC was one of four stocks in the table above for which the costs of hedging against >20% declines were greater than 3%. The others were Alcoa (AA), Boeing (BA), and Caterpillar (CAT). The Google finance chart below shows how they've performed since April 20.
Four Dow stocks with the lowest hedging costs on April 20th
Disregarding the differences in options expiration dates, there were four stocks in the table above for which the costs of hedging against >20% declines was less than 1%: Walmart Stores Inc. (WMT), Kraft Foods Inc. (KFT), Procter & Gamble Company (PG), and McDonald's Corporation (MCD). The chart below shows how they've performed since April 20.
Are optimal hedging costs a tell?
It's an interesting hypothesis, but I would want to see a lot more data on it before using it as a basis for picking stocks. Fortunately, we may see that data soon. A quant on the Portfolio Armor team just started a postdoctoral fellowship at a particularly well-funded university where he'll have access to extensive historical options data. He's got another Portfolio Armor-related study lined up first (on the best times to hedge), but he may add this one to the queue. I'll post a follow up here after if he finds conclusive data, one way or another, about this.
Disclosure: I am long optimal puts on DIA as a hedge.