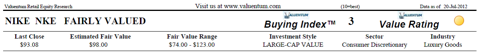
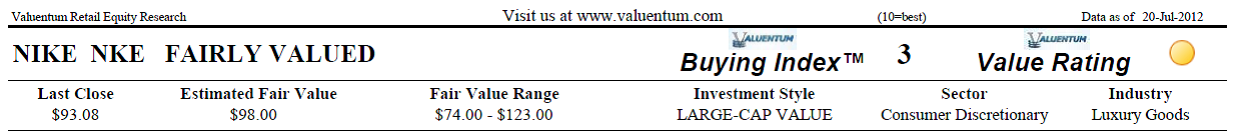
As part of our process, we perform a rigorous discounted cash-flow methodology that dives into the true intrinsic worth of companies. In Nike's (NKE, Financial) case, we think the firm is fairly valued at $98 per share, in line with where it is currently trading.
For some background, we think a comprehensive analysis of a firm's discounted cash-flow valuation and relative valuation versus industry peers is the best way to identify the most attractive stocks at the best time to buy. This process culminates in what we call our Valuentum Buying Index, which ranks stocks on a scale from 1 to 10, with 10 being the best.
In the spirit of transparency, we show how the performance of our VBI has stacked up per underlying score:
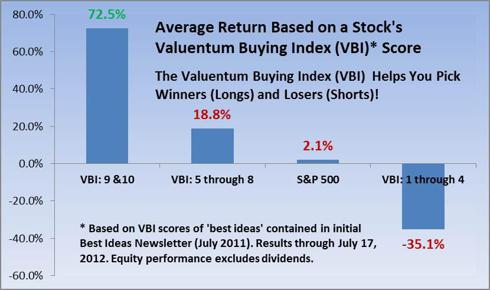
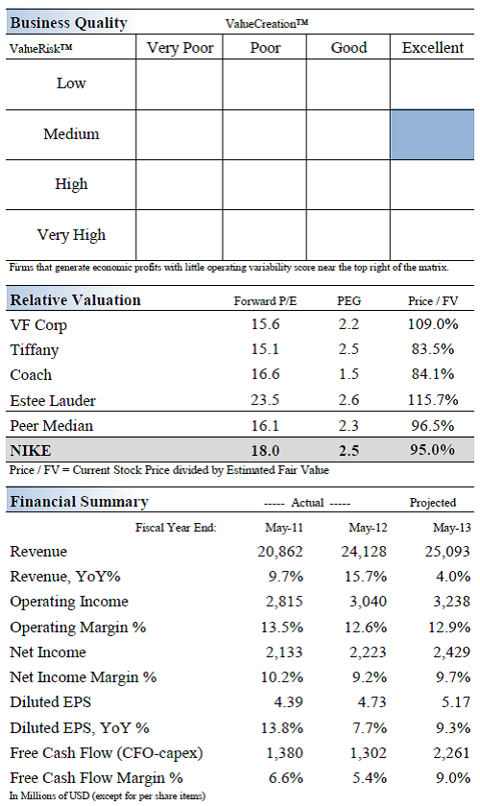
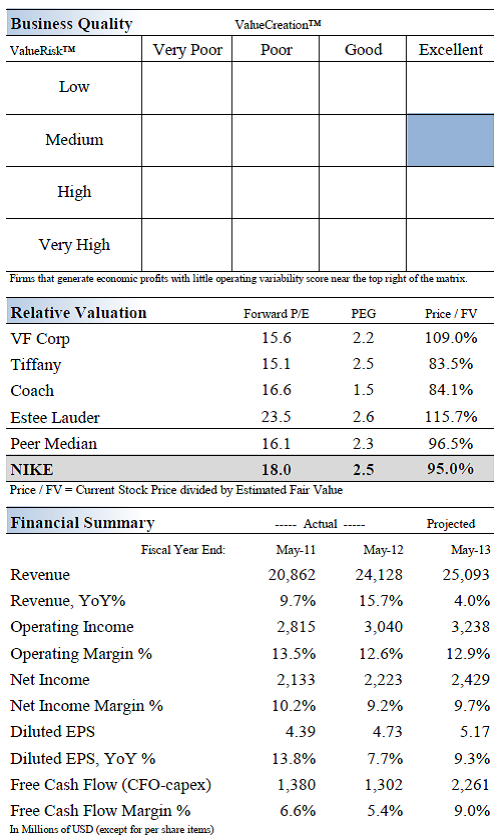
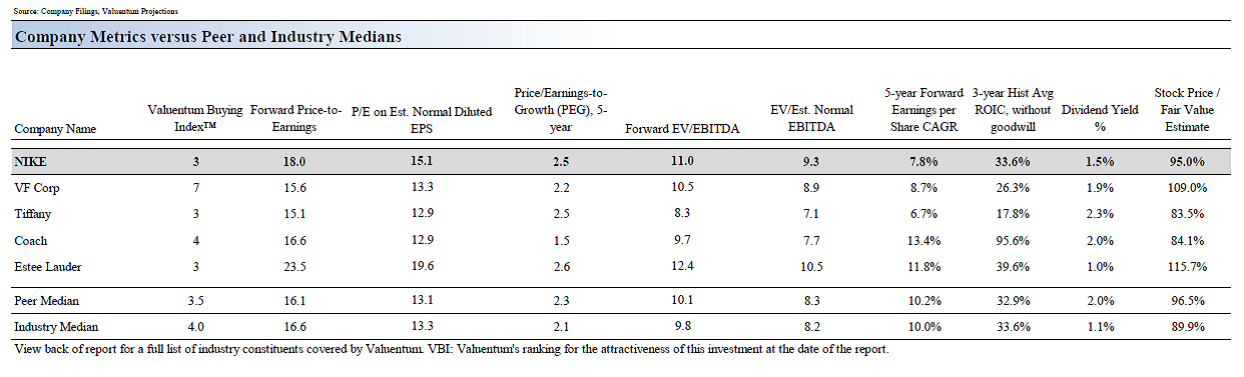
If a company is undervalued both on a DCF and on a relative valuation basis and is showing improvement in technical and momentum indicators, it scores high on our scale. Nike posts a VBI score of 3 on our scale, reflecting our "fairly valued" DCF assessment and its unattractive relative valuation versus peers. We use VF Corp (VFC, Financial), Tiffany (TIF, Financial), Coach (COH, Financial) and Estee Lauder (EL, Financial) for our peer group analysis.
Our Report on Nike
click to enlarge images
Investment Considerations
Investment Highlights
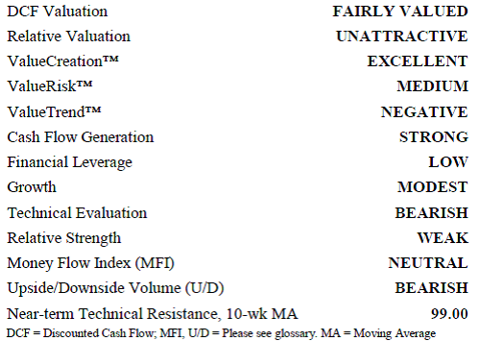
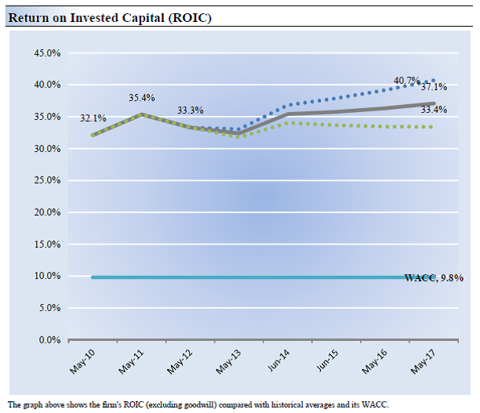
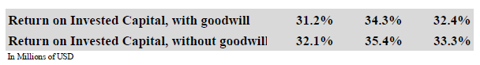
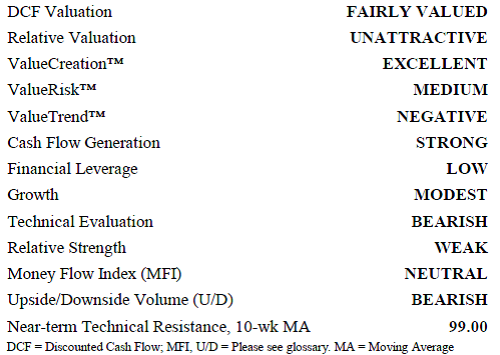
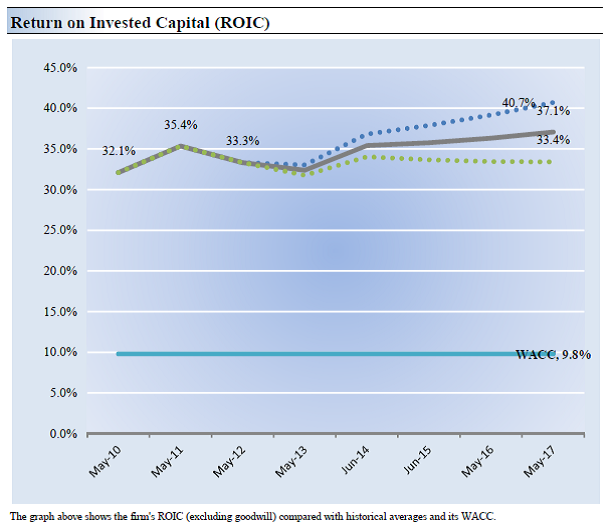
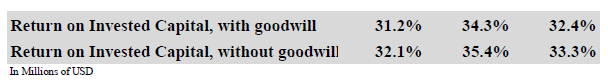
NIKE earns a ValueCreation™ rating of EXCELLENT, the highest possible mark on our scale. The firm has been generating economic value for shareholders for the past few years, a track record we view very positively. Return on invested capital (excluding goodwill) has averaged 33.6% during the past three years.
The company looks fairly valued at this time. We expect the firm to trade within our fair value estimate range for the time being. If the firm's share price fell below $74, we'd take a closer look at adding it to the market-beating portfolio of our Best Ideas Newsletter.
NIKE has an excellent combination of strong free cash flow generation and low financial leverage. We expect the firm's free cash flow margin to average about 9.7% in coming years. Total debt-to-EBITDA was 0.1 last year, while debt-to-book capitalization stood at 3.6%.
The firm's share price performance has trailed that of the market during the past quarter. However, it is trading within our fair value estimate range, so we don't view such activity as alarming.
The firm experienced an operating cash flow CAGR of about 3% during the past three years. We expect its operating cash flow growth to be better than its peer median during the next five years.
Economic Profit Analysis
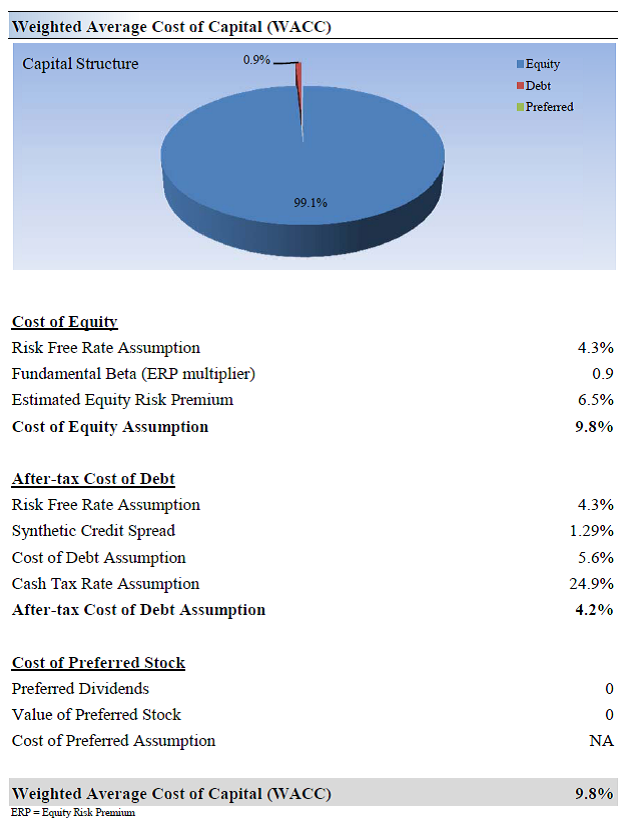
The best measure of a firm's ability to create value for shareholders is expressed by comparing its return on invested capital (ROIC) with its weighted average cost of capital (WACC). The gap or difference between ROIC and WACC is called the firm's economic profit spread. NIKE's 3-year historical return on invested capital (without goodwill) is 33.6%, which is above the estimate of its cost of capital of 9.8%. As such, we assign the firm a ValueCreation™ rating of EXCELLENT. In the chart below, we show the probable path of ROIC in the years ahead based on the estimated volatility of key drivers behind the measure. The solid grey line reflects the most likely outcome, in our opinion, and represents the scenario that results in our fair value estimate.

Cash Flow Analysis
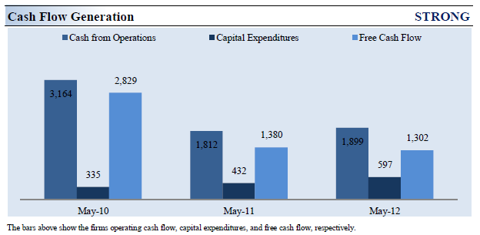
Firms that generate a free cash flow margin (free cash flow divided by total revenue) above 5% are usually considered cash cows. NIKE's free cash flow margin has averaged about 9% during the past three years. As such, we think the firm's cash flow generation is relatively STRONG. The free cash flow measure shown above is derived by taking cash flow from operations less capital expenditures and differs from enterprise free cash flow (FCFF), which we use in deriving our fair value estimate for the company. For more information on the differences between these two measures, please visit our website at Valuentum.com. At NIKE, cash flow from operations decreased about 40% from levels registered two years ago, while capital expenditures expanded about 78% over the same time period.
Valuation Analysis
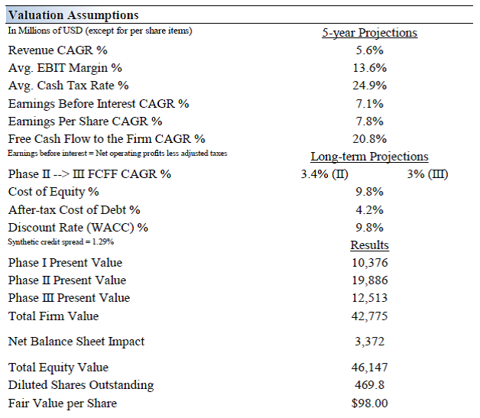
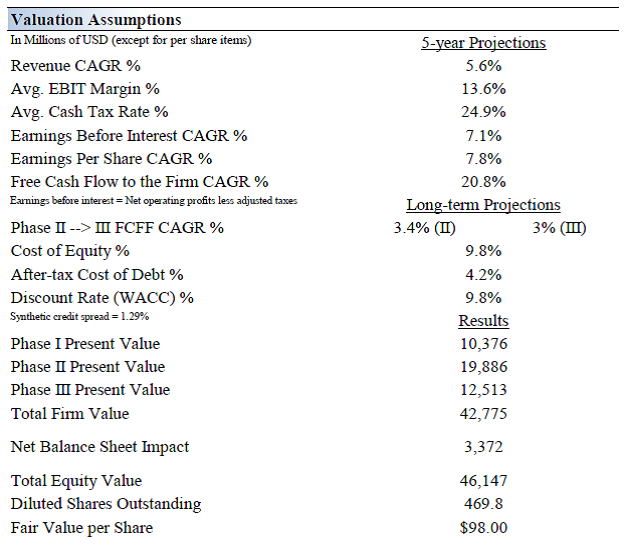
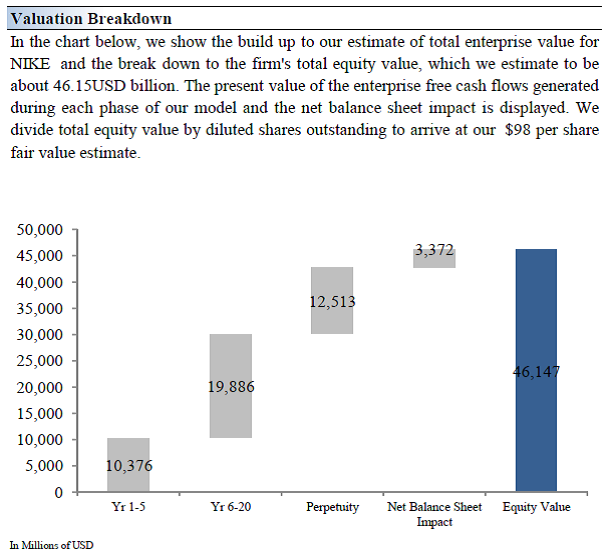
Our discounted cash flow model indicates that NIKE's shares are worth between $74.00 and $123.00 each. The margin of safety around our fair value estimate is driven by the firm's MEDIUM ValueRisk™ rating, which is derived from the historical volatility of key valuation drivers. The estimated fair value of $98 per share represents a price-to-earnings (P/E) ratio of about 20.7 times last year's earnings and an implied EV/EBITDA multiple of about 12.4 times last year's EBITDA. Our model reflects a compound annual revenue growth rate of 5.6% during the next five years, a pace that is lower than the firm's 3-year historical compound annual growth rate of 8%. Our model reflects a 5-year projected average operating margin of 13.6%, which is above NIKE's trailing three-year average. Beyond year five, we assume free cash flow will grow at an annual rate of 3.4% for the next 15 years and 3% in perpetuity. For NIKE, we use a 9.8% weighted average cost of capital to discount future free cash flows.


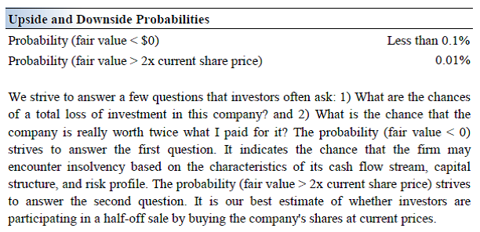
Margin of Safety Analysis
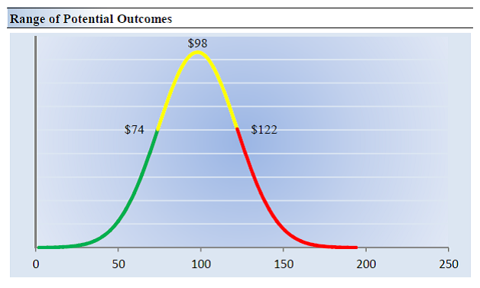
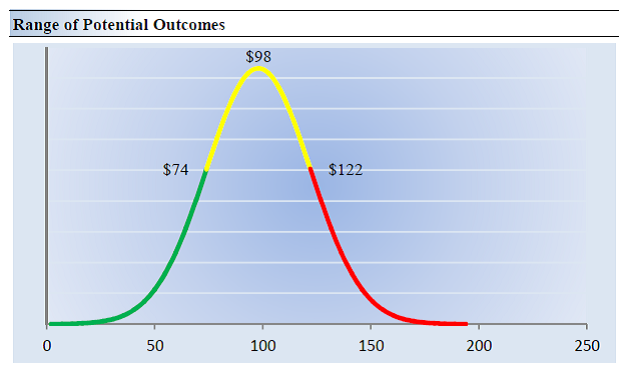
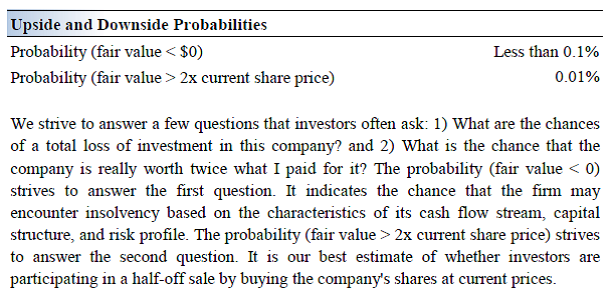
Our discounted cash flow process values each firm on the basis of the present value of all future free cash flows. Although we estimate the firm's fair value at about $98 per share, every company has a range of probable fair values that's created by the uncertainty of key valuation drivers (like future revenue or earnings, for example). After all, if the future was known with certainty, we wouldn't see much volatility in the markets as stocks would trade precisely at their known fair values. Our ValueRisk™ rating sets the margin of safety or the fair value range we assign to each stock. In the graph below, we show this probable range of fair values for NIKE. We think the firm is attractive below $74 per share (the green line), but quite expensive above $123 per share (the red line). The prices that fall along the yellow line, which includes our fair value estimate, represent a reasonable valuation for the firm, in our opinion.
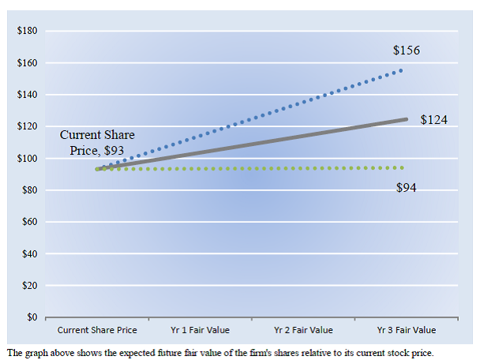
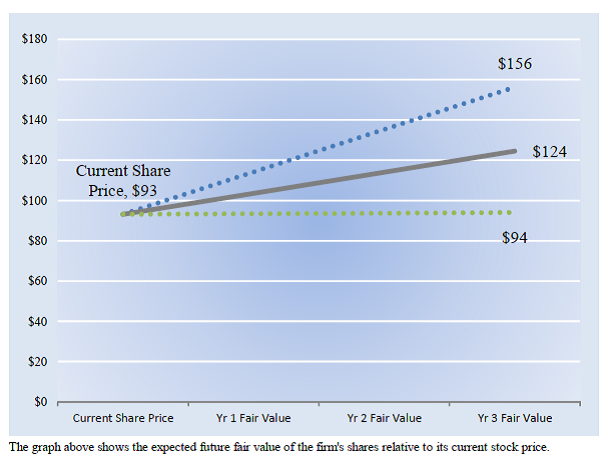
Future Path of Fair Value
We estimate NIKE's fair value at this point in time to be about $98 per share. As time passes, however, companies generate cash flow and pay out cash to shareholders in the form of dividends. The chart below compares the firm's current share price with the path of NIKE's expected equity value per share over the next three years, assuming our long-term projections prove accurate. The range between the resulting downside fair value and upside fair value in Year 3 represents our best estimate of the value of the firm's shares three years hence. This range of potential outcomes is also subject to change over time, should our views on the firm's future cash flow potential change. The expected fair value of $124 per share in Year 3 represents our existing fair value per share of $98 increased at an annual rate of the firm's cost of equity less its dividend yield. The upside and downside ranges are derived in the same way, but from the upper and lower bounds of our fair value estimate range.
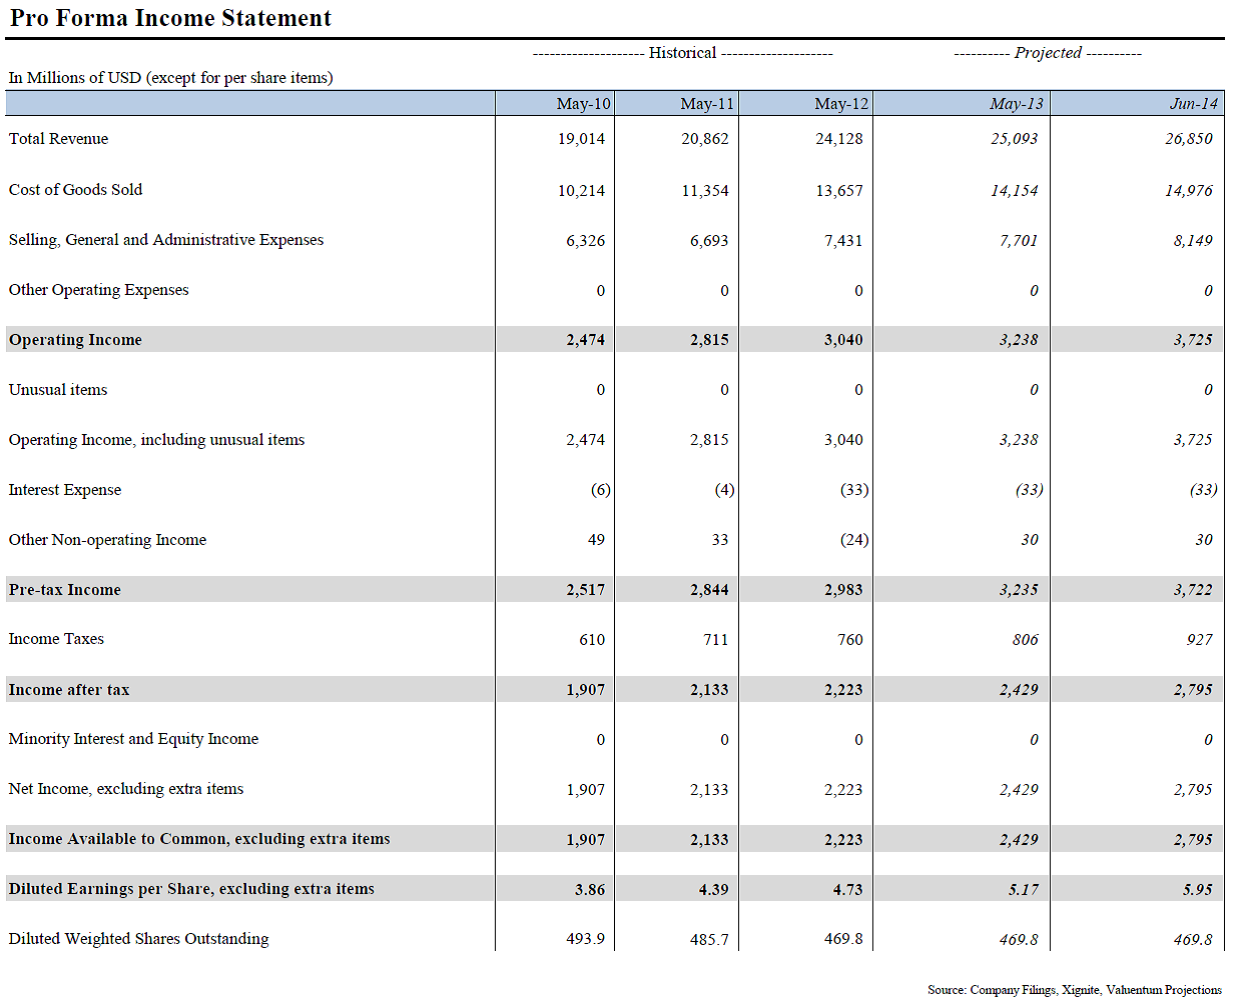
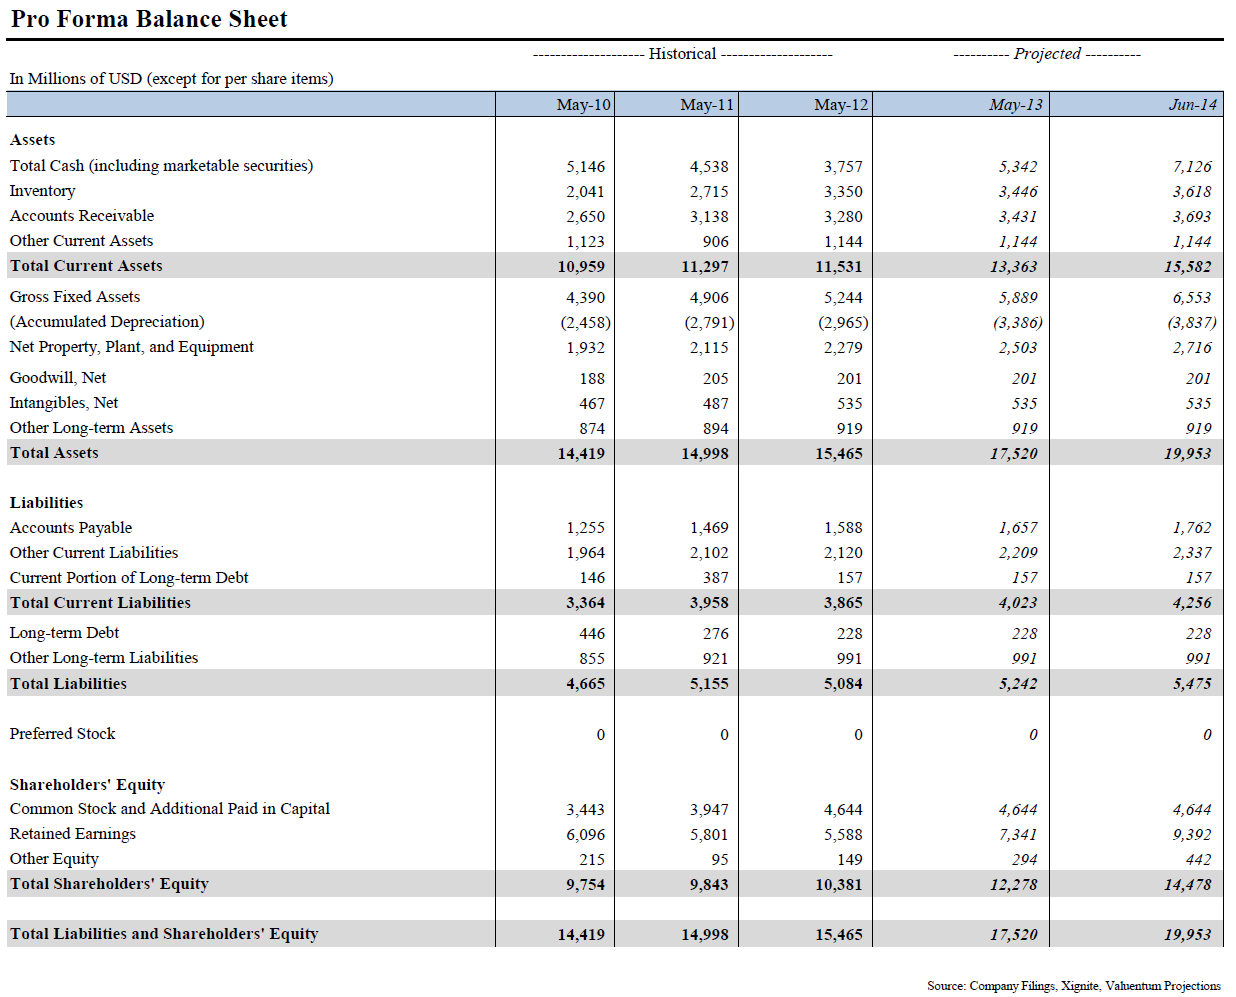
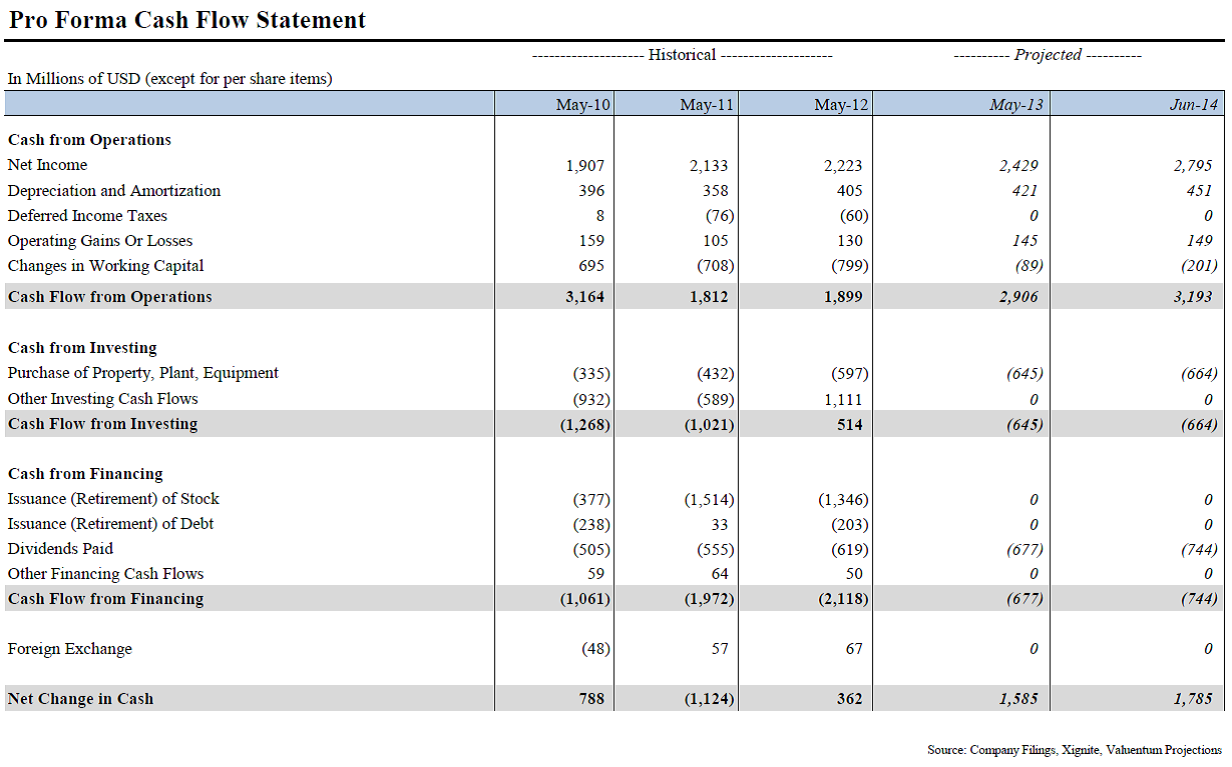
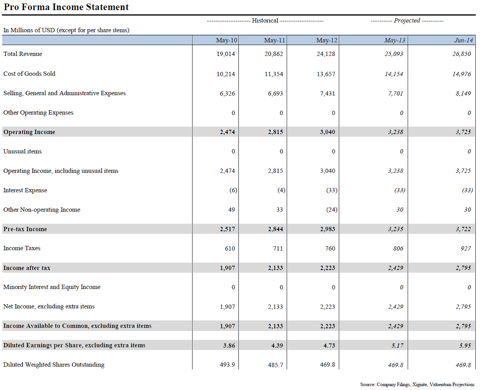
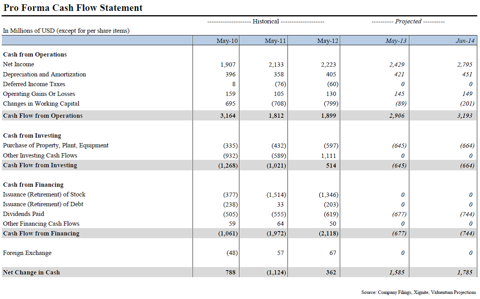
Pro Forma Financial Statements

For some background, we think a comprehensive analysis of a firm's discounted cash-flow valuation and relative valuation versus industry peers is the best way to identify the most attractive stocks at the best time to buy. This process culminates in what we call our Valuentum Buying Index, which ranks stocks on a scale from 1 to 10, with 10 being the best.
In the spirit of transparency, we show how the performance of our VBI has stacked up per underlying score:

If a company is undervalued both on a DCF and on a relative valuation basis and is showing improvement in technical and momentum indicators, it scores high on our scale. Nike posts a VBI score of 3 on our scale, reflecting our "fairly valued" DCF assessment and its unattractive relative valuation versus peers. We use VF Corp (VFC, Financial), Tiffany (TIF, Financial), Coach (COH, Financial) and Estee Lauder (EL, Financial) for our peer group analysis.
Our Report on Nike
click to enlarge images
Investment Considerations
Investment Highlights
NIKE earns a ValueCreation™ rating of EXCELLENT, the highest possible mark on our scale. The firm has been generating economic value for shareholders for the past few years, a track record we view very positively. Return on invested capital (excluding goodwill) has averaged 33.6% during the past three years.
The company looks fairly valued at this time. We expect the firm to trade within our fair value estimate range for the time being. If the firm's share price fell below $74, we'd take a closer look at adding it to the market-beating portfolio of our Best Ideas Newsletter.
NIKE has an excellent combination of strong free cash flow generation and low financial leverage. We expect the firm's free cash flow margin to average about 9.7% in coming years. Total debt-to-EBITDA was 0.1 last year, while debt-to-book capitalization stood at 3.6%.
The firm's share price performance has trailed that of the market during the past quarter. However, it is trading within our fair value estimate range, so we don't view such activity as alarming.
The firm experienced an operating cash flow CAGR of about 3% during the past three years. We expect its operating cash flow growth to be better than its peer median during the next five years.
Economic Profit Analysis
The best measure of a firm's ability to create value for shareholders is expressed by comparing its return on invested capital (ROIC) with its weighted average cost of capital (WACC). The gap or difference between ROIC and WACC is called the firm's economic profit spread. NIKE's 3-year historical return on invested capital (without goodwill) is 33.6%, which is above the estimate of its cost of capital of 9.8%. As such, we assign the firm a ValueCreation™ rating of EXCELLENT. In the chart below, we show the probable path of ROIC in the years ahead based on the estimated volatility of key drivers behind the measure. The solid grey line reflects the most likely outcome, in our opinion, and represents the scenario that results in our fair value estimate.
Cash Flow Analysis
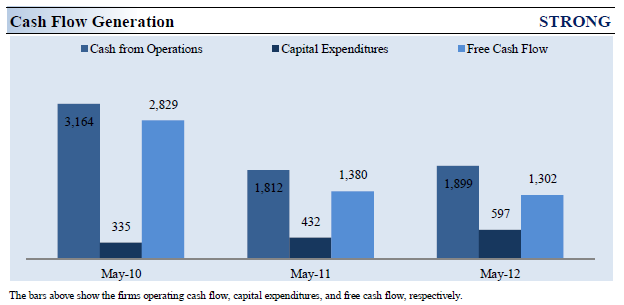
Firms that generate a free cash flow margin (free cash flow divided by total revenue) above 5% are usually considered cash cows. NIKE's free cash flow margin has averaged about 9% during the past three years. As such, we think the firm's cash flow generation is relatively STRONG. The free cash flow measure shown above is derived by taking cash flow from operations less capital expenditures and differs from enterprise free cash flow (FCFF), which we use in deriving our fair value estimate for the company. For more information on the differences between these two measures, please visit our website at Valuentum.com. At NIKE, cash flow from operations decreased about 40% from levels registered two years ago, while capital expenditures expanded about 78% over the same time period.
Valuation Analysis
Our discounted cash flow model indicates that NIKE's shares are worth between $74.00 and $123.00 each. The margin of safety around our fair value estimate is driven by the firm's MEDIUM ValueRisk™ rating, which is derived from the historical volatility of key valuation drivers. The estimated fair value of $98 per share represents a price-to-earnings (P/E) ratio of about 20.7 times last year's earnings and an implied EV/EBITDA multiple of about 12.4 times last year's EBITDA. Our model reflects a compound annual revenue growth rate of 5.6% during the next five years, a pace that is lower than the firm's 3-year historical compound annual growth rate of 8%. Our model reflects a 5-year projected average operating margin of 13.6%, which is above NIKE's trailing three-year average. Beyond year five, we assume free cash flow will grow at an annual rate of 3.4% for the next 15 years and 3% in perpetuity. For NIKE, we use a 9.8% weighted average cost of capital to discount future free cash flows.
Margin of Safety Analysis
Our discounted cash flow process values each firm on the basis of the present value of all future free cash flows. Although we estimate the firm's fair value at about $98 per share, every company has a range of probable fair values that's created by the uncertainty of key valuation drivers (like future revenue or earnings, for example). After all, if the future was known with certainty, we wouldn't see much volatility in the markets as stocks would trade precisely at their known fair values. Our ValueRisk™ rating sets the margin of safety or the fair value range we assign to each stock. In the graph below, we show this probable range of fair values for NIKE. We think the firm is attractive below $74 per share (the green line), but quite expensive above $123 per share (the red line). The prices that fall along the yellow line, which includes our fair value estimate, represent a reasonable valuation for the firm, in our opinion.
Future Path of Fair Value
We estimate NIKE's fair value at this point in time to be about $98 per share. As time passes, however, companies generate cash flow and pay out cash to shareholders in the form of dividends. The chart below compares the firm's current share price with the path of NIKE's expected equity value per share over the next three years, assuming our long-term projections prove accurate. The range between the resulting downside fair value and upside fair value in Year 3 represents our best estimate of the value of the firm's shares three years hence. This range of potential outcomes is also subject to change over time, should our views on the firm's future cash flow potential change. The expected fair value of $124 per share in Year 3 represents our existing fair value per share of $98 increased at an annual rate of the firm's cost of equity less its dividend yield. The upside and downside ranges are derived in the same way, but from the upper and lower bounds of our fair value estimate range.
Pro Forma Financial Statements