
DuPont Analysis Helps to Break Down ROE
I have written about return on equity (ROE) before, along with CROIC, which is mentioned regularly on this value investing blog.
But I want to focus more on ROE because it is a number that is regularly referenced and quoted. Even financial websites such as Yahoo Finance posts the ROE for every company.
However, what if ROE could be broken down into small pieces that further helps you to understand how the company is actually profiting?
This is where the DuPont Analysis comes in. By referencing ROE alone, a company with a ROE of 25% could look like a fantastic opportunity, but when you take a deeper look, it could tell a completely different story.
First, some background on ROE.
What Is ROE?
Return on equity is a financial ratio that shows you how well the management has created value for shareholders.
ROE is made up of two numbers: net income and shareholders equity.

A high ROE generally means that the rate of return on shareholders equity is going up and that the company is doing a good job of growing profits without adding new equity into the business.
A high and consistent ROE can signal that the company has a competitive advantage over its competitors.
The Downside of ROE
Here’s another interesting point. Unless a company does not raise additional cash, the company cannot grow earnings faster than the current ROE. (Keep this tip is mind when you enter growth rates into an intrinsic value spreadsheet.)
However, companies do raise additional cash and it comes in the form of debt or equity.
Debt causes an increase in interest payments which lowers net income.
Cash through selling more shares (equity dilution) lowers earnings per share since the number of shares outstanding has increased.
Both debt and equity dilution reduces shareholders equity which in turn causes ROE to become higher.
Introducing the DuPont Analysis
This is where the DuPont analysis comes in handy as it dissects the ROE to tell you how the company is achieving its ROE.
Why is it called the DuPont analysis? Simply because it was created by the DuPont corporation back in the 1920”²s.
There are two different versions of analyzing ROE using the DuPont model. Let’s go through each.
Three Step DuPont Analysis Model


Combine this together and with some simple algebra, you can see how the sales and total assets cancel each other out resulting in ROE.

Brilliant.
Now that ROE is broken down into three pieces, you can see the usefulness of this method.
If ROE has increased due to an increase in net margin or asset turnover, it is a very good sign. On the other hand, if it is the equity multiplier doing most of the work in ROE, that is sign to watch out for.
Three Step DuPont Analysis Example
The best way to use ROE is by comparing against competitors in the same industry.
Previously, I compared several shoe makers using the cash conversion cycle method. I will focus on Skechers (SKX, Financial) and Steve Madden (SHOO, Financial) this time.
Here is the link to download the DuPont Analysis spreadsheet.

First looking at SKX, you can see that ROE is erratic and has been falling in big steps.
Looking at it from the three points discussed, SKX is failing all three criteria. Net margin has decreased, asset turnover has decreased and equity multiplier has increased. This is the worst trend you could get.
Now compare that to SHOO.

SHOO is obviously the superior of the two companies. SHOO has been able to grow ROE from 2007, but the TTM shows a decline.
The main driver of that decline is a drop in net margins and an increase in the equity multiplier. Asset turnover has been fairly consistent since 2007/2008.
Still, SHOO does not display characteristics of the “perfect” stock but you can see how it is much better than SKX. With a company like SHOO, there are no big warning signs.
Advanced Five Step DuPont Analysis Model
With the three step model, you see whether a company is boosting ROE through improved profitability, asset turnover or financial leverage.
Like the Altman Z score and Beneish M score, an expanded version of the DuPont model was created to break down net profit margin even further. This advanced version lets you see how interest payments on debt affects net profit margin.
There are a lot of formulas below, which you can skip if you just want to get to the final formula, but the five-step DuPont Formula in an easy to understand form is given as:

which is equivalent to

The five step version requires more calculation, so use the DuPont analysis spreadsheet to make it easier.
Five Step DuPont Analysis Example
Getting straight into it, the five-step DuPont calculations are included below the three step version. Compare the two and you can see in even more detail the way ROE is made up.

For Skechers, from the three-step DuPont analysis, you see that it was net margin causing the drop in ROE. Looking closer via the five-step model, there was an increase in interest burden, but the main culprit is due to operating margin. From this, you can deduce that Skechers is going through some real business issues.

For Steve Madden, like the three-step version, the five-step DuPont model does not show any difference. All five steps are consistent with each other, signalling that SHOO is a much better managed company.
By analyzing ROE in this manner, you get a much clearer picture of whether management is truly being effective or not. Try it out yourself, but be sure to compare with competitors in the same industry.
I have written about return on equity (ROE) before, along with CROIC, which is mentioned regularly on this value investing blog.
But I want to focus more on ROE because it is a number that is regularly referenced and quoted. Even financial websites such as Yahoo Finance posts the ROE for every company.
However, what if ROE could be broken down into small pieces that further helps you to understand how the company is actually profiting?
This is where the DuPont Analysis comes in. By referencing ROE alone, a company with a ROE of 25% could look like a fantastic opportunity, but when you take a deeper look, it could tell a completely different story.
First, some background on ROE.
What Is ROE?
Return on equity is a financial ratio that shows you how well the management has created value for shareholders.
ROE is made up of two numbers: net income and shareholders equity.
A high ROE generally means that the rate of return on shareholders equity is going up and that the company is doing a good job of growing profits without adding new equity into the business.
A high and consistent ROE can signal that the company has a competitive advantage over its competitors.
The Downside of ROE
Here’s another interesting point. Unless a company does not raise additional cash, the company cannot grow earnings faster than the current ROE. (Keep this tip is mind when you enter growth rates into an intrinsic value spreadsheet.)
However, companies do raise additional cash and it comes in the form of debt or equity.
Debt causes an increase in interest payments which lowers net income.
Cash through selling more shares (equity dilution) lowers earnings per share since the number of shares outstanding has increased.
Both debt and equity dilution reduces shareholders equity which in turn causes ROE to become higher.
Introducing the DuPont Analysis
This is where the DuPont analysis comes in handy as it dissects the ROE to tell you how the company is achieving its ROE.
- Is the company increasing margins?
- Is the inventory turnover increasing?
- Is leverage being used?
Why is it called the DuPont analysis? Simply because it was created by the DuPont corporation back in the 1920”²s.
There are two different versions of analyzing ROE using the DuPont model. Let’s go through each.
Three Step DuPont Analysis Model
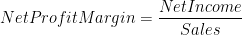
- Net profit margin shows operating efficiency
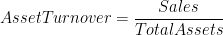
- Asset turnover shows asset utilization efficiency
- Equity multiplier shows financial leverage
Combine this together and with some simple algebra, you can see how the sales and total assets cancel each other out resulting in ROE.
Brilliant.
Now that ROE is broken down into three pieces, you can see the usefulness of this method.
If ROE has increased due to an increase in net margin or asset turnover, it is a very good sign. On the other hand, if it is the equity multiplier doing most of the work in ROE, that is sign to watch out for.
Three Step DuPont Analysis Example
The best way to use ROE is by comparing against competitors in the same industry.
Previously, I compared several shoe makers using the cash conversion cycle method. I will focus on Skechers (SKX, Financial) and Steve Madden (SHOO, Financial) this time.
Here is the link to download the DuPont Analysis spreadsheet.
First looking at SKX, you can see that ROE is erratic and has been falling in big steps.
Looking at it from the three points discussed, SKX is failing all three criteria. Net margin has decreased, asset turnover has decreased and equity multiplier has increased. This is the worst trend you could get.
Now compare that to SHOO.
SHOO is obviously the superior of the two companies. SHOO has been able to grow ROE from 2007, but the TTM shows a decline.
The main driver of that decline is a drop in net margins and an increase in the equity multiplier. Asset turnover has been fairly consistent since 2007/2008.
Still, SHOO does not display characteristics of the “perfect” stock but you can see how it is much better than SKX. With a company like SHOO, there are no big warning signs.
Advanced Five Step DuPont Analysis Model
With the three step model, you see whether a company is boosting ROE through improved profitability, asset turnover or financial leverage.
Like the Altman Z score and Beneish M score, an expanded version of the DuPont model was created to break down net profit margin even further. This advanced version lets you see how interest payments on debt affects net profit margin.
There are a lot of formulas below, which you can skip if you just want to get to the final formula, but the five-step DuPont Formula in an easy to understand form is given as:
which is equivalent to
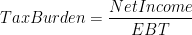
- Tax burden is the proportion of profits retained after paying taxes
- Interest burden shows how interest is affecting profits. If a company has no debt, the ratio will be 1.

- Operating income margin is the operating income per dollar of sales

- Asset turnover shows asset utilization efficiency
- Equity multiplier shows financial leverage
The five step version requires more calculation, so use the DuPont analysis spreadsheet to make it easier.
Five Step DuPont Analysis Example
Getting straight into it, the five-step DuPont calculations are included below the three step version. Compare the two and you can see in even more detail the way ROE is made up.
For Skechers, from the three-step DuPont analysis, you see that it was net margin causing the drop in ROE. Looking closer via the five-step model, there was an increase in interest burden, but the main culprit is due to operating margin. From this, you can deduce that Skechers is going through some real business issues.
For Steve Madden, like the three-step version, the five-step DuPont model does not show any difference. All five steps are consistent with each other, signalling that SHOO is a much better managed company.
By analyzing ROE in this manner, you get a much clearer picture of whether management is truly being effective or not. Try it out yourself, but be sure to compare with competitors in the same industry.