
1 The Company
Molycorp (MCP, Financial) produces and sells rare earths and rare metal materials in the United States and internationally.
| Number of shares | 244,712,409 |
| Share price | $2.12 |
| Market cap | $518.8 million |
| Enterprise value | $1.7 billion |
| P/S | 0.97 |
| P/B | 0.41 |
| Ticker | MCP |
1.1 History
Molybdenum Corporation of America began rare earths mining operations at the Molycorp Mountain Pass facility in 1952. On September 30, 2008, Molycorp acquired the Mountain Pass, California rare earths deposit and associated assets from Chevron Mining. Molycorp had its IPO in July 2010. On June 11, 2012, Molycorp completed the acquisition of Neo Material Technologies.

1.2 Business Model
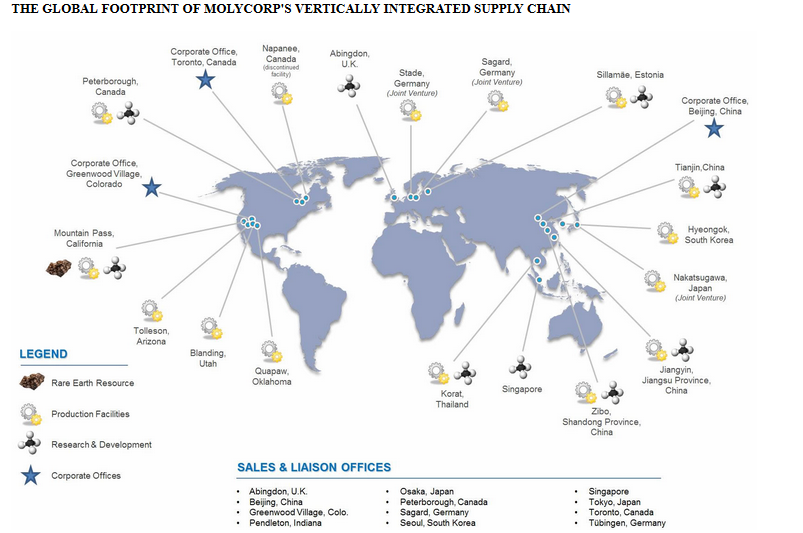
Molycorp is a global rare earths producer that operates a vertically integrated, global supply chain that combines a world-class rare earths resource with manufacturing facilities on three continents that can produce a wide variety of custom engineered, advanced rare earth materials from all of the lanthanide elements, plus yttrium.
(Source: Annual report)
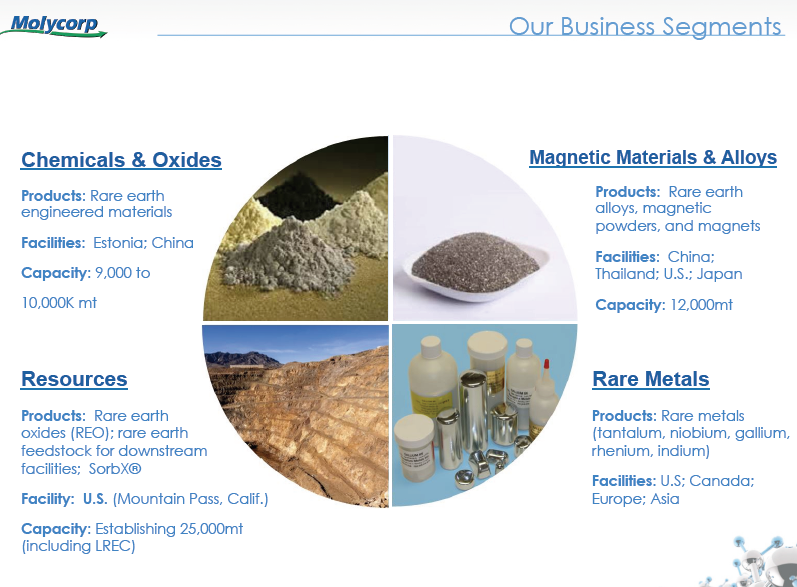
1.3 Business Segments
Molycorp has four reportable segments:
- Resources
- Chemicals and Oxides
- Magnetic Materials and Alloys
- Rare Metals
(Source: Investor presentation)
Molycorp’s vertically integrated manufacturing supply chain allows it to provide a variety of rare earth products for customers around the globe.

(Source: Annual report)
2 Management
The CEO Geoffrey Bedford has more than 10 years of industry experience. Geoffrey Bedford has been CEO since in December 2013. Collectively, Molycorp’s management team has over 100 years of industry experience.
2.1 Insider Ownership
Molycorp’s directors and executive officers own 2% of the company.
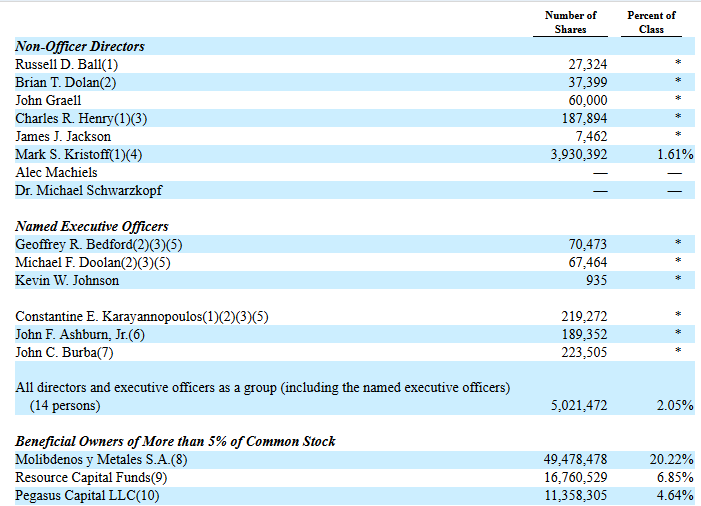
(Source: Proxy Statement)
Here is a table of Molycorp’s insider activity by calendar month.
| Insider buying / shares | Insider selling / shares | |
| July 2014 | 0 | 0 |
| June 2014 | 0 | 0 |
| May 2014 | 50,000 | 0 |
| April 2014 | 0 | 0 |
| March 2014 | 650,000 | 0 |
| February 2014 | 0 | 0 |
| January 2014 | 0 | 0 |
| December 2013 | 0 | 0 |
| November 2013 | 0 | 0 |
| October 2013 | 14,030,000 | 0 |
| September 2013 | 0 | 0 |
| August 2013 | 26,500 | 0 |
| July 2013 | 0 | 0 |
| June 2013 | 60,000 | 0 |
| May 2013 | 0 | 0 |
| April 2013 | 0 | 0 |
| March 2013 | 0 | 0 |
| February 2013 | 0 | 0 |
| January 2013 | 15,016,667 | 0 |
There have been 29,833,167 shares purchased and there have been zero shares sold by insiders since January 2013.
2.2 Compensation
Here is a table of the management’s compensation.

(Source: Proxy Statement)
The management’s total compensation has followed the share price.

3 Financial Summary
3.1 Current Situation
Molycorp reported the first-quarter financial results on May 7 with the following highlights:
| Revenue | $118.5 million |
| Net loss | $88.9 million |
| Cash | $236.1 million |
| Debt | $1.4 billion |
| Product sales volume | 3,518 mt |
The first quarter product sales volume increased 10% over the fourth quarter 2013.

(Source: Investor presentation)
3.2 Historical Developments
Here is a table of Molycorp’s revenue and earnings since 2009.
| Year | 2009 | 2010 | 2011 | 2012 | 2013 |
| Revenue ($ millions) | 7.1 | 35.2 | 396.8 | 527.7 | 554.4 |
| Net income/loss ($ millions) | -28.6 | -50.8 | +117.5 | -481.2 | -374.4 |
| EPS | -0.72 | -0.81 | +1.29 | -4.60 | -2.21 |
Molycorp was profitable only in 2011.
4 Shares
Here is a table of Molycorp’s number of shares since 2009.
| Year | 2009 | 2010 | 2011 | 2012 | 2013 |
| Number of shares (millions) | 39.5 | 62.3 | 83.5 | 107.1 | 174.5 |
Molycorp’s number of shares have grown 342% since 2009, but revenue has grown 7,708%.
5 Outlook
Molycorp expects that it will achieve significantly higher production volumes in the second half of this year.
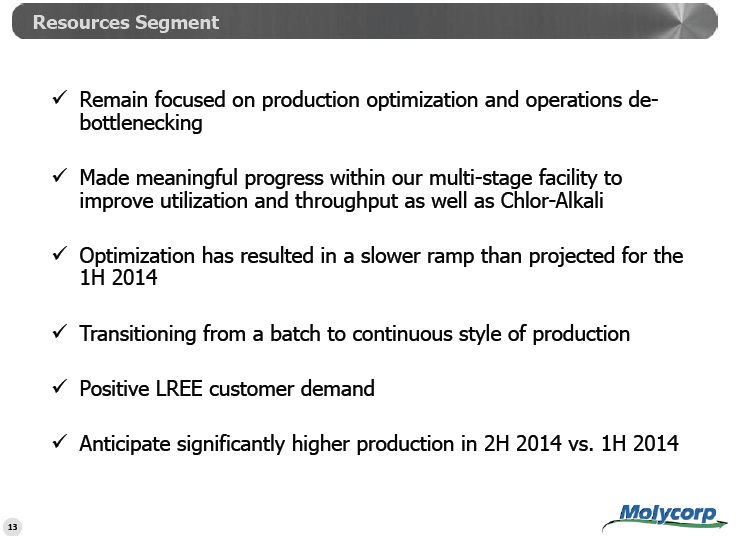
(Source: Earnings presentation)
IMCOA forecasts demand for rare earths to grow at a modest compound annual growth rate of 6-10% per annum for 2014-2017.
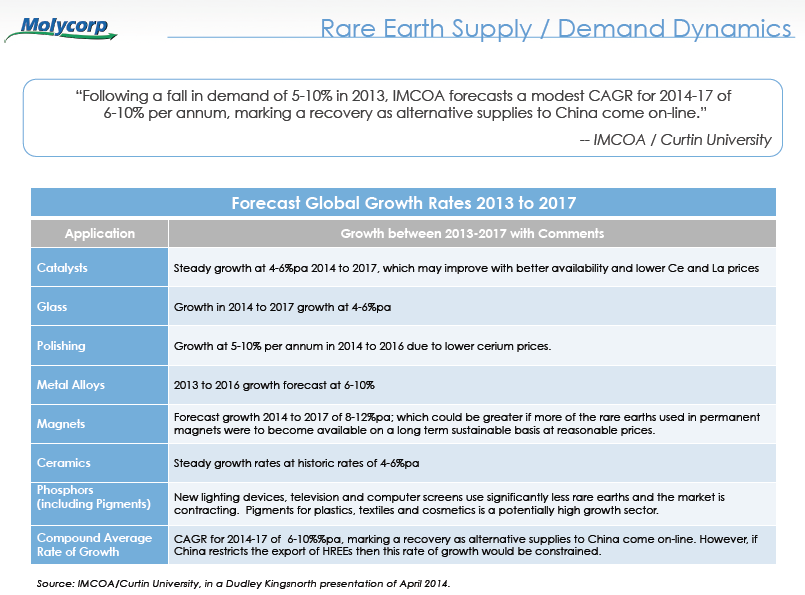
(Source: Investor presentation)
6 Risks
The two main risks are negative earnings and the price of rare earths. Molycorp has been profitable only in 2011, when the price of rare earths peaked.
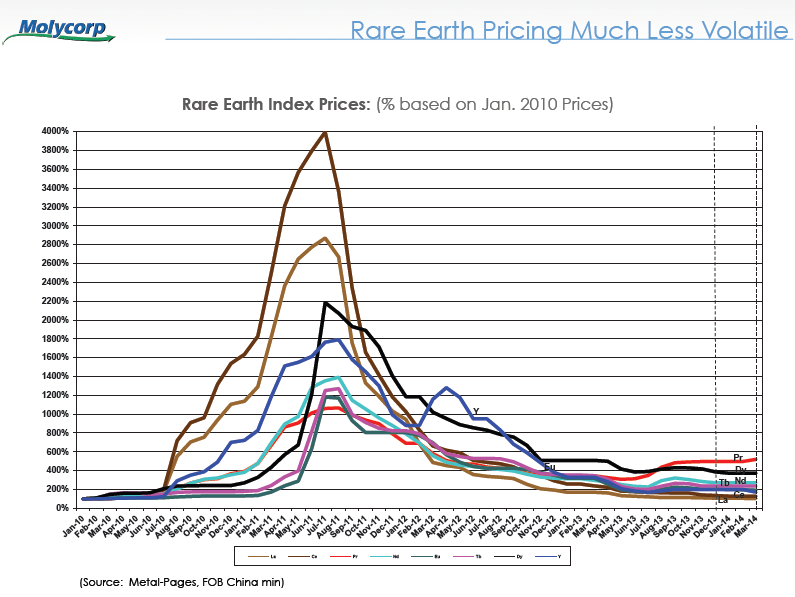
(Source: Investor presentation)
7 Conclusion
Molycorp is currently trading at a P/B ratio of 0.41. I believe the stock could have at least 100% upside potential during the next 12 months.
Disclosure: The author is long MCP