
1 The Company
Titan International (TWI, Financial) manufactures and sells wheels, tires and undercarriage systems and components for off-highway vehicles used in the agricultural, earthmoving/construction, and consumer markets in the United States and internationally.
| Shares outstanding (July 21, 2014) | 53,597,995 |
| Share price | $15.00 |
| Market cap | $804 million |
| Enterprise value | $1.2 billion |
| P/S | 0.4 |
| P/E | 44.8 |
| P/B | 1.2 |
| Dividend | $0.02 per year |
| Dividend Yield | 0.1% |
| Ticker | TWI |
1.1 History
- Titan traces its roots to the Electric Wheel Company in Quincy, Illinois, which was founded in 1890.
- The company was incorporated in 1983.
- Titan became a publicly traded company on NASDAQ in May of 1993.
- The company has grown through six major acquisitions in recent years.
1.2 Business Model
Titan’s goal is to become the worldwide leader in manufacturing and distribution of wheels, tires, assemblies and undercarriage products and to serve its customers’ needs through product innovation and quality service in its key markets:
- Agriculture
- Earthmoving/Construction
- Consumer

(Source: Investor presentation)
2 Management
The CEO Maurice Taylor has been in the wheel manufacturing business for over 30 years. Maurice Taylor has been CEO since 1990.
Dr. Mark Rachesky joined Titan's board of directors on June 1. Mark Rachesky is the founder and president of MHR Fund Management that manages approximately $6 billion of capital.
2.1 Insider Ownership
Titan’s directors and executive officers own 18.7% of the company.
Here is a table of Titan’s insider activity this year.
| Name | Title | Trade Date | Shares Purchased | Current Ownership | Increase InShares |
| Mark Rachesky | Director | Feb 25-July 28 | 1,660,000 | 7,519,000 shares | +28.3% |
| Paul Reitz | President | July 29 | 15,000 | 15,000 shares | from 0 to 15,000 |
| Anthony Soave | Director | May 1 | 28,000 | 909,875 shares | +3.2% |
There have been 1,703,000 shares purchased by insiders this year.
Here is a table of Titan’s insider activity by calendar month.
| Â | Insider buying / shares | Insider selling / shares |
| July 2014 | 505,775 | 0 |
| June 2014 | 0 | 0 |
| May 2014 | 28,000 | 0 |
| April 2014 | 842,125 | 0 |
| March 2014 | 0 | 0 |
| February 2014 | 327,100 | 0 |
| January 2014 | 0 | 0 |
| December 2013 | 0 | 0 |
| November 2013 | 0 | 6,250 |
| October 2013 | 0 | 0 |
| September 2013 | 0 | 0 |
| August 2013 | 0 | 0 |
| July 2013 | 0 | 0 |
| June 2013 | 0 | 0 |
| May 2013 | 0 | 0 |
| April 2013 | 0 | 0 |
| March 2013 | 0 | 0 |
| February 2013 | 0 | 0 |
| January 2013 | 0 | 0 |
There have been 1,703,000 shares purchased and there have been 6,250 shares sold by insiders since January 2013.
2.2 Compensation
Here is a table of the management’s compensation during the last three years.
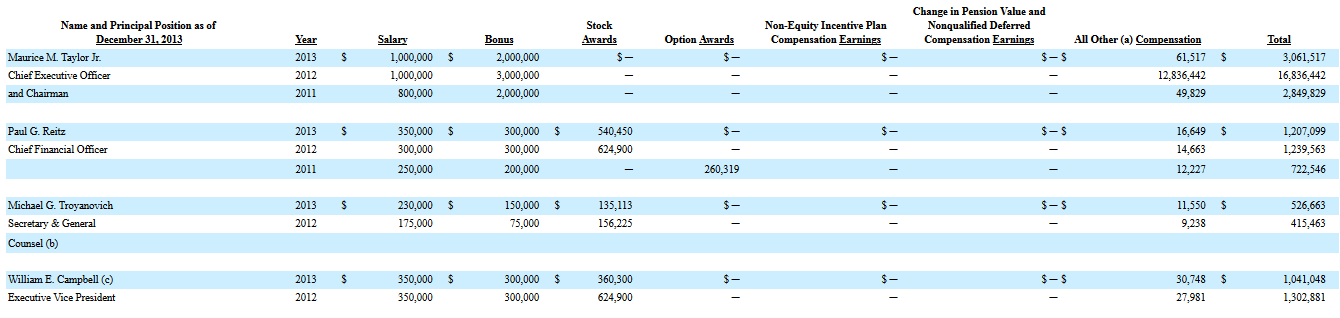
(Source: Proxy Statement)
The management’s total compensation was highest in 2012.
3 Operating Summary
Titan has three operating segments. Titan's agricultural segment includes rims, wheels, tires and undercarriage systems and components manufactured for use on various agricultural and forestry equipment. Titan’s earthmoving/construction segment includes wheels, tires and undercarriage systems and components supplied to the mining industry. Titan’s consumer segment includes bias truck tires in Latin America, products for all-terrain vehicles (ATVs) and recreational/utility trailers. Here is a table of segment sales.
| Year | Agricultural Sales ($ billions) | Earthmoving /Construction Sales ($ billions) | Consumer Sales ($ billions) |
| 2004 | 0.3 | 0.2 | 0.03 |
| 2005 | 0.3 | 0.1 | 0.03 |
| 2006 | 0.4 | 0.2 | 0.08 |
| 2007 | 0.5 | 0.3 | 0.04 |
| 2008 | 0.7 | 0.3 | 0.03 |
| 2009 | 0.6 | 0.1 | 0.02 |
| 2010 | 0.7 | 0.2 | 0.02 |
| 2011 | 1.0 | 0.3 | 0.2 |
| 2012 | 1.1 | 0.5 | 0.2 |
| 2013 | 1.2 | 0.7 | 0.2 |
The agricultural segment has been the largest segment every year.
4 Financial Summary
4.1 Current Situation
Titan reported the second-quarter financial results on July 24 with the following highlights:
| Revenue | $523.7 million |
| Net loss | $20.5 million |
| Cash | $163.0 million |
| Debt | $528.0 million |
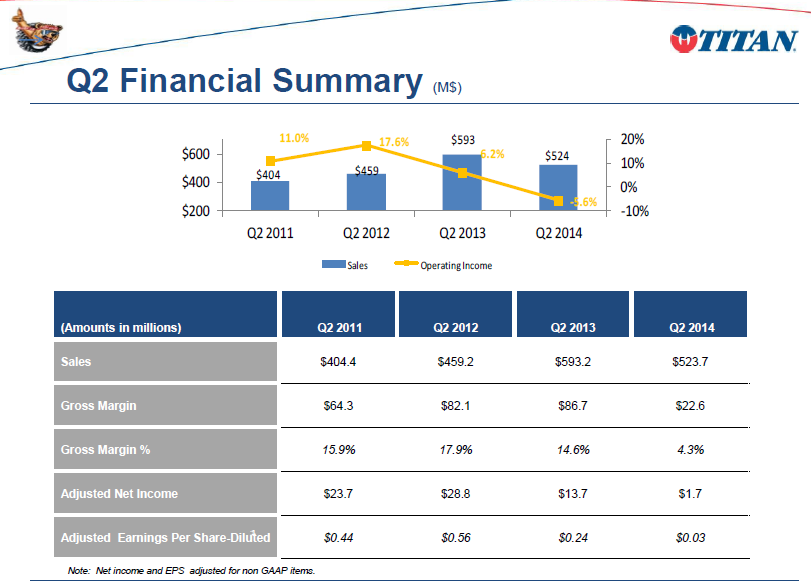
(Source: Investor presentation)
Net sales for the second quarter were $523.7 million compared to $593.2 million in 2013, a decrease of 11.7%. All three segments saw declining sales in the second quarter.

(Source: Investor presentation)
4.2 Historical Developments
Here is a table of Titan’s revenue and earnings since 2004.
| Year | 2004 | 2005 | 2006 | 2007 | 2008 | 2009 | 2010 | 2011 | 2012 | 2013 |
| Revenue ($ billions) | 0.5 | 0.5 | 0.7 | 0.8 | 1.0 | 0.7 | 0.9 | 1.5 | 1.8 | 2.2 |
| Net income / loss ($ millions) | +11.1 | +11.0 | +5.1 | -7.2 | +13.3 | -24.6 | -5.9 | +58.2 | +94.0 | +29.7 |
| EPS (diluted) | +0.61 | +0.60 | +0.21 | -0.23 | +0.38 | -0.71 | -0.17 | +1.18 | +2.05 | +0.64 |
The revenue has grown 340% since 2004.
5 Shares
Here is a table of Titan’s number of shares since 2004.
| Year | 2004 | 2005 | 2006 | 2007 | 2008 | 2009 | 2010 | 2011 | 2012 | 2013 |
| Number of shares (basic) (millions) | 17.8 | 18.1 | 19.7 | 32.1 | 34.4 | 34.7 | 34.9 | 41.7 | 43.4 | 53.0 |
| Number of shares (diluted) (millions) | 21.6 | 18.3 | 20.0 | 32.1 | 34.8 | 34.7 | 34.9 | 53.1 | 54.7 | 59.5 |
Titan’s number of shares (diluted) have grown 175% since 2004, but revenue has grown 340%.

(Source: GuruFocus)
6 Outlook
6.1 Agricultural Market Outlook
Large equipment sales have deteriorated significantly after a robust cycle in recent years. The mix shift to lower horsepower tractors has a negative impact on revenue and margin performance.
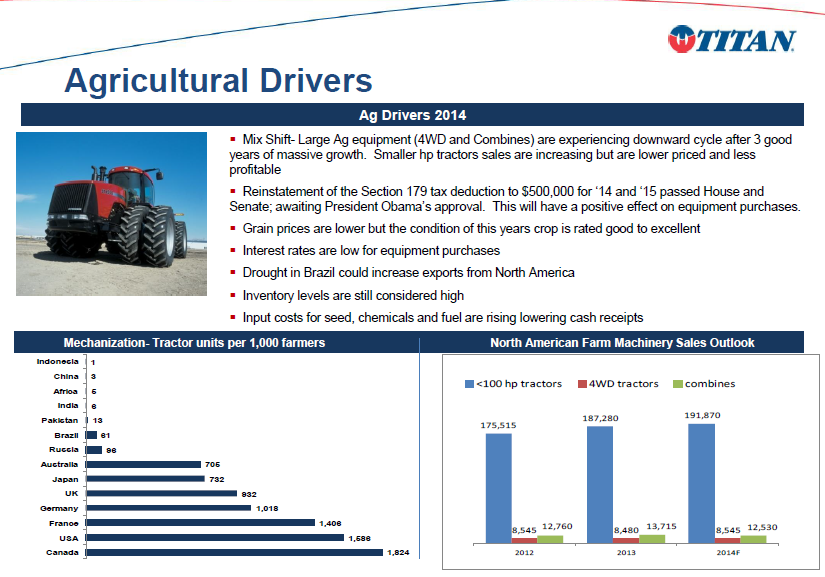
(Source: Investor presentation)
6.2 Earthmoving/Construction Market Outlook
Earthmoving/construction market sales were significantly lower in the first half of 2014 when compared to the first half of 2013 due to weak demand in the mining industry. This reduced demand is expected to continue for the remainder of 2014 as the mining industry continues in a downturn. Demand for small construction equipment used in the housing and commercial construction sectors is showing signs of recovery.
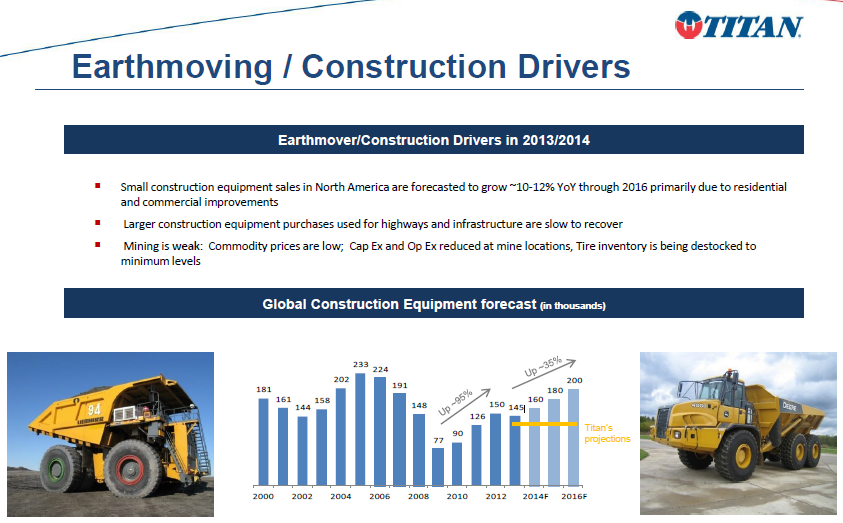
(Source: Investor presentation)
7 Competition
Titan’s competitors include Michelin, Bridgestone, and GKN Wheels. Only Titan can provide both tires and wheels.
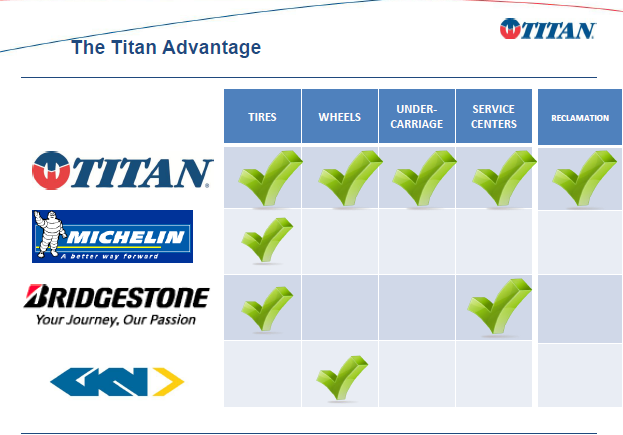
(Source: Investor presentation)
8 Valuation
According to the GuruFocus Fair Value/DCF calculator, Titan's fair value is $20.77.

(Source: GuruFocus)
9 Risks
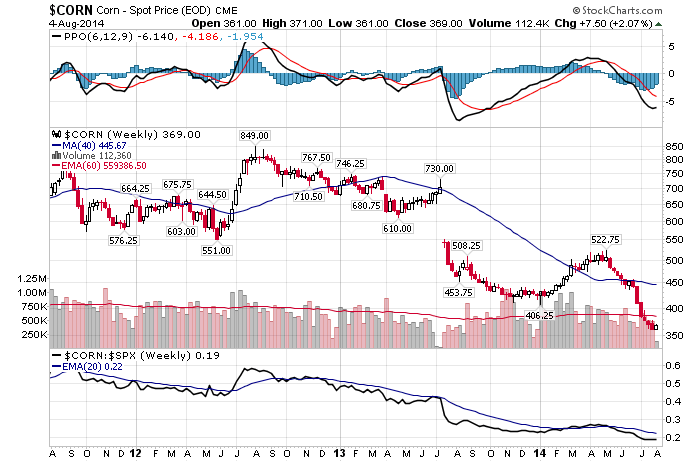
9.1 Agricultural Segment Risks
Agricultural segment risks include weather, grain prices, export markets and future government policies and payments. The corn prices are currently very weak.
9.2 Earthmoving/Construction Segment Risks
The earthmoving/construction segment risks include commodity prices, road construction, infrastructure, government appropriations, housing starts and the on-going banking and credit issues. The price of gold made its low 12 months ago.

10 Conclusion
There have been three different insiders buying Titan and there have not been any insiders selling Titan this year. The three insiders purchased their shares at prices ranging from $14.32 to $17.62. I believe Titan could be a good pick below $17.62 based on the intensive insider buying.

Disclosure: The author has no positions in any stocks mentioned.