

The Peter Lynch Below-Earnings-Line Screen allows users to find the stocks that have historically had strong correlations between stock prices and earnings line, and are currently traded below the earnings line.
In his excellent book One Up on Wall Street, Peter Lynch, the best mutual fund manager ever, revealed a powerful charting tool that helped him to achieve a gain of 29.2% in his portfolios for 13 years. In this chart, Peter Lynch drew the stock price and the earnings per share together and aligned the value of $1 in earnings per share to $15 in stock price. He wrote in pages 164-165 of the book:
"A quick way to tell if a stock is overpriced is to compare the price line to the earnings line. If you bought familiar growth companies when the stock price fell well below the earnings line, and sold the m when the stock price rose dramatically above it, the chances are you'd do pretty well."
The earnings lines here are the stock prices at 15 times of earnings. You can construct those easily with our Interactive Chart.
Based on this Peter Lynch strategy, we have created a Peter Lynch screen where you can find stocks that historically had strong correlations between the price line and earnings line, and currently traded at below the earnings line. The Peter Lynch Screen is here. According to Peter Lynch, you will probably "do pretty well" with these stocks.
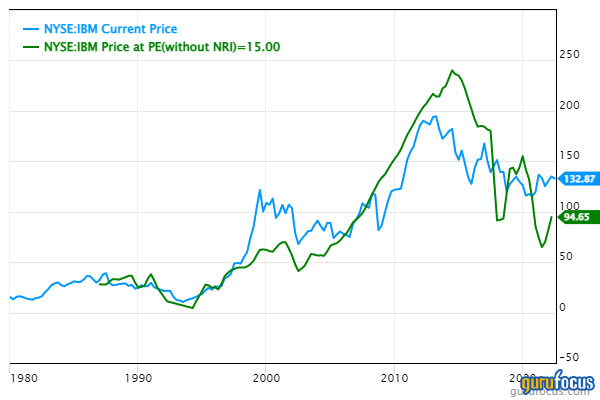
One example we found from the stock is International Business Machines Corp. (IBM, Financial). As you can see below, the stock prices had historically strong correlation with the earnings line. The stock traded below the earnings line between 2009 and 2018 and between 2019 and 2021.
The screener also allows you to filter with predictability of the business, market cap, industries etc. If you are a Global Membership subscriber, you can apply it to global markets such as Asian, European, Canadian, etc.
With similar philosophy, we have also created screens to find stocks that have historically shown strong correlations between stock prices and book values, sales, EBITDA etc and are traded below their historical median book value multiples, median sales multiples and median EBITDA multiples. The “Charts View” and “Customized View” of the screens allow you to research these stocks quickly with a few clicks.
Premium Subscribers can take a look at the Peter Lynch Screen here. If you are not a GuruFocus Premium Member, we invite you for a 7-day Free Trial.