
Over the last week, we have seen declines in the major stock benchmarks as investors continue to assess the prospects in equities for further rallies. There are some important questions that need to be asked in this regard, given the fact that we are still within striking distance of the all-time highs in many of the global benchmarks. Recent bearish activity has been propelled by weaker than expected numbers in the U.S. labor market, as any potential drag in this area could limit consumer spending and produce declines in corporate earnings in the coming financial quarter.
Going forward, investors will need to grapple with these questions in order to determine the validity of any rallies that are seen in the next few months: “Employment data for the month of March showed an increase of 126,000 new jobs,” said Jenifer Osterwalder, President/CEO of Spectral Capital. “This was the slowest rate of expansion in more than a year, so it was not entirely surprising to see that the initial market reaction was to sell equities.” So the main question is whether or not these trends will show sustainability in impacting the broader trends in stocks.
To get a sense of where we are currently, we will look at recent chart activity in the SPDR S&P 500 Trust ETF (NYSE: SPY), which is the most commonly traded ETF tracking the index. We will then compare this chart activity to its counterpart in emerging Asia, the iShares MSCI Emerging Markets Asia ETF (EEM, Financial). This comparison will give traders a better sense of where the trends are heading in both domestic and foreign markets so that trading opportunities can be captured once important price levels are reached.
_____________________________________
SPDR S&P 500 Trust ETF (NYSE: SPY)
Critical Resistance:Â 212
Critical Support: 198
Trading Bias: Bullish on Dips
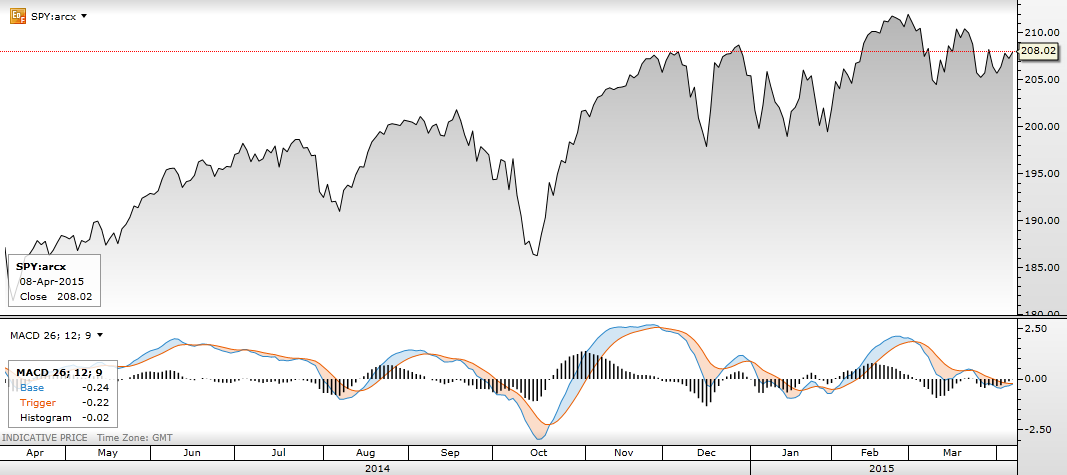
(Chart Source: CornerTrader)
S&P 500 / SPY - Stock Trading Strategy: Bullish trends prevail, but momentum is stalling, and this gives cause for concern in long positions. Look for prices to trade back toward support at 198 before buying back into the trend. First resistance now seen at 212.
By nearly all measure of analysis, the bull rally in the SPY continues. But we are starting to see prices stall ahead of critical resistance at 212, and this might make it difficult for newer traders to start entering into these markets while we are still trading at elevated levels. Prices are now facing the 100-day moving average as a primary technical mark to overcome, but traders will need to wait for retracements back into key historical supports before entering long once again in the SPY. Daily RSI is now heading into neutral territory, so this is another sign that traders should be waiting for a pullback into support before buying SPY or other assets tied to the S&P 500.
_______________________________________
iShares MSCI Emerging Markets Asia ETF (EEM, Financial)
Critical Resistance:Â 45.85
Critical Support: 38.20
Trading Bias: Prepare for Bullish Breakout
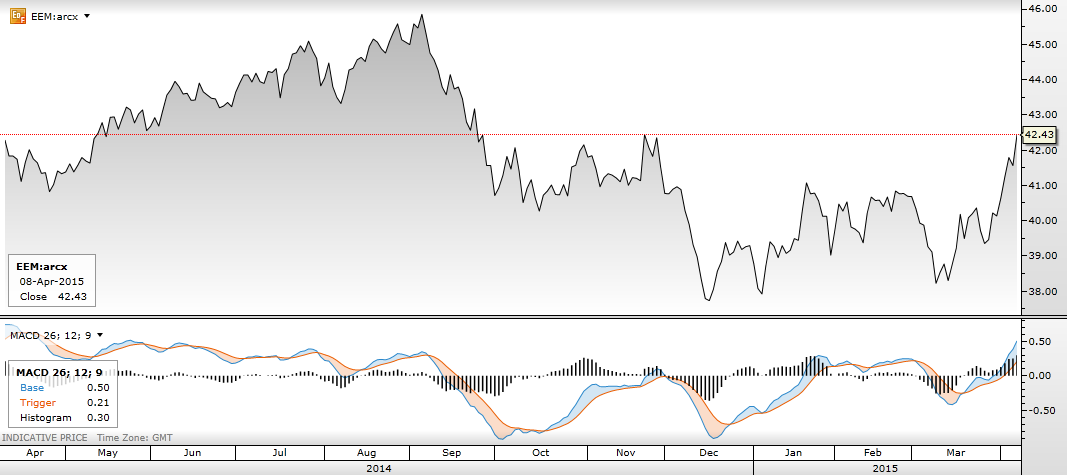
(Chart Source: CornerTrader)
EEM Stock Trading Strategy: Momentum in EEM has been less positive, but there are growing signs that an upside break is imminent. Look for a test of resistance at 45.85 if we see a clear break above 42.50.
Broader momentum in the EEM ETF has been less positive when compared to its North american counterpart, but there are building reasons to believe that a bullish breakout is on the wake. Specifically, markets are now coming into shorter-term resistance in the 42.50 zone, and if we see a clear break here the bullish target next becomes a test of longer term resistance at 45.85. Daily MACD readings have moved into positive territory, so there is clear scope for a nice run higher as long as we do not see any significant rejections at current levels. This bias reverses on a break of support at 38.20, as this would suggest that the medium term downtrend has not finished.
On the whole, there are still some relatively bullish signals in both of these global benchmarks – although there are different strategies that are likely to see success when trading both individually. Fundamental data will continue to be important in terms of the ways it informs expectations for interest rate policy at the U.S. Federal Reserve, and traders will remain mindful of this when the next jobs release is made public.
Â