
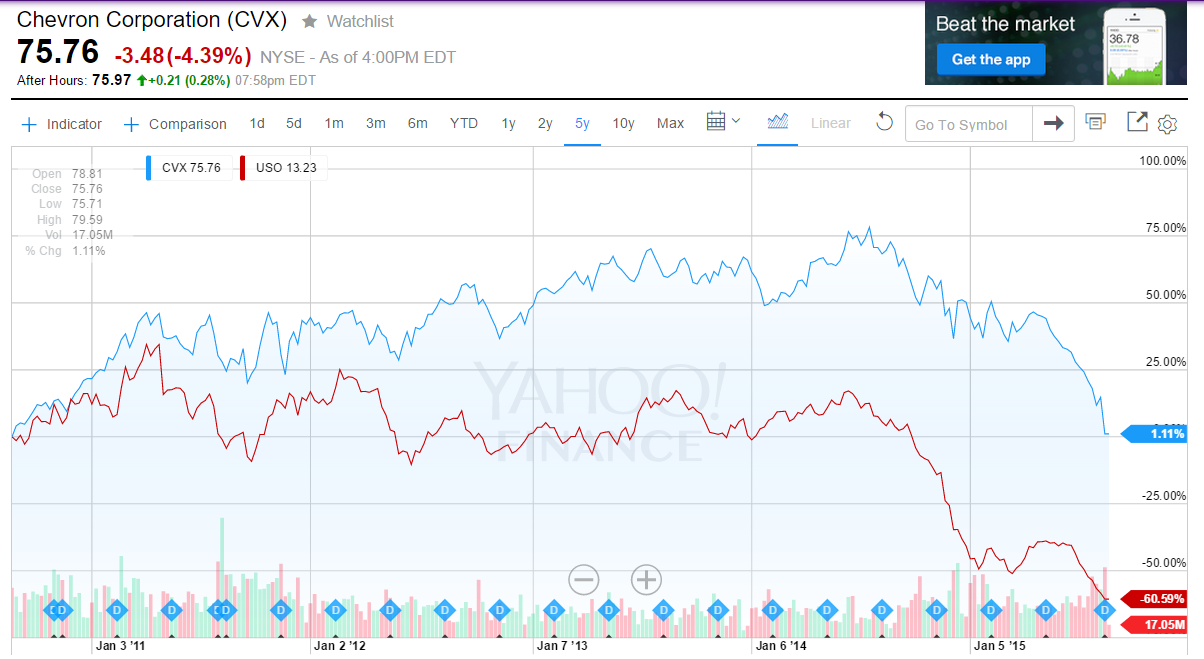
I’ve been bearish on Chevron (CVX, Financial) and Exxon (XOM) since I researched the oil industry. Long story short, my research led me to conclude that oil is NOT in short supply and there’s a strong argument for why WTI oil prices could stay below $70/barrel until 2020 and beyond. Chevron (CVX) has fallen over 32% YTD and it made me curious if the current price of ~$75/share is a good entry point. CVX’s attractiveness as an investment is completely dependent on the price of oil. The graph shows the correlation between the ETF, USO which reflects WTI prices, and CVX’s share price.
From the table below, we can see why oil prices drive Chevron’s stock. The Upstream segment, involving exploration and production (E&P), consistently accounts for ~90% of CVX’s net income. Earnings are directly generated from the price of oil and natural gas minus the costs of getting it out of the ground. In Q2 2015, the Upstream segment lost money but much of that had to do with ~$2B in impairment charges. The Downstream segment consists of refining and retail operations which I won’t go into detail for the purposes of this post.
Data compiled from CVX filings:
| Net Income by Segment | Q2'15 % of Revenue | Q2'14 % of Revenue | FY14 % of Revenue | FY10 % of Revenue |
| Total Upstream | -388.62% | 92.92% | 88.15% | 92.92% |
| Total Downstream | 517.69% | 12.73% | 22.63% | 13.03% |
| All Other | -29.07% | -5.65% | -10.78% | -5.95% |
| Total Net Income | 100.00% | 100.00% | 100.00% | 100.00% |
I created a very simple and admittedly crude model to project CVX EPS for FY 2017.
| Â | 2014 | FCST 2017 @ $30 oil | FCST 2017 @ $40 oil | FCST 2017 @ $50 oil | FCST 2017 @ $60 oil | FCST 2017 @ $70 oil | FCST 2017 @ $93.46 oil |
| Upstream Rev / Year | $69.8B | $26.7B | $35.6B | $44.5B | $53.4B | $62.3B | $83.3B |
| 2014 MMBOED | 2,600,000 | 2,600,000 | 2,600,000 | 2,600,000 | 2,600,000 | 2,600,000 | 2,600,000 |
| FCST 2017 MMBOED | 3,100,000 | 3,100,000 | 3,100,000 | 3,100,000 | 3,100,000 | 3,100,000 | 3,100,000 |
| FCST MMBOED growth % | 19.23% | 19.23% | 19.23% | 19.23% | 19.23% | 19.23% | 19.23% |
| Oil $ Scenario | $93.46 | $30.00 | $40.00 | $50.00 | $60.00 | $70.00 | $93.46 |
| Oil $ as % of 2014 price of $93.46 | 100.00% | 32.10% | 42.80% | 53.50% | 64.20% | 74.90% | 100.00% |
| FCST Downstream EPS | $1.01 | $1.01 | $1.01 | $1.01 | $1.01 | $1.01 | $1.01 |
| FCST Upstream EPS | $9.13 | $3.49 | $4.66 | $5.82 | $6.99 | $8.15 | $10.88 |
| FCST Total EPS | $10.14 | $4.50 | $5.67 | $6.83 | $8.00 | $9.16 | $11.89 |
| Â | Â | Â | Â | Â | Â | Â | Â |
| PE Ratio | 10 | 10 | 10 | 10 | 10 | 10 | 10 |
| Price / Share | $101.42 | $45.03 | $56.68 | $68.32 | $79.97 | $91.61 | $118.93 |
Here are my assumptions:
- I used FY2014 as a baseline
- From CVX FY2014 10-K, Upstream revenue was $69.8B, the price realized for oil was $93.46/barrel, and EPS was $10.14/share.
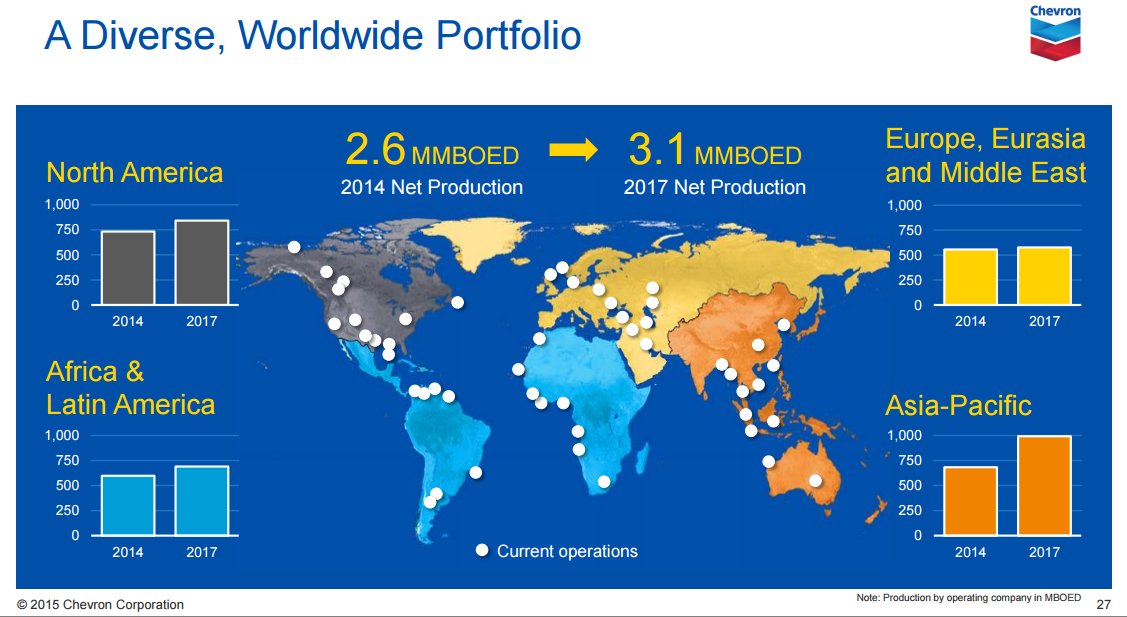
- From CVX’s presentation below, they are projecting production growth from 2.6MMBOED to 3.1MMBOED (million barrel of oil equivalent per day) or a 19.23% increase.
- As I result, I increase volume by 19.23% for 2017.
- I created scenarios for oil priced from $30/barrel to $93.46/barrel.
- If you don’t care about the nitty gritty, you can skip to the last bullet point but basically I’m extrapolating EPS by accounting for management’s forecasted volume growth and also accounting for oil priced from $30/barrel to $93.46/barrel.
- I assume that Upstream accounts for 90% of EPS ($9.13 for FY14) so I keep Downstream EPS steady at $1.01/EPS for each scenario.
- I perform the following calculation: (FY2014 Upstream EPS) x (“$ Oil Scenario” price/$93.46) x (1 + 19.23%) +($1.01 which is Downstream EPS)
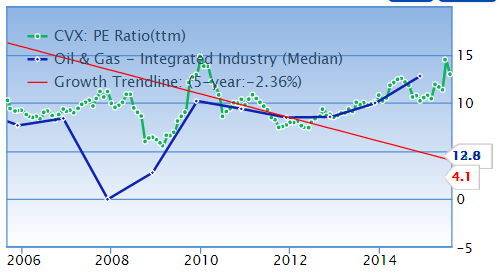
- I assume a PE ratio of 10. You can the chart for CVX’s average PE ratio over the last 10 years. You then multiply each scenario's EPS by 10.
Rationalizing Fair Value
My rough calculations show that Brent oil needs to be ~$60/barrel for CVX to be worth $80/share at a PE ratio of 10. Chevron uses Brent as its benchmark. Today, Brent is $45.30/barrel and CVX stock is at $75.36/share which means it’s overpriced per my calculations. You can disagree with me on many things including Downstream EPS, volume growth, using 2014 as the baseline, PE ratio, etc. When I check Wall Street’s forecasts (table below), you can see that I’m in line with their estimates.
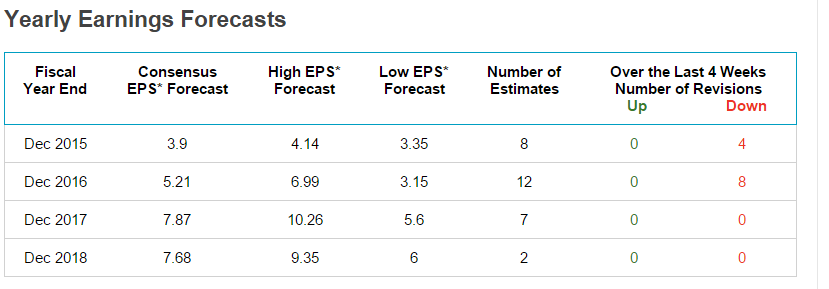
The consensus EPS forecast for 2017 is $7.87 with low of $5.60 and high of $10.26. If you forced me to guess, I would say oil would be around $50/barrel which would put me at $6.83 EPS for 2017. Per the Q2’15 conference call, CVX said “cost reductions, improved efficiency, and increased recoveries have improved our development cost per barrel by around 35% relative to 2014 and make more than 3,000 well prospects economic at $50 per barrel WTI.” Technology and efficiency keeps improving so that’s the reason for my guess.
A Better Model?
Ideally, I could forecast revenue from the ground up. Revenue = (Price x Quantity). CVX’s Q2’15 10Q gives me these bits of information. “The average realization per barrel for U.S. crude oil and natural gas liquids in second quarter 2015 was $50” and “The average natural gas realization in second quarter 2015 was $1.92 per thousand cubic feet”. The 10Q also gives me the following table of quantities:
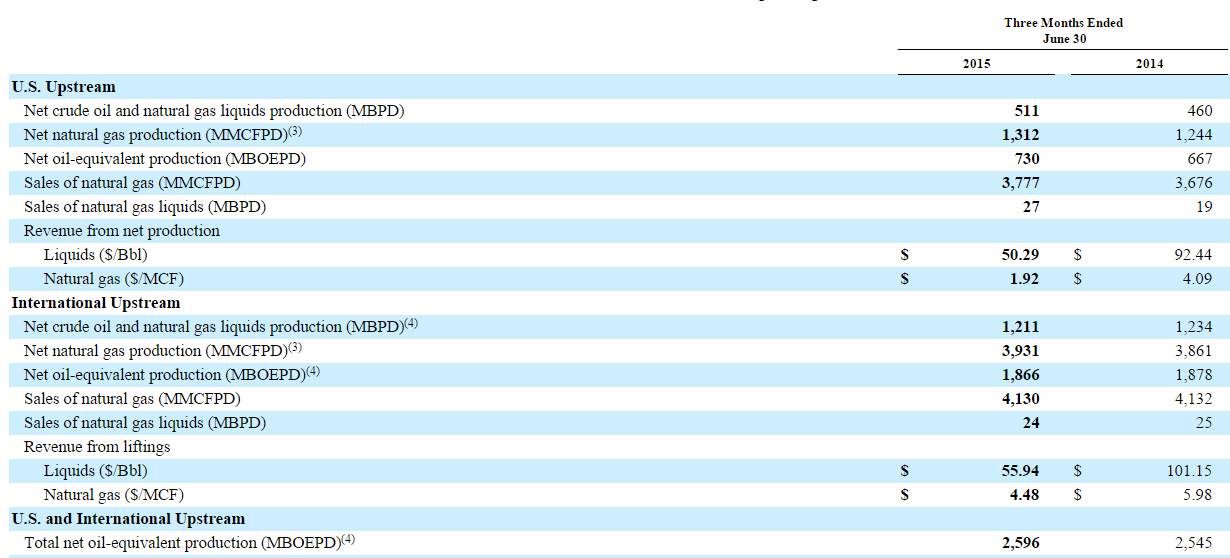
The Q2’15 Upstream revenue is $5.2B after Intersegment Eliminations. I should be able to take the price of oil and natural gas and multiply by the above quantities and get $5.2B. Here’s where I disclose I’m not an oil expert and I can’t decipher how to use the table above. For one thing, many of these line items are in “barrels per day” and I don’t know how many days they’re using. Feel free to laugh at me since I can’t hear you. Are they using 7 days a week or 5 days a week for production? I also don’t know how many maintenance days are typical. If there’s a reader who knows how to reconcile $5.2B revenue with the oil and natural realization prices and the quantities above, it’d be greatly appreciated if you could let me know in the comments below. I could then create a better model to forecast revenue with oil at different prices.
Takeaways
Chevron is an extremely complicated company in an extremely complicated industry. Looking at backward financial ratios should just be the starting reference point. In order to understand a stock's prospects, one must consider future possibilities. With Chevron, it boils down to the price of oil. Nobody can consistently forecast oil prices accurately but we can determine a sensible range. Going through the exercise of considering possible scenarios gives me an idea of the stock's risk / reward. I encourage readers to play around with their own assumptions and create a model to determine if Chevron is right for them. For me, my model shows that Chevron is not yet at an attractive price.