

This is part two of our four-part series on the global deleveraging, which is now beginning and is expected to last over the next two to four years. We anticipate a lot of pain for the global economy in the form of crashing security markets and depression-like economic conditions. This series will cover how we believe this crisis is likely to play out. We will not only help you understand what’s going on, but we will show you how to protect yourself from the coming economic turmoil. We’ll even show you how you can profit from it. If you missed part one, you can find it here. Enjoy part two below: A Neutrino Debt Bomb.

“And when he had opened the second seal, I heard the second beast say, 'Come and see.' And there went out another horse that was red: and power was given to him that sat thereon to take stability and growth from the earth, and that they should demand restructurings from one another: And there was given unto him a great ability to inflate and monetize.” -- Bible (with a few changes by me)
Debt…Debt…Debt…Debt…Debt. It’s been discussed so much over the years that it feels like kicking a debt horse at this point (ahem, sorry).
Here’s the thing, though: We have to talk about it. Debt is the most important and misunderstood dynamic of the economic machine. Debt is the cause of all our current economic ills.
Do you want to understand why there’s slow growth in the developed world? Well, it’s because of debt.
Want to know why inflation has been so elusive? I can tell you — debt.
Are you curious as to why commodities are crashing and emerging markets are grinding to a halt? You guessed it — debt!
What about growing income inequality? Is it Piketty’s return on capital versus growth (r > g)? No! It’s just debt. And it goes on and on.
Of the Four Horsemen, debt is the one that drives all the others (Currency Wars, Commodity Busts and Market Crashes). If you can understand the dynamics of debt cycles, then you can take much of the guessing game out of macroeconomics. The macro events above, and much more, become not only unsurprising but absolutely expected.
My aim in writing these pieces is to not only inform you about the messy debt situation we now find ourselves in, but to also teach you how to properly view the world (as we see it).
And then of course I’m going to show you practical and actionable steps on how to protect yourself. If you really pay attention, I’ll even show you how to make a killing.
I also feel a slight obligation to publicly rebuke the misinformed and asinine commentary by economic talking heads sitting on both sides of the ideological aisle. These are the Keynesians and Austrians.
The Keynesians are the clueless policy makers who run the world. The arrogant ivory tower economists and central bankers whose only answer to slow growth has been more debt spending.
The Austrians are the doomsdayers, the gold bugs and the establishment haters who’ve been worse than a broken clock in their calls for a market crash.
Both camps don’t understand a lick of how the real world works (though admittedly, I do have a soft spot for Austrians as their logic isn’t terrible). And both are bad for a trader’s P/L.
Being the dedicated market operators that we are at Macro Ops, we don’t care much for trading along conventional thinking or rigid ideological lines. Instead, we search out first principles and universal truths. The validity of our thinking is tested every day in the markets.
Conventional economic “wisdom” fails to understand the long-term secular effects of debt. If it did, then Keynesians would realize that just more spending is not the answer, while Austrians would realize that it’s way too late to call for just a rate hike.
Both parties fail to grasp the larger secular forces at work: deflationary debt dynamics. These dynamics are the logical sequences that comprise debt cycles. They have happened in a similar fashion since the advent of lending and credit.
Now when I say cycles, don’t roll your eyes and think I’m some tinfoil hat-wearing conspiracy theorist. I don’t believe in Elliot Waves or Fibonacci or Pi or that some other hidden universal force has set us on a pre-determined path of repetition — though I admit, I do look good in tinfoil.
A debt cycle is just the logical progression of large economic sequences that follow a certain order. These sequences arise due to predictable human nature and the inherent structure of our monetary system.
Understanding these cycles won’t give you the ability to predict the future. But it will give you the ability to better understand the present and enable you to assign significant probabilities to what’s around the corner.
Our view of the world and the dynamics of debt were born out of the work done by Ray Dalio (Trades, Portfolio) and his firm Bridgewater (the most successful hedge fund of all time). If you’re not familiar with their work on “How The Economic Machine Works,” I suggest you check out this site.
Here’s a quick overview of how the economic machine and debt cycles work:
The economic machine starts with money, or more specifically, what we think of as money, which is cash plus credit.
Mainstream economics tends to focus solely on physical hard cash. But it is credit that makes up the majority of transactions in the world. In the U.S., the supply of physical cash amounts to roughly $3 trillion. But total credit is near $60 trillion. Most buying (demand) is through credit, not cash.
It’s important to know this because though many people mistakenly think of credit as cash, the two actually work very differently. And it’s this difference that has compounding second- and third-order large-scale effects.
You see, when you buy something with cash, you exchange that cash for a service or good. The transaction is closed. Complete. There is no further obligation between the two parties.
When you buy something with credit, you exchange credit, a promise to pay in the future, for a good or service now. That transaction is not complete until the borrower pays off that debt. In this instance, credit or money is created out of thin air, without the help of the central bank or U.S. Treasury. All you need is two willing parties and credit (money) can be created. An asset to the lender is created, as well as a liability to the debtor, that lasts until the transaction is closed by the debt being repaid.
It is this ability to create “money” independently through credit purchases that compounds over time and builds cycles. It is these credit cycles that drive the economic machine.
There are three primary forces that drive the economy over time. These are:
(Charts via Bridgewater's “How The Economic Machine Works”)


Long-term productivity growth
Over time, the economy (real GDP per capita) averages 2% growth. This is the result of efficiency gains born from the accumulation of knowledge — we become more productive over time.
It is this steady build up of knowledge (advancements in our technology and know how) that drives productivity and results in the continuous improvement of our living standards.
Many of us love to be pessimistic about the current state of the world, complaining that “things were so much better back in the day.” But were they? Truth is, we as a society have it pretty good when compared to the generations before us. As Warren Buffett noted in Berkshire’s (BRK.A, Financial) (BRK.B, Financial) recent letter:
“Indeed, most of today’s children are doing well. All families in my upper middle-class neighborhood regularly enjoy a living standard better than that achieved by John D. Rockefeller Sr. at the time of my birth. His unparalleled fortune couldn’t buy what we now take for granted, whether the field is – to name just a few – transportation, entertainment, communication or medical services. Rockefeller certainly had power and fame; he could not, however, live as well as my neighbors now do.”
But we are interesting creatures. We’re not satisfied with just a 2% average increase in living standards. We base the quality of our lives in comparison to those around us (usually those who are wealthier than us). And in addition to our instinctual pettiness, we’re actually neurologically wired with the propensity to live beyond our means. Jason Zweig explains this phenomena in his excellent book "Your Money and Your Brain: How the New Science of Neuroeconomics Can Help Make You Rich"Â (emphasis added by me):
"You would expect logically that the borrowing and spending of money would be emotionally painful to people because having money is intrinsically a good thing, and having less money would have to be worse… Going from more money to less would be painful. When people borrow and spend money, it's really the reward centers of the brain that become activated… When you borrow money, you are thinking not about the long-term consequences but the short-term result: You have more cash in your pocket. The pain you are going to experience down the road of having to pay -- that's in the future, it's remote, it's abstract."
Credit is like a drug; we’re addicted to shots of dopamine that we receive every time we purchase something. We are literally programmed to overvalue present rewards and greatly underestimate future costs.
Credit allows us to delude ourselves into thinking we can outpace this 2% trend. But in the long run we can only consume (spend) as much as we produce (earn). When we spend more than we earn we create bad debts — debts that will not be repaid.
The way we’re wired and the structure of our credit system clashes with the limits of our average long-term productivity growth. This irreconcilable difference creates cycles.
These cycles that oscillate around the 2% productivity trendline are called debt cycles. They’re comprised of leveragings and deleveragings of debt/credit.
A debt leveraging occurs as we increase our debt spending over time (total debt load relative to income). By doing so we pull future consumption forward while causing temporary increases in productivity above the 2% trendline average.
Eventually these leveragings reach a saturation point where debt servicing costs relative to incomes grow too large. They begin to hamper demand growth. When that point is reached, the economy will begin a deleveraging. In a deleveraging, we fall below the 2% productivity trendline.
The chart below (again, via Bridgewater) shows the overlay of all three forces over the last 100 years.
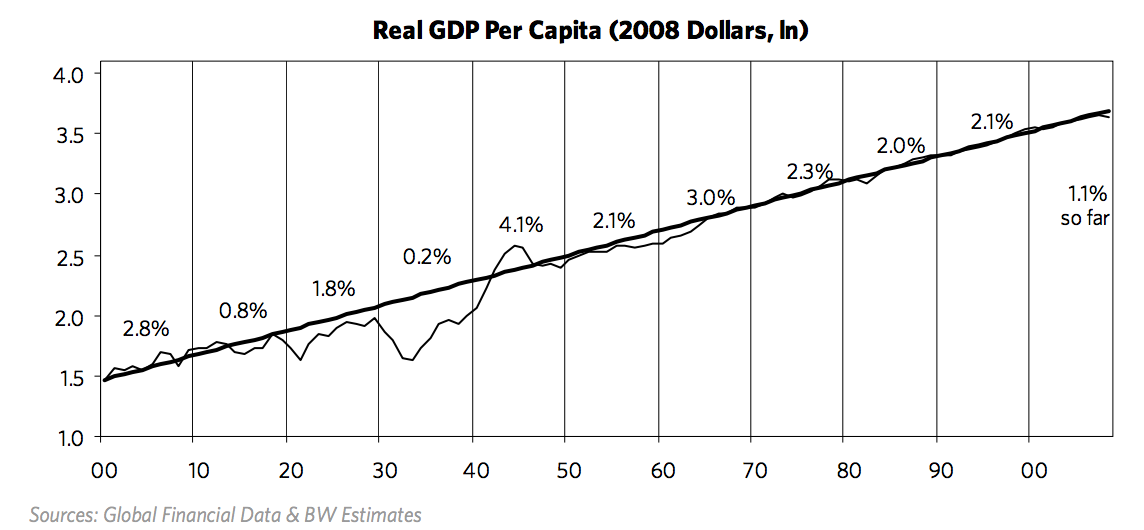
These leveragings and deleveragings are the result of the long-term and short-term debt cycles.
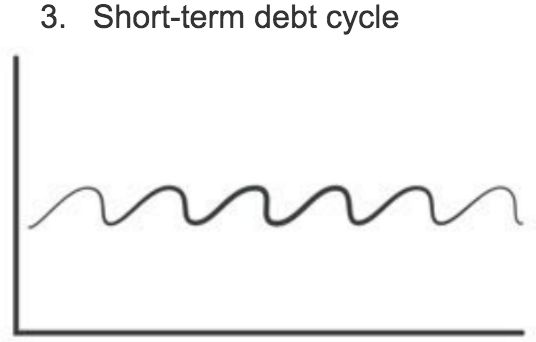
The short-term debt cycle
The short-term debt cycle (otherwise known as the business cycle) is fairly well understood, since it tends to occur every five to seven years.
These short-term cycles result from the easing and tightening of money by the Federal Reserve. Here’s a quick rundown of what happens when the Fed eases (lowers interest rates).
The three immediate impacts of lower interest rates are:
- New credit becomes more attractive, so people and businesses borrow more money.
- Existing debt becomes cheaper to service since its interest payments are now lower.
- The discount rate at which businesses and financial assets are valued is lowered (a lower discount rate increases present value, making an asset more attractive). Investors then bid up these assets, moving further out on the risk curve, causing spreads between financial instruments (i.e. cash, bonds, equities) to tighten.

The beautifully hand drawn chart above shows the spread between financial assets. When spreads widen (higher interest rates), risk premiums go up and investors get more return for assuming risk. When spreads tighten (lower interest rates) the risk premiums go down and investors get less return for assuming risk.
Cheaper debt increases borrowing and boosts demand. People and businesses borrow and spend more. And since one person’s spending is another’s income, incomes rise, further driving demand.
Increasing demand inflates asset prices (i.e. homes, business, stocks, etc.). When asset prices rise, people’s net worth rises, as well as their credit profiles. This allows them to borrow more. Since we’re strongly affected by recency bias and myopia, we extrapolate this current income growth into the future. We expect it to continue and borrow even more.
This is a reflexive process. Increased borrowing raises demand, which drives up incomes and inflates asset prices. Higher asset prices result in stronger credit profiles, which leads to more lending/borrowing. A positive feedback loop is created.
This process goes on until rising demand bumps up against productive capacity and we get demand-pull inflation. Productive capacity is the limit of what an economy can produce. Credit demand can be created much faster than what an economy can realistically support. When this happens, inflation begins to accelerate because there’s more demand than what suppliers can handle. Too much money begins chasing after too few goods, which drives up prices. The result is demand-pull inflation.
One of the Federal Reserve’s mandates is to regulate inflation. When inflation begins to rise, the Fed is forced to raise interest rates. Once they do, the feedback loop goes into reverse.
The cost of debt increases due to higher interest rates. This causes money to tighten and demand to fall as people and businesses borrow and spend less. And since one person’s spending is another’s income, incomes drop, further decreasing demand. The fall in demand causes asset prices to drop, which lowers the credit profiles of borrowers, resulting in less lending. The discount rate rises and widens the spread between financial assets (i.e. stocks and bonds sell off and become less attractive), and on and on it goes.
Until the Fed cuts rates once again.
But this time, since debts are now higher than they were when the Fed previously lowered rates, meaning more income has to go to debt servicing, the Fed has to cut interest rates even lower than they were before.
You can see this logical sequence of events in the chart below. It shows the Fed funds rate over two short-term business cycles.
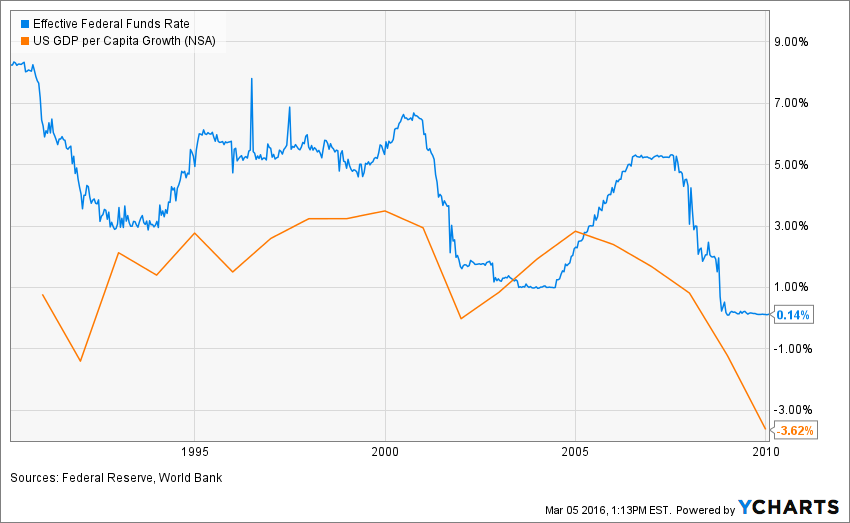
From 1999 to 2000, the Fed raised interest rates until demand and asset prices started to fall and the economy went into recession. The Fed then quickly cut interest rates to a point lower than the previous cycle low.
The short-term cycle repeated itself again in 2004 to 2007, when the Fed raised rates to subdue inflation. But interest rates were raised to a lower point than the previous cycle. Then in 2008, the Fed was forced to lower them again to fight off recession — and they were dropped to a new secular low.
Short-term business cycles repeat over time. Each time, interest rates move lower. Interest rates have to move lower because debt (and the costs to service it) keep on rising, in both the public and private sector.
This sequence continues until rates cannot be lowered any more (they reach zero or negative). This is the point at which a pivot in the long-term debt cycle takes place.
The long-term debt cycle
Longer term debt cycles are not well-understood by the public. This is because they operate on a longer timeframe, hence the name. The cycle only becomes very noticeable at transition points, which generally occur once every generation, about every 25 to 50 years.
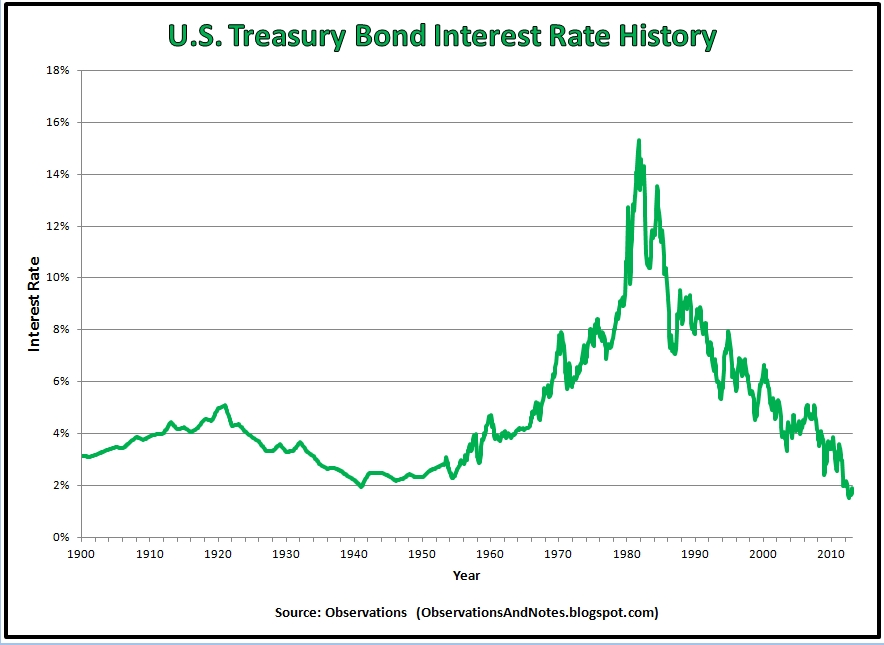
Looking at the chart above, you can see the long-term debt cycle at work. Interest rates peaked in 1920 and then turned over and began trending lower, which led to the roaring '20s. They bottomed out in the '30s to '40s before trending higher again for the next 40 years. In 1981 they peaked again and have been trending lower ever since.
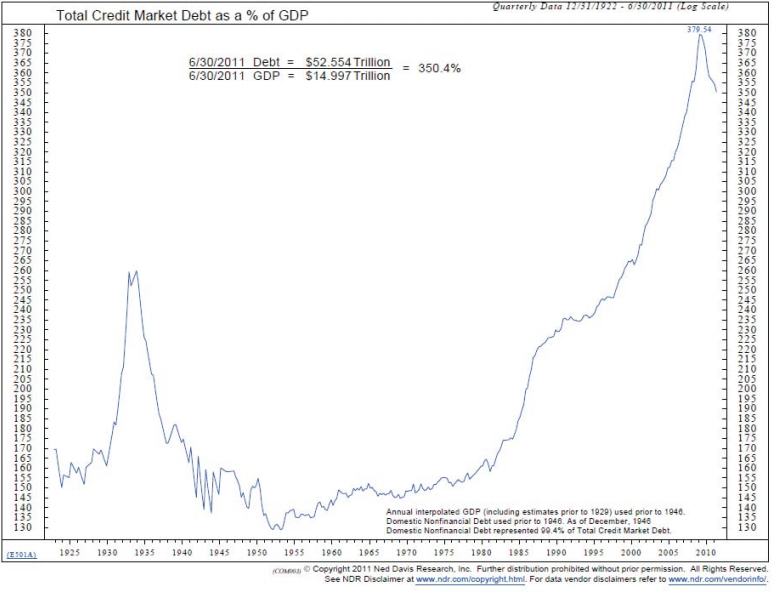
Total debt accumulates over the long term as shown in the chart below. You can see two debt mountain peaks: one in 1929 where total debt peaked at 260% to GDP, and then the peak today where debt is at 380% to GDP.
Most people focus on public debt (debt owed by the government) at the exclusion of private debt (debt owed by households and corporations). This is wrong. Though public debt is important, private debt is the primary driver of debt cycles. Private debt is where the demand comes from that propels the economy. Also, governments can more easily manage their debt by monetizing it away through central banks. Unfortunately, the private side doesn’t have this option.
The accumulation of debt cannot go on ad infinitum. The reason being that eventually interest rates cannot be lowered any further to keep things going. They reach the zero bound and no amount of credit easing can induce people to borrow and spend more. Accumulated debt levels become too high and the servicing costs too large. The credit system literally becomes maxed out.
This is where we are now. We’re at the turning point of the long-term debt cycle. The last time we were here was in the 1930s -- the Great Depression.
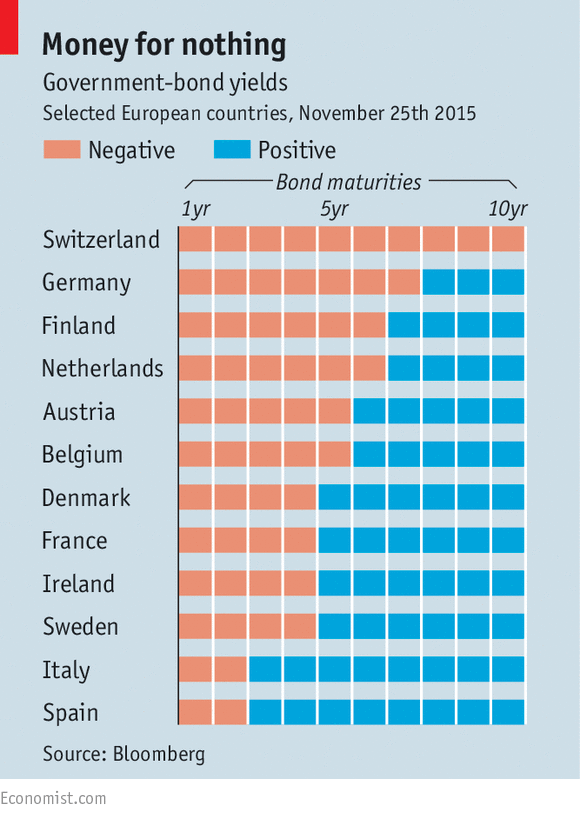
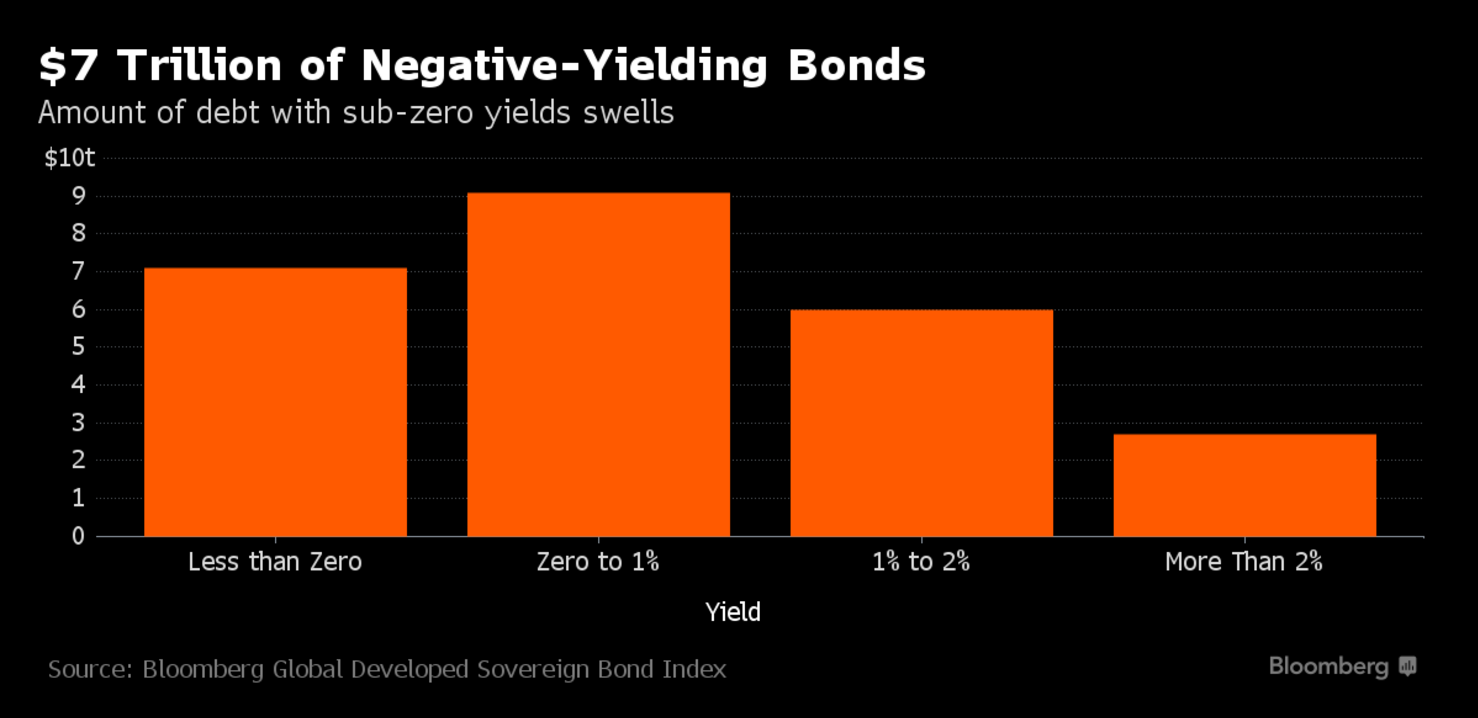
Interest rates across the majority of the developed world are now at or below zero. There is over $7 trillion in negative yielding debt! $7 trillion dollars! This is not how a true capitalistic system should work. But it’s exactly how our current system is expected to work.
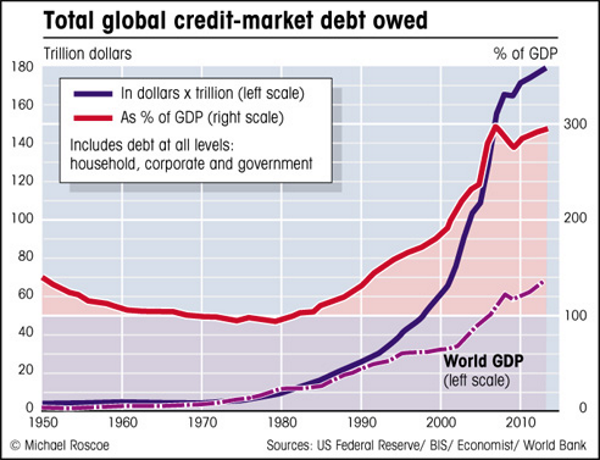
One thing that is different this time around versus the 1930s is that the global economy on a whole is much more leveraged. In fact, the world has never had as much debt relative to GDP as it does now, not even close.
The deleveraging that everybody thought was happening in 2009 was just kicked down the road to today. This was possible because there was still room for interest rates to fall to squeeze a bit more credit demand into the system.
Now, with rates at zero and the efficacy of quantitative easing maxed out, the can cannot be kicked any further.
Since 2009, both the developed and developing world have seen their debt-to-GDP levels rise on average by 35%. A report done by Mckinsey last year suggested the world had added an additional $57 trillion of new debt since 2008Â — a figure which is undoubtedly higher today.
In 2009, China and emerging markets were the key to boosting global demand to help stave off a global depression. But this time around they’re a major part of the problem.
Over the last seven years, China has seen its debt-to-GDP level increase from 160% to over 250%. Their total debt accounts for over half the debt of the developing world. It’s estimated that China is adding to this debt at the rate of $6 trillion to $7 trillion a year. You may be thinking “Well, maybe this credit is being invested in high-return projects,” but you’d be wrong. Our estimates (and those of others) have well over half of China’s new debt issuance in the last few years going to pay interest on existing debt!
It appears the Chinese truly believe in the maxim “A rolling loan gathers no loss.” We’ll see how long they can keep that up.
Economist and central bankers have been scratching their heads as to why global growth has been so sluggish and inflation so difficult to create. Well, if they just understood the dynamics of the long-term debt cycle as I’ve described to you here, it wouldn’t be such a mystery.
This oppressive level of debt is pulling current demand lower through debt servicing costs. The lower demand combined with an economy that has a capacity glut (built on credit) results in deflation. The kind of deflation that will take a decade to work through.
What about Piketty? Is he right? Are our current woes the result of capitalism being a broken system? Not exactly.
The fuss over income inequality and the strain it puts on our society is a definitely real. Income inequality has been steadily increasing since the late 1970s. You can see this on the chart below.
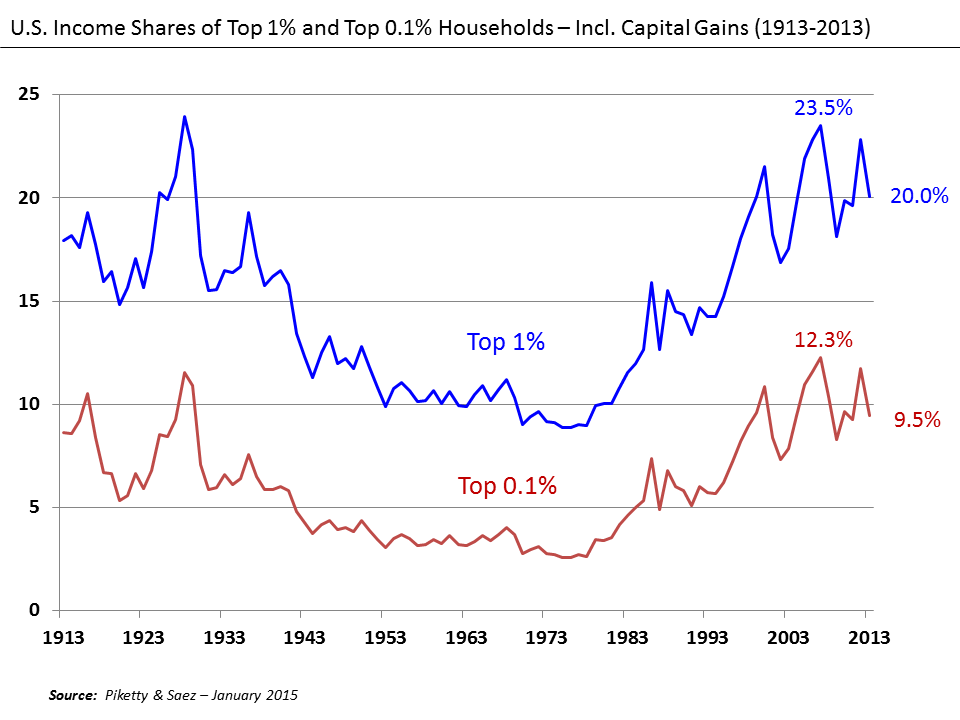
But income inequality is not due to return on capital outpacing the rate of growth (meaning the return on invested money outpaces real growth; the rich get richer faster than the overall growth of the economy) as Piketty argues.
This is a correlative link, not a causative one. Return on capital has been outpacing the return on growth over the last 45 years because of the long-term debt cycle and the continuous lowering of interest rates by the Fed. Remember, interest rates have been steadily falling since 1981 (right when income inequality began rising).
The rich are richer because they own (mainly through credit) more assets (i.e. financial, property, business, etc.). These assets have been inflated on the back of credit/debt growth over the course of the leveraging part of this long-term debt cycle.
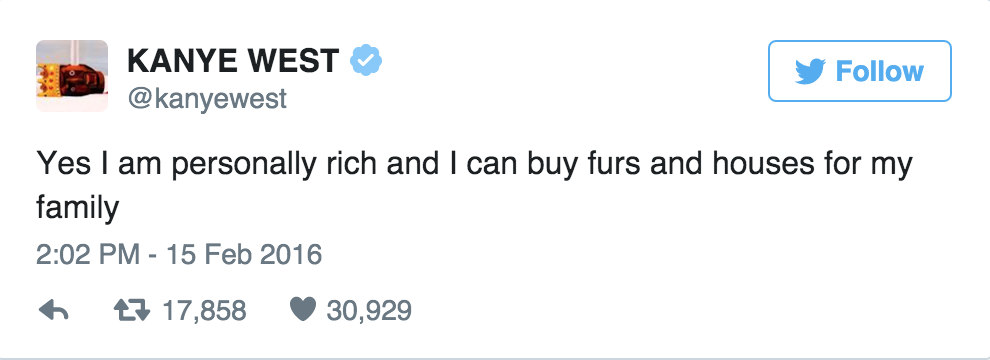
Knowing this, it should be of no surprise that some of the people we think of as super-rich are in reality not very wealthy at all, meaning their assets don’t outweigh their liabilities. They just have access to far more credit than most people. They’re drowning in debt… cough… Kanye… cough.

And it’s not just Kanye. Over the last 35 years, we as a society have pulled a lot of future consumption forward. We’ve been enjoying the future fruits of our labor today by going crazy for those shots of credit-induced dopamine. We’ve mistaken increasing debt for rising prosperity. But now the future is banging on our door demanding we pay our bill.
Bill Gross of Janus Capital commented on this in his recent investors letter:
“What readers should know is that the global economy has been powered by credit – its expansion in the U.S. alone since the early 1970’s has been 58 fold – that is, we now have $58 trillion of official credit outstanding whereas in 1970 we only had $1 trillion.”
A 58-fold increase in credit in just under 50 years is a huge leveraging. This build up in debt is going to have a large impact on the U.S. and the world moving forward. It’s going to affect everything from growth, to living standards, to domestic politics (Trump and Sanders) and geopolitics (i.e. international conflict).
Think of the period following the 1930s. We are likely in for some interesting times ahead.
This is what’s going to happen going forward
We are at the beginnings of both a secular (long-term) and cyclical (short-term) deleveraging. This is happeningall around the globe.
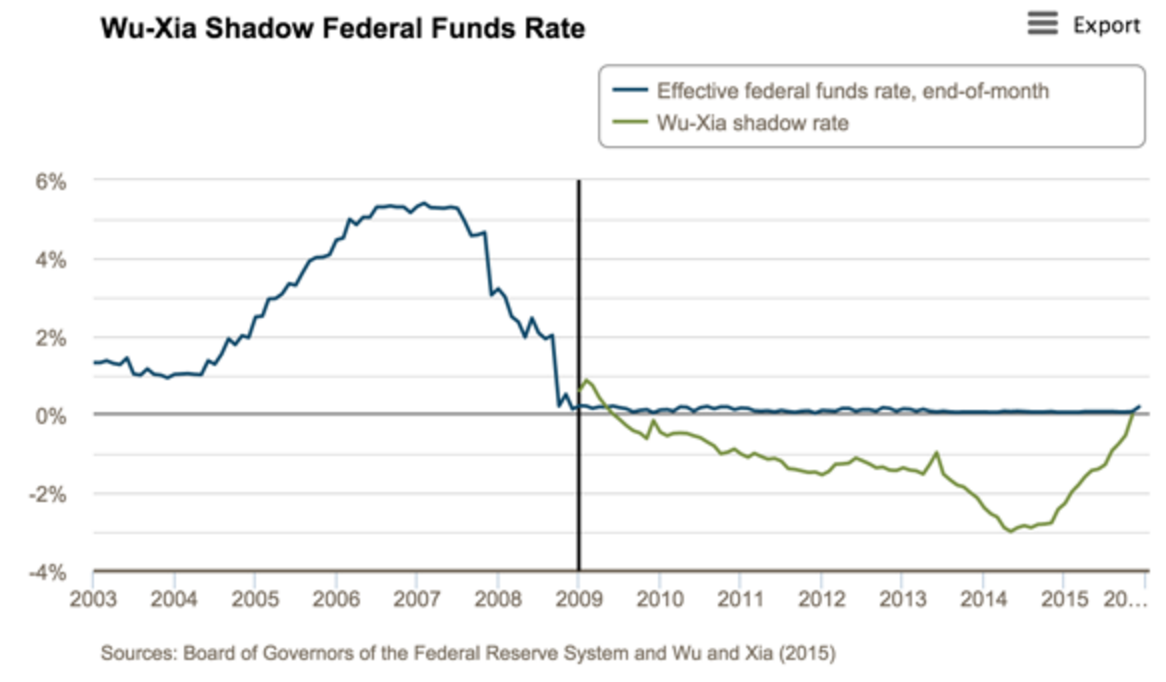
This short-term deleveraging cycle began last year. That’s why volatility has come back in force. What many people (including central bankers) don’t realize is that the Fed has already tightened by over 3.25%, far more than just the 25bps hike from last December. This is because of the easing effect of QE and the tightening that resulted by ending it in October 2014. This tightening effect can be seen in the Shadow Federal Funds rate (ironically, created by researchers at the Fed).
This hiking cycle is now likely over and the Fed’s next actions will be to cut — but they won’t be able to cut much because they’re straight outta ammunition (hence why we’re at the transition point of the longer-term cycle).
The tightening effects of the Fed’s rate hikes take a while to work their way through the economic system. You can expect further volatility and evaporating demand as the effect of these increased rates is felt, while at the same time the deleveraging picks up steam.
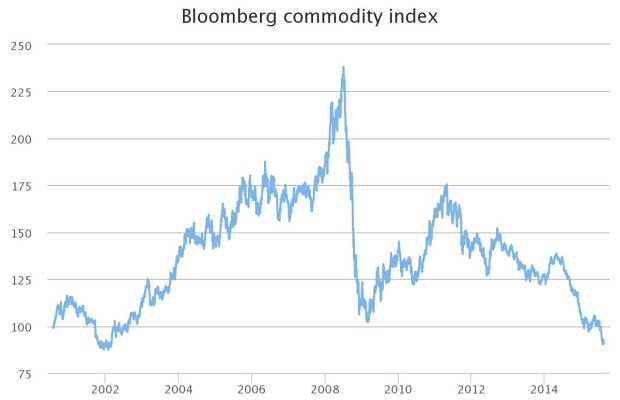
Remember, deleveragings are the destruction of demand. Falling demand means lower asset prices — creating that deflationary feedback loop. This is why commodity prices have been cratering since 2014. And this is why they will continue to fall over the coming year.
At this point, traditional monetary easing has become equivalent to “pushing on a string.” It’s just not working. Negative rates don’t work, and in fact, they have a net-negative impact on lending and demand. Central bank policy aimed at getting investors to assume more risk has contracted spreads as tight as they’ll go. So we can expect negative real-returns over the next decade.
The only option left for many central banks is the route they’ve taken every single time throughout history when faced with a secular deflationary deleveraging: unorthodox monetary policy. Otherwise known as straight-up debt monetization through haircuts/restructurings and inflation.
Since debt deleveragings are a deflationary force, the central banks need to create enough of an inflationary force to counteract it. They need to monetize the debt (using inflation to devalue it) so nominal asset prices remain somewhat stable as borrowers are relieved of their debt burdens. The goal is to keep nominal GDP above nominal interest rates. Keeping nominal growth above the nominal cost of debt allows debt to be properly monetized over time.
This will be accomplished through more quantitative easing and something akin to a “helicopter drop,” where the government does a wealth transfer and assumes a lot of private debt. If this is carried out perfectly (and that’s a big “if”), where inflation is created in just the right amount to counteract deflationary pressures, then we’ll have what Dalio calls a “beautiful deleveraging.”
A beautiful deleveraging is the least-worst option (the others being a deflationary deleveraging and a runaway-inflationary deleveraging like 1930s Weimar Germany).
There is no easy way out of this. A beautiful deleveraging will still be very painful and is not easy to carry out. This is a point that many fail to understand. You can’t just raise interest rates right now. It’s toolate. It would result in a deflationary deleveraging, which is the most painful option of all. We have over a generation of debt built up. Much of which is just bad debt. It’s worthless and will not be repaid.
This long-term cycle of debt accumulation and then debt monetization is so ingrained and prevalent throughout human history, that even the Bible talks about having a year of “Jubilee” every 50 years, where all debts are all wiped clean.
Well, our global Jubilee is upon us. But unlike biblical times, creditors will not willingly forgive debts out of the goodness of their hearts. The debts will be forgiven in the most opaque way possible, so we can all still remain in denial of the reality of our monetary system. The debt will be inflated away through the devaluation of currencies.
But the inflationary period caused by this devaluation will not start for another couple of years, at least not in the U.S. There are two primary reasons for this:
The Fed does not understand the secular dynamics at work. They’re committed to maintaining their credibility by following their planned rate hikes — of which they will be lucky to get even one more in.
Because of the Fed’s mandate and the current political environment, they will not have the political capital to enact unorthodox monetary policies until things get very, very bad.
We are at the very start of that very bad part. Despite recent volatility, U.S. financial assets are still near record high levels. Markets are in the beginning stages of rectifying this valuation discrepancy and are about to get knee-capped back down to earth (or their 2008 lows).
The chart below shows the inflation-adjusted S&P 500 overlaid on NYSE margin debt. This margin debt (most stock buying is done with debt) is starting to unwind (from record high levels). This has preceded the last two market crashes and is flashing signs of the next one, soon to come.

An interesting side note: It is the buying of financial assets on margin (with debt) that creates massive amounts of instability and liquidity issues within markets. Margin buying increases as markets rise. Players become more leveraged as equity valuations become more unsustainable. When the cycle turns, you have a lot of margin-bought securities trying to squeeze through a narrow exit at the same time. Selling begets forced selling and so on. (Pay attention and you’ll notice how “reflexivity,” as described by George Soros, is a recurring part of the inherent nature of markets and economies.)
Credit markets, which serve as the canary in the coal mine to the broader economy, have been sounding cries of warning for some time. As yields creep higher, liquidity is squeezed, and we quicken our march towards the proverbial cliff.

The U.S. dollar will grow stronger during the beginning stages of this global deleveraging.
There is over $12 trillion in outstanding dollar-denominated debt held outside of the U.S. This is the result of a popular carry trade driven by the Fed’s loose monetary policy. U.S. dollar debt is essentially a short position on the dollar (as the dollar falls, dollar debt becomes cheaper to service).
The trade worked well when the dollar was weakening, but now that it's strengthening, companies and other institutions have an incentive to pay off their debt faster than before to avoid rising servicing costs. To pay off that debt, the debtors have to trade their currency for dollars. This boosts demand for dollars, which raises dollar value compared to other currencies. It turns into a reflexive process that goes on and on.
We’re only in the middle of this dollar move. It’s been experiencing an expected and healthy retracement that will continue over the next month as weak hands get shaken out, but it will get back to its bullish trend very shortly.
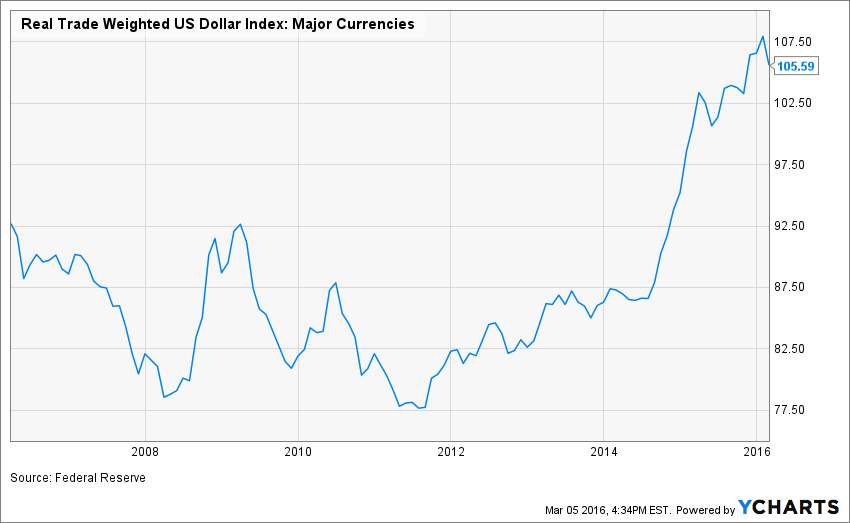
Since the dollar is the reserve currency of the world, a strengthening dollar impacts global assets in interesting ways.
First, all commodities are priced in U.S. dollars. When the dollar rises, it acts as a weight on commodities. It is no coincidence that the dollar bull market coincided perfectly with the collapse in oil. Historically, the dollar accounts for 30% to 50% of the larger trend in oil.
It is our understanding of this correlation that allowed us to anticipate and profit from the collapse in oil and other commodities that began in 2014. It is also this understanding that leads us to believe that the fall in commodities is not yet over.
We predict that oil won’t bottom until it hits the teens. The carnage won’t stop until there’s blood in the oil streets. Though things are bad in the oil patch now, they are going to get much worse.
And for you gold bugs out there, the recent rally in gold is an epic bull-trap. The dollar has macro drivers equivalent to an Atlas-V rocket and liftoff is just beginning. Since gold is priced in dollars, it cannot maintain a bullish rally while the dollar stays strong. This is why the gold rally will be short-lived.
There will be a time to own gold, but that time won’t be for at least another year when dollar inflation really kicks in through the “unconventional monetary policy” we discussed before.
As the world’s reserve currency strengthens, it acts as a monetary tightening on the rest of the system. This is because, as we discussed, the world is net-short dollars since it is a large funding currency. When the dollar rises, it sucks liquidity away from credit markets around the world. This further spurs deflation, driving asset prices and markets lower, which is why emerging markets have fallen into the crapper.
The beginnings of the next global crisis have already been put in motion. It’s inevitable and cannot be stopped. It can only be managed.
The crisis will begin in Europe, where banks have admitted to holding over $1 trillion in non-performing loans — we believe the actual number to be much higher. The western European continent is awash in bad debt and saddled with a bloated bureaucracy that is ill-equipped to handle the coming storm. Look at the state of Ireland in the charts below. I mean, dear God, how did that happen?
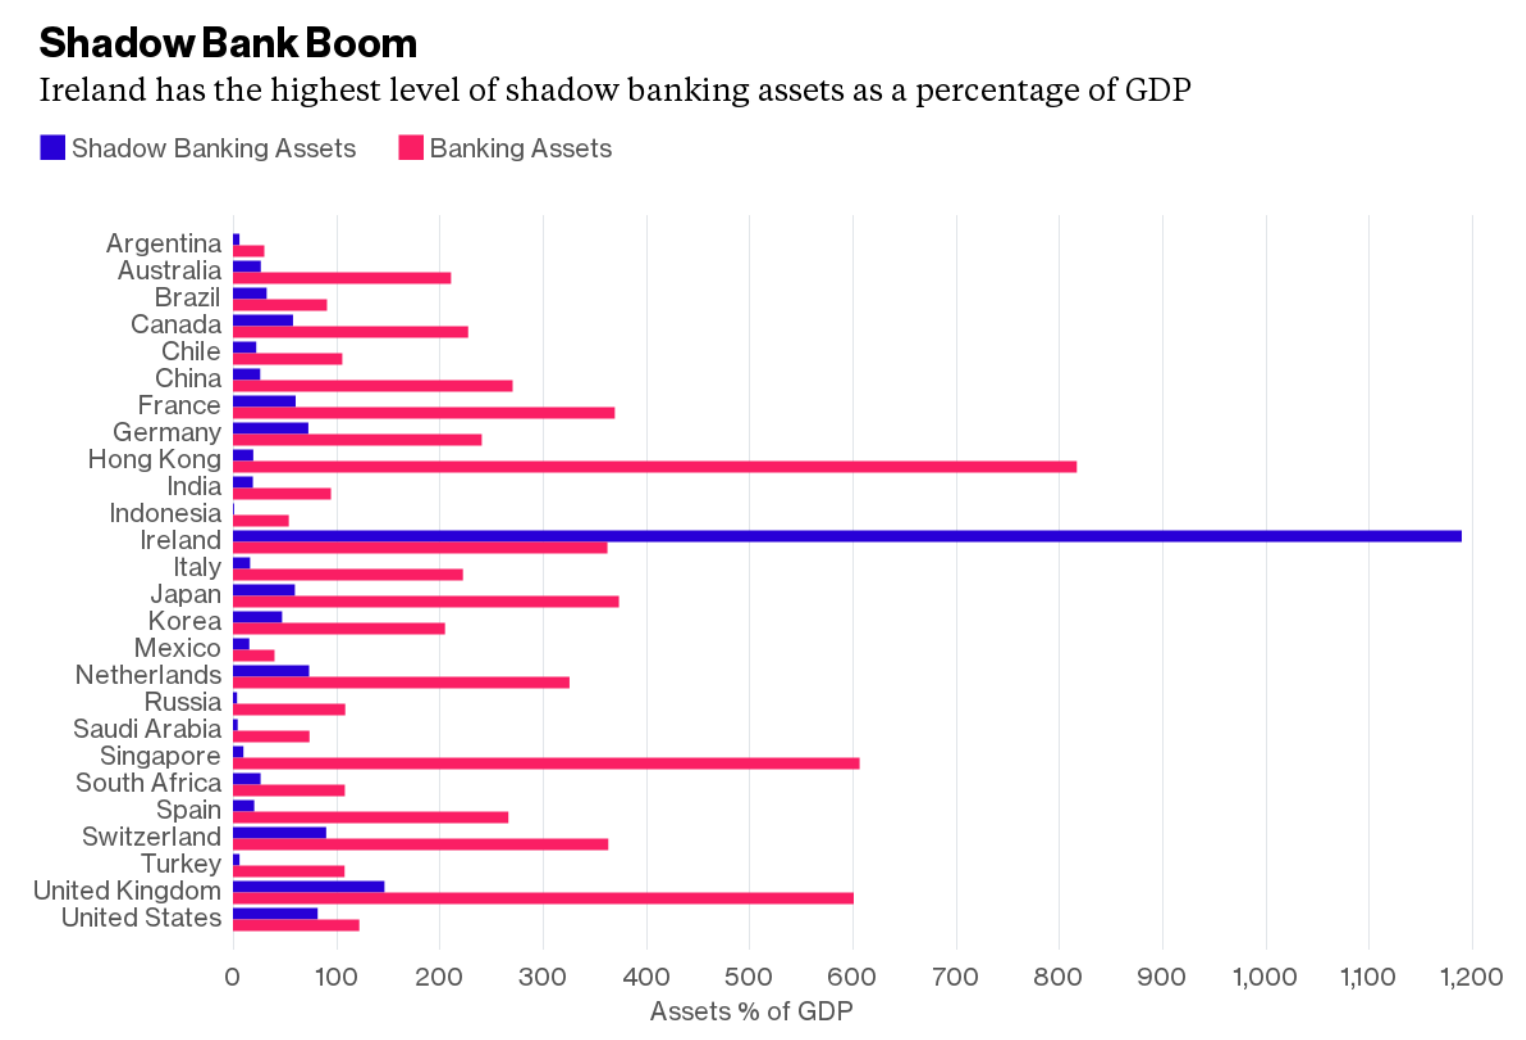
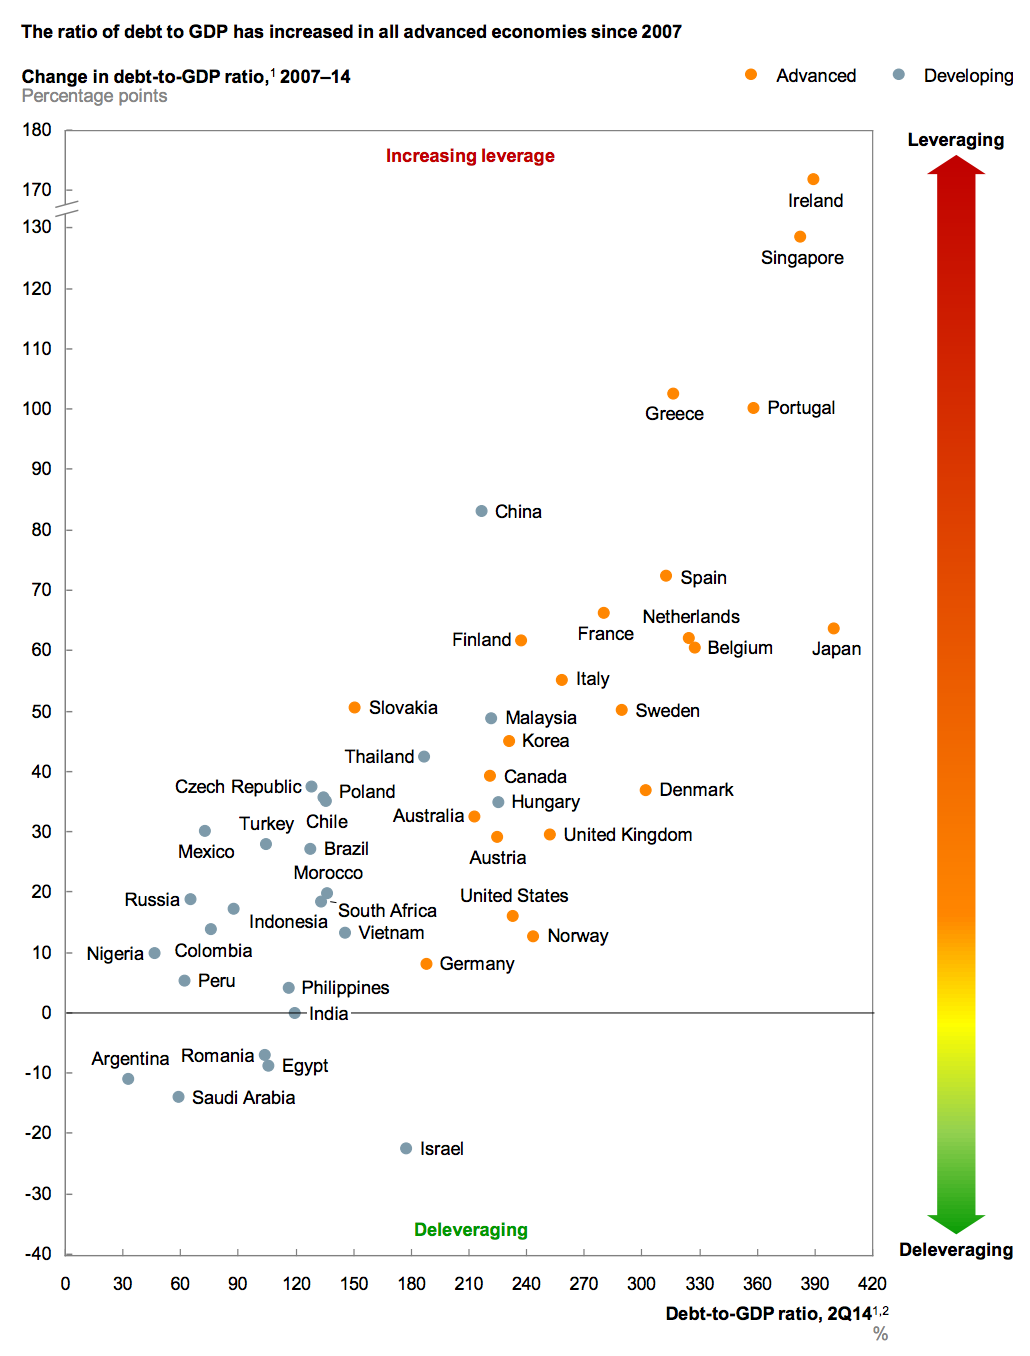
The coming crisis will lead to the slow fracture and breakup of the European Union as we now know it.
Countries like Greece, Ireland, Italy, Portugal, Spain and possibly even France (though many believe it impossible) will be found insolvent. The euro will continue to fall, which will boost the dollar even more.
This rising dollar will force China’s hand into floating the yuan to manage their exports, bad debts, etc. This contagion will spread across the world, as developing countries from Brazil to South Africa try to do the same. They will likely all lose control of their currencies a la the 1997 Asian financial crisis, but this time on steroids.
This will cause the deflationary tidal wave (which we discussed in the first Horseman piece) that will crash upon U.S. shores in the coming year.
Jim Rogers, legendary investor and former partner of George Soros (Trades, Portfolio) at the Quantum Fund, recently said in an interview that there “is a 100% chance of a U.S. recession within a year.” He also discussed various drivers causing the start of a bubble in the dollar.
We couldn’t agree more. We predict the U.S. will start a recession in the fourth quarter. The dollar will be significantly higher than it is today by the end of the year (after a quick retracement in the near-term).
How to profit
First off, passive investing is dead. Done. Fuhgettaboutit!
Passive index investing is a sensible system and has performed well over the last 30 years. But it will get hammered in the decade going forward.
The whole premise of passive is based off the belief that U.S. markets rise steadily over time. This is true over the long haul, but it’s not practical for investors who need to live off their income in the next two decades.
This is because of the secular shift we’re going through (total real market returns will be negative over the next 10 years). Think Japan over the last three decades. I believe (hope) we will handle this deleveraging a lot better than Japan so it won’t last as long. Maybe 10 to 15 years.
During this time we’ll experience collapsing real-growth and a period of crippling deflation followed by decades of inflation; this is the other side of the long-term debt cycle; think 1960s to 1980s.
Will we have bull markets during this period? Of course. But they will come with increased volatility and lower real-returns.
This is not a great time to just leave your net worth to the whims of central banks with passive investing.
All is not lost though. This will be a target rich environment for traders (we’re licking our chops) who understand how the economic machine works and remain vigilant and protective of their capital.
Here’s what you want to do: Over the coming year, go long safety and short risk.
You’re going to want to keep your money in the U.S. The U.S. is viewed as the world’s cleanest dirty shirt. Though our debt-to-income levels are in the higher tier, our institutions are best suited to handle the coming economic crisis when compared to other countries. This is by no means praise for the efficiency of our government, but rather an admonition of just how bad everybody else’s is.
We’ve been pounding the table these last few months about buying long-bonds (20-plus year Treasuries) and our conviction has only grown. You can do this by buying the outrights, ZB futures or through ETFs like TLT.
U.S. bonds are undervalued on a relative basis and the coming deflationary storm is going to boost demand for one of the “safest assets in the world.” The budding currency war is an added kicker here. People will be stampeding to exchange their currencies into dollars, and Treasuries will be the logical place to store their wealth.
The rush into the U.S. dollar is going to reignite the dollar bull market, driving the greenback to decade highs. This is also going to crush a lot of commodities (commodities are priced in dollars), so you should stay away from buying any companies that rely on say, higher oil prices. I believe oil will bottom in the teens, but there won’t be a 2009 style “V” recovery. Oil will stay low for the foreseeable future.
You want to be short high-risk assets. Now shorting bear markets can be a very difficult thing. They are extremely volatile and have sharp, short crushing, bullish retracements. This makes it difficult and sometimes near impossible to play traditional breakouts.
The key is to use retracements as entry points with a strong emphasis on tight stops and a laser focus on capital preservation.
There is no shortage of overvalued risky assets in this market. But you want to make sure to play things that are liquid with low costs to carry (i.e. short borrowing costs, dividend costs, interest, etc.). If you want to make things real easy, you can just play inverse ETFs, but just know that overtime you will lose a little on the negative compounding built into their structures.
As we said in the first Horseman article, our intent is not to be doom and gloom, but to explain the world as we see it and assign probabilities to what we view as the most likely outcomes. We have been here before in history and we will be here again in another 50 to 75 years or so.
Things will be tough for the next decade, but the world will continue to spin and people will continue to work, spend and go about their daily lives. Keep your wits about you and you’ll be able to keep your wealth from getting destroyed. Play it just right and you will make a fortune. The Macro Ops team will be here to help you along the way.
We hope you enjoyed part two of our four-part series on the coming global deflationary deleveraging. Stay on the lookout for part three coming soon!