

I know a number of people who listen to Jim Cramer and make stock market decisions based on his TV show, “Mad Money.” I respect Cramer’s accomplishments as a business person. He earned a law degree from Harvard, worked for Goldman Sachs, founded his own hedge fund, and has turned himself into a tremendously successful brand. My biggest gripe with Cramer is that he gives novice market participants the impression that making money is easy. The best example of the gambling mentality that he instills is a segment on his show called “The Lightning Round” where viewers call in and ask for his opinion on individual stocks. Cramer tries to answer as many questions as possible and gives five second answers on whether to buy or sell a stock such as “Company XYZ is getting killed by Amazon, SELL SELL SELL!!!” I wouldn’t be surprised if people traded more stock simply based on the loudness of his cheerleading. The video below is an example of "The Lightning Round" from 2008.
“Mad Money” gives many market participants the idea that investing in stocks is as simple as applying “If, Then” thinking such as if Sony releases a Virtual Reality headset, it will surely be a blockbuster hit then the stock is bound to go up. This simplistic thinking totally ignores fundamental analysis into a company’s business model, the competitive landscape, industry nuances, the financial statements, etc. I think the average person would be surprised to learn that Sony earns most of its money as a Japanese bank and the video game division only accounts for a small part of operating income.
It’s also my observation that Cramer fans exhibit survivorship bias where they remember his winning recommendations but will give him a pass on stocks that lose money. It does no good to argue with avid supporters. People will believe what they want to believe. That’s why I was excited to see someone put together a study with supporting data.
Cramer’s performance
Economics writer, Jon Hartley, benchmarked Jim Cramer’s “Mad Money” Charitable Trust Performance and published his findings on his website. The results are presented in the graph below.
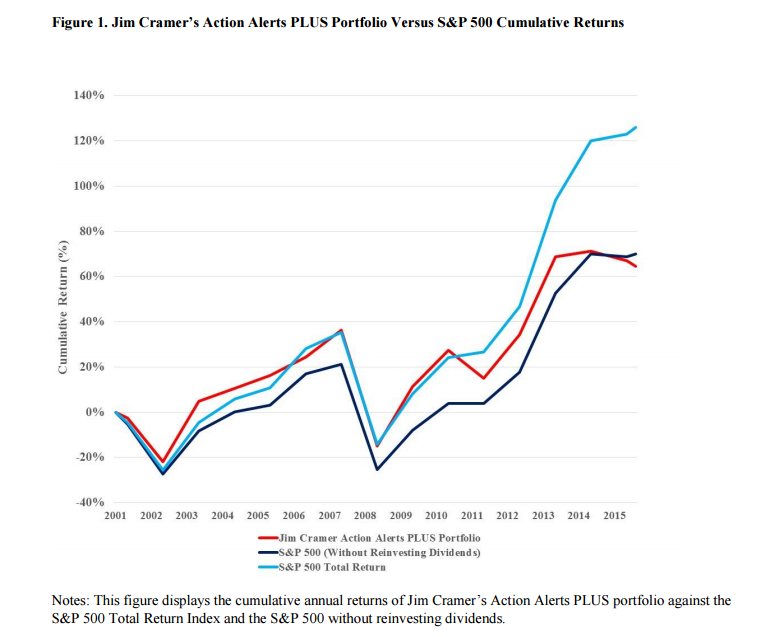
As the graph shows, the S&P 500 Total Return outperformed Cramer’s Action Alerts PLUS portfolio. Dividends are reinvested in the S&P 500 Total Return index. Cramer’s portfolio still underperforms the S&P 500 if dividends were not reinvested. The Action Alerts PLUS portfolio was started in 2001. The portfolio was started on a subscription service from “TheStreet” . Cramer is a co-founder of TheStreet and the Action Alerts Plus portfolio was converted into a charitable trust in 2005. According to the study, the charitable trust donates dividends and other cash distributions. That means for a normalized comparison with the S&P 500 one should compare Cramer’s portfolio with the S&P 500 Total Return up to 2005 and then the S&P 500 index without dividends after 2005.
Other studies have concluded that Cramer outperformed the market. However, those studies only researched specific time periods such as the time leading up to the financial crisis while this study researched the timespan during the Action Alerts PLUS portfolio’s entire existence. You can read the entire report here. Bottomline, there are periods when Cramer’s portfolio has outperformed but at present he has fallen behind. One important point to consider is that the comparisons are between Cramer’s Action Alerts PLUS portfolio and it is not factoring in all of the recommendations that he makes during his TV show.