

The MOTIF structure simply serves as a starting framework to build other mental models and practices. It helps ensure that you’re trading with the larger trends and macro forces currently at work. This is extremely important. As traders, we want as many tailwinds behind our trades as possible.
Let’s go through a recent trade example to see how we identified a trade setup using the four steps below.
Remember: Keep it simple, stupid. To identify the macro environment all you need to do is:
- Use the 200- and 50-day moving averages to determine trend direction.
- Use liquidity gauges to get a sense of the longevity and potential risks to the trend.
- Form your macro directional view (i.e., bull or bear) on the two macro time frames.
- Cut out the noise, don’t overevaluate, trade the trend until the trend and liquidity regime change.
We’ll start with the broader market and then work down to the individual equity level in order to establish the direction of cyclical and intermediate trends.
Below is a chart of the Standard & Poor's 500’s 200- and 50-day moving averages. It shows that both are in a clear uptrend, meaning that on a cyclical and intermediate basis, the trend in U.S. equities is up.

The chart below of small cap moving averages shows the same thing. The trend is up on a cyclical and intermediate basis.

The next step is to look at gauges of liquidity to measure the durability and risks to these trends. Here’s a chart of SPDR Bloomberg Barclays High Yield Bond (JNK, Financial) — the high-yield ETF.
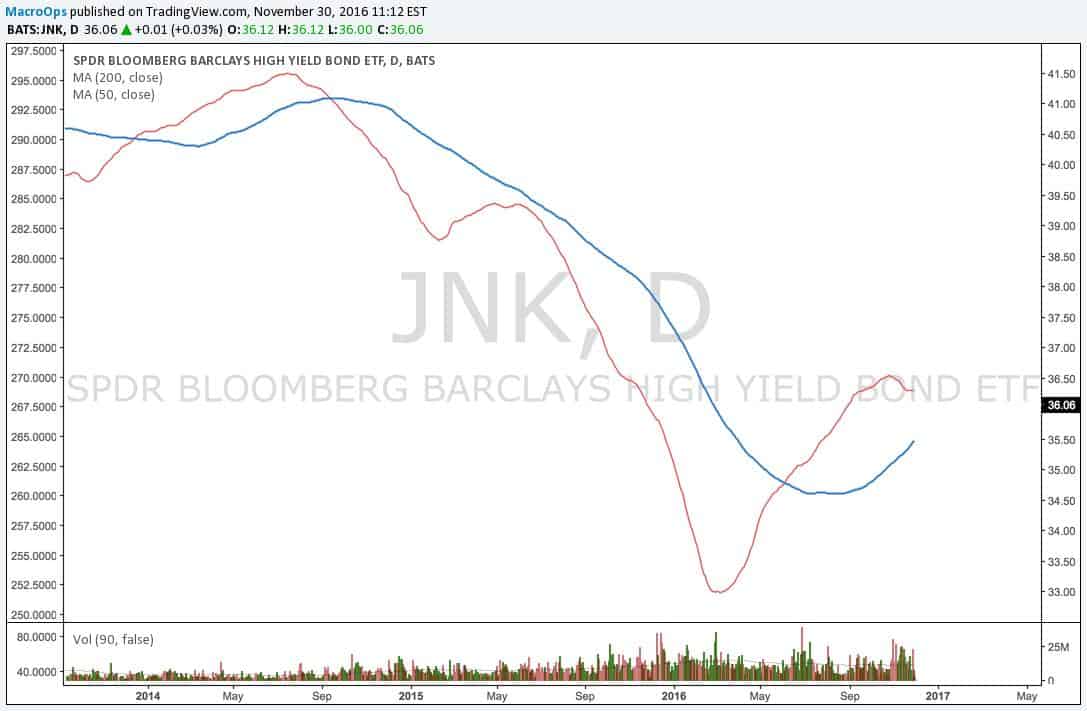
The 200 DMA is pointing up and the 50 DMA is in a broader uptrend even though it’s temporarily stalled. This is something to keep an eye on, but overall liquidity is positive for equities.
We can also take a look at the Hub’s proprietary liquidity gauge which aggregates a host of credit spreads.
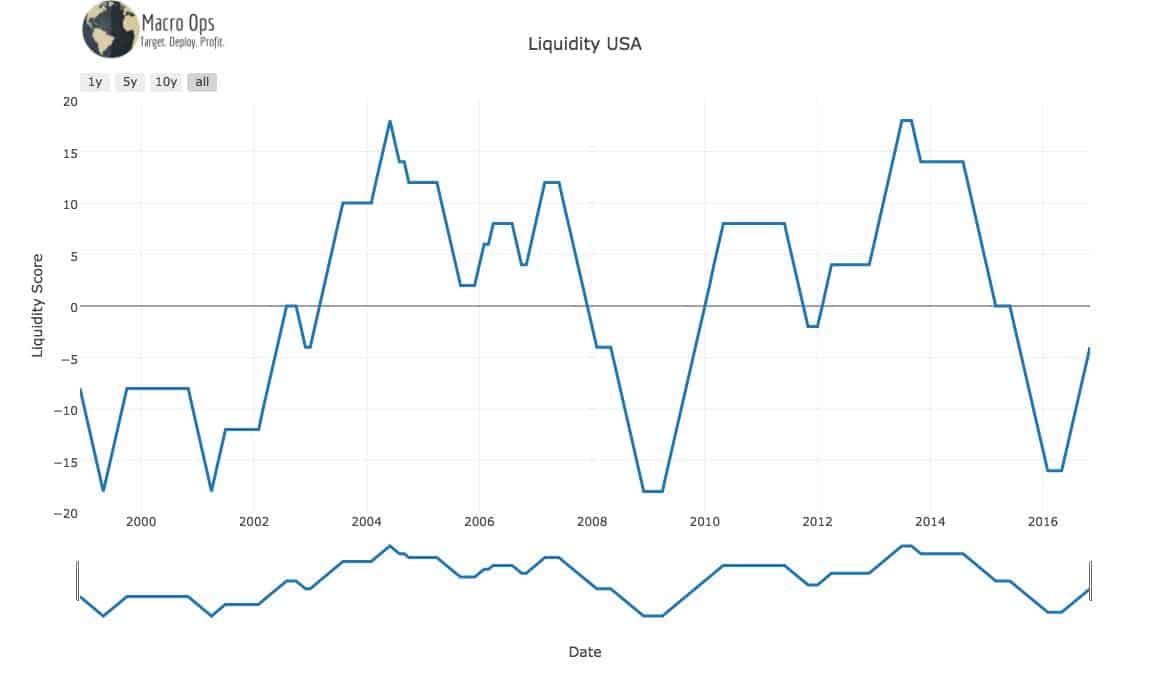
The line on our liquidity model is pointing up – an equity positive.
We can now form our macro viewpoint on U.S. equities:
The cyclical trend is up, as well as the intermediate trend. Liquidity has rebounded after 18 months of tightening and is growing stronger. There’s some intermediate term neutral direction in liquidity, but this looks like it’ll resolve to the upside. This means that the trend in equities has some potential to last with strong bullish moves.
Knowing this, we want to get long stocks. This is where jump into the P&T (price and theme) filters we discuss in the second MOTIF piece.
First we go through some themes. Lately, we’ve become interested in asset-heavy companies due to the growing gap between financial assets and real assets. We’re also interested in beaten-down value plays that have the potential to turn into new growth names. A lot of the older growth names that have led the last few years are extended and a bit tired looking.
Next we run some screens based on this criteria (we’ll share a number of the quant screens we run in an upcoming piece) and sift through their charts.
This leads to a handful of heavy construction companies. The theme here is obvious from the Trump win. We’re moving into a period of greater fiscal spending and infrastructure development. One of the value screens brings up Goldfield Corp. (GV, Financial), and the price action looks great.
The weekly chart shows how price rose at the beginning of the year on a large volume after many years of basing (consensus). We ended up taking a position in the Strategic Portfolio around $3, and it’s now trading at $4.15, a near 40% move in just a few weeks.
Price action provided a great “go or no-go” entry at $3. If the stock fell below $2.50, then the thesis was wrong, or at the very least the timing was off. This allowed entry with a decent position size that we could pyramid on as price moved in our favor, which is exactly what we’ve done.

The company has strong top- and bottom-line growth, a small stock float and a clean balance sheet. It also specializes in construction on the electricity grid. Our electricity grid in the U.S. is extremely outdated and very vulnerable to attack from foreign nations. Revamping the electricity grid is one of Newt Gingrich’s biggest talking points, and he’s a close friend of Trump’s. A $6-plus stock is possible in a few months.
We can do this same type of analysis for equities in any market around the world. Now if we’re looking at currencies or commodities we’ll use a similar framework but some of the inputs (like interest rate differentials and weather patterns) will be different. We’ll be writing future articles on all of this.
Disclosure: The author owns no shares in any stocks mentioned in this article.
Start a free seven-day trial of Premium Membership to GuruFocus.