

Dividend growth investing is a very popular approach that can fit within the ModernGraham methods. We will look at companies that have grown their dividends annually for at least the last 20 years.
For all 900 companies covered by ModernGraham, I track the number of years a company has grown its dividend, and provide that information in my individual company valuations.
Out of the 900 companies, only 70 have grown dividends annually for at least the last 20 years. Here is an overview of those companies:
The Elite
The following companies have been rated as undervalued and suitable for either the Defensive Investor or the Enterprising Investor:
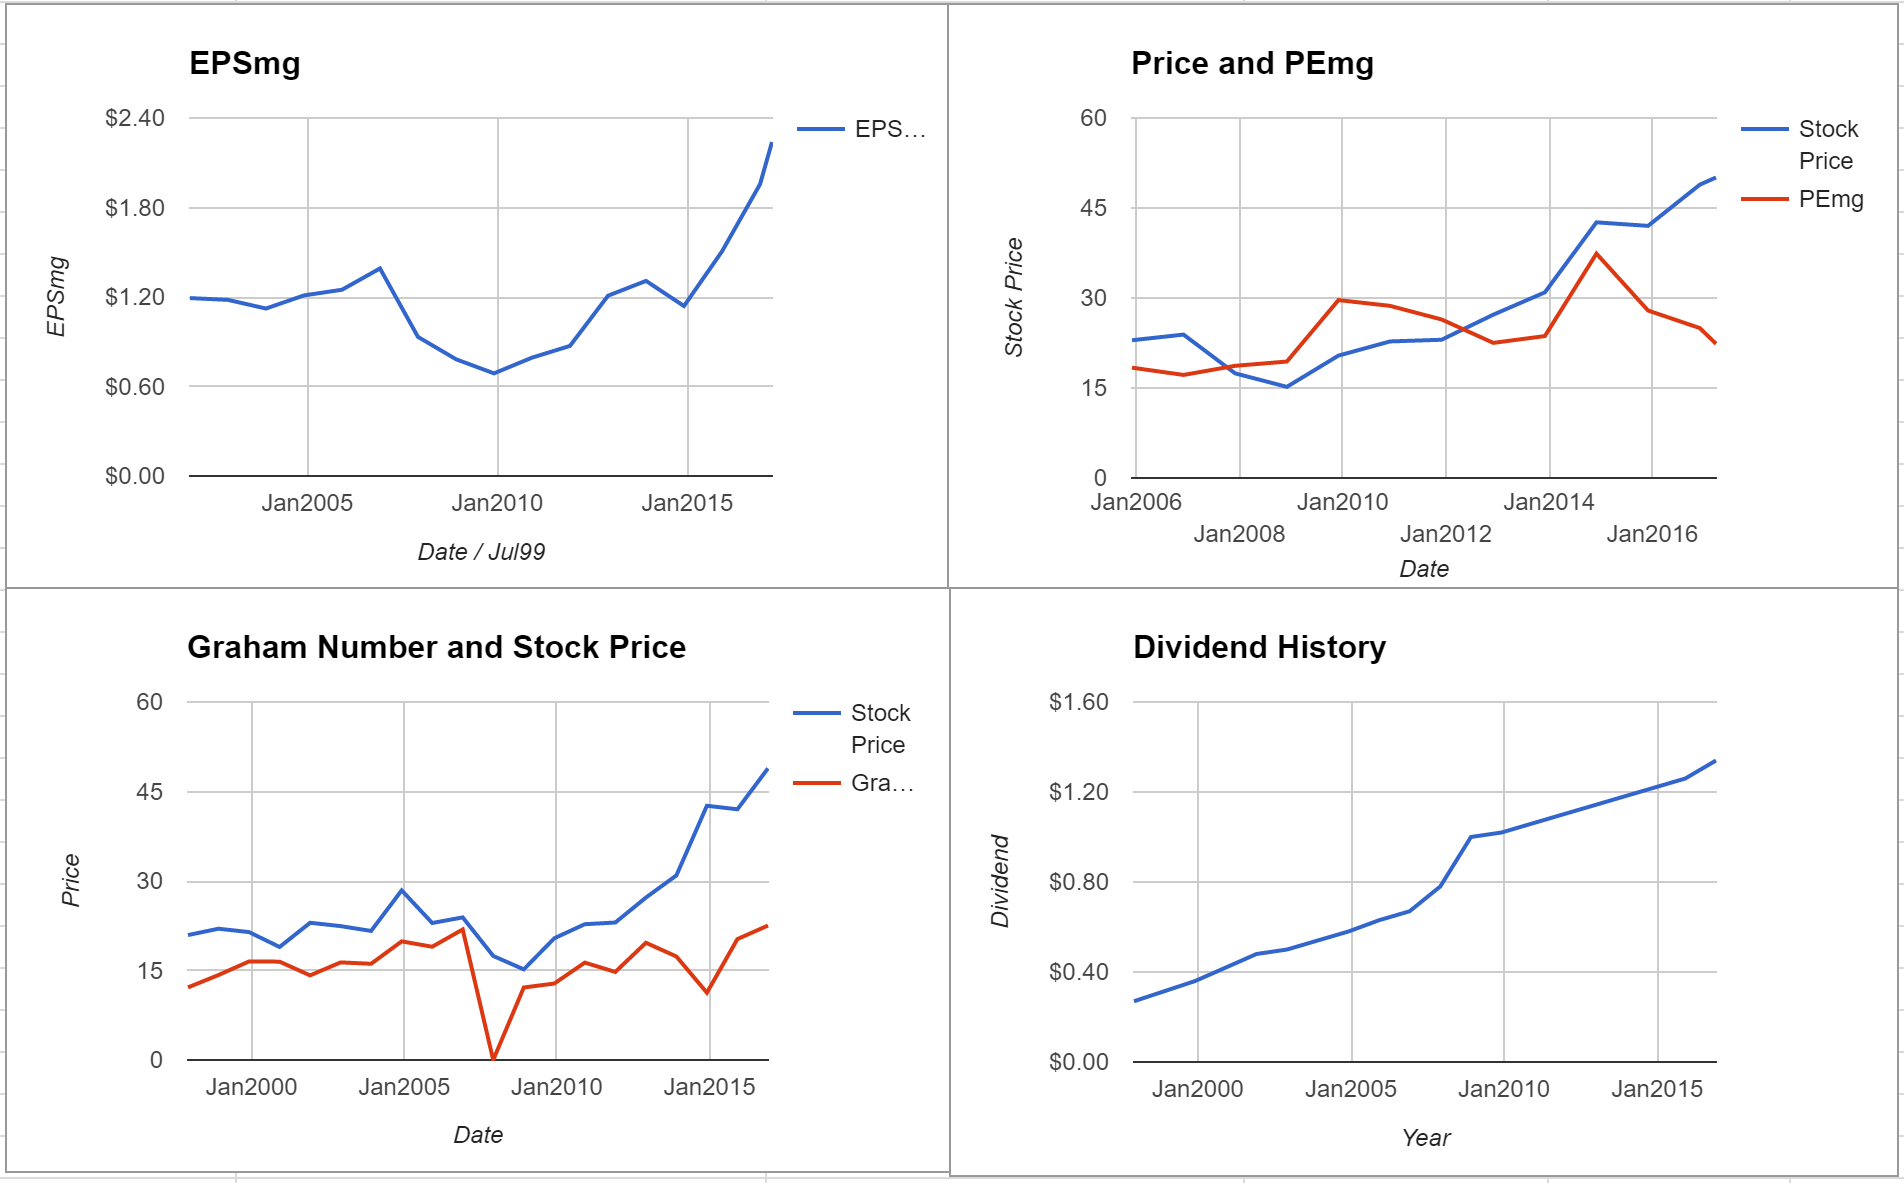
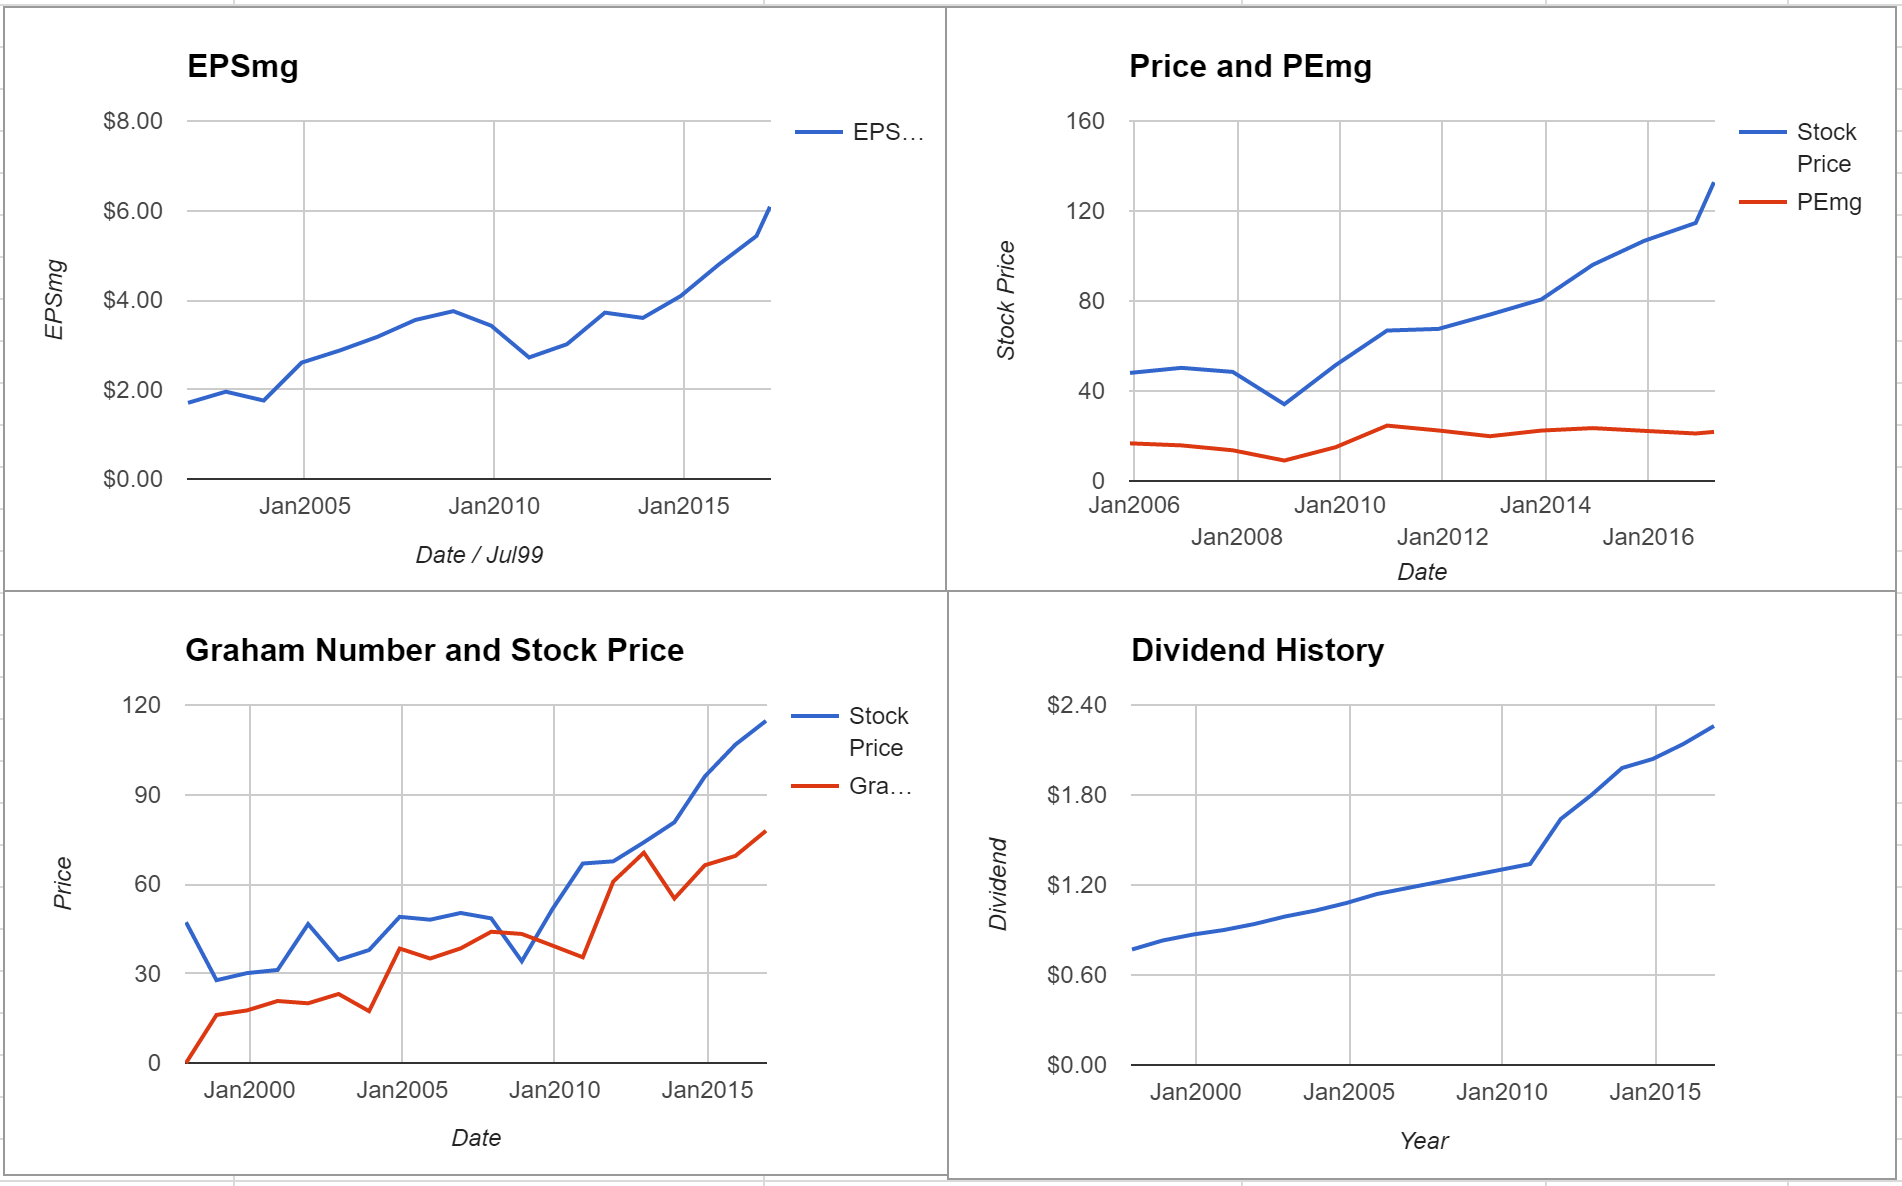
Aflac qualifies for both the Defensive Investor and the Enterprising Investor. In fact, the company meets all of the requirements of both investor types, a rare accomplishment indicative of the company's strong financial position. The Enterprising Investor has no initial concerns. As a result, all value investors should feel comfortable proceeding with the analysis.
As for valuation, the company appears to be undervalued after growing its EPSmg (normalized earnings) from $4.72 in 2012 to an estimated $6.22 for 2016. This level of demonstrated earnings growth outpaces the market's implied estimate of 1.36% annual earnings growth over the next seven to 10 years. As a result, the ModernGraham valuation model, based on Benjamin Graham's formula, returns an estimate of intrinsic value above the price.
At the time of valuation, further research into Aflac revealed the company was trading below its Graham Number of $87.98. The company pays a dividend of $1.64 per share for a yield of 2.3%, putting it among the best dividend-paying stocks today. Its PEmg (price over earnings per share) of 11.22 was below the industry average of 18.78, which by some methods of valuation makes it one of the most undervalued stocks in its industry. (See the full valuation)

W. W. Grainger Inc. (GWW, Financial)
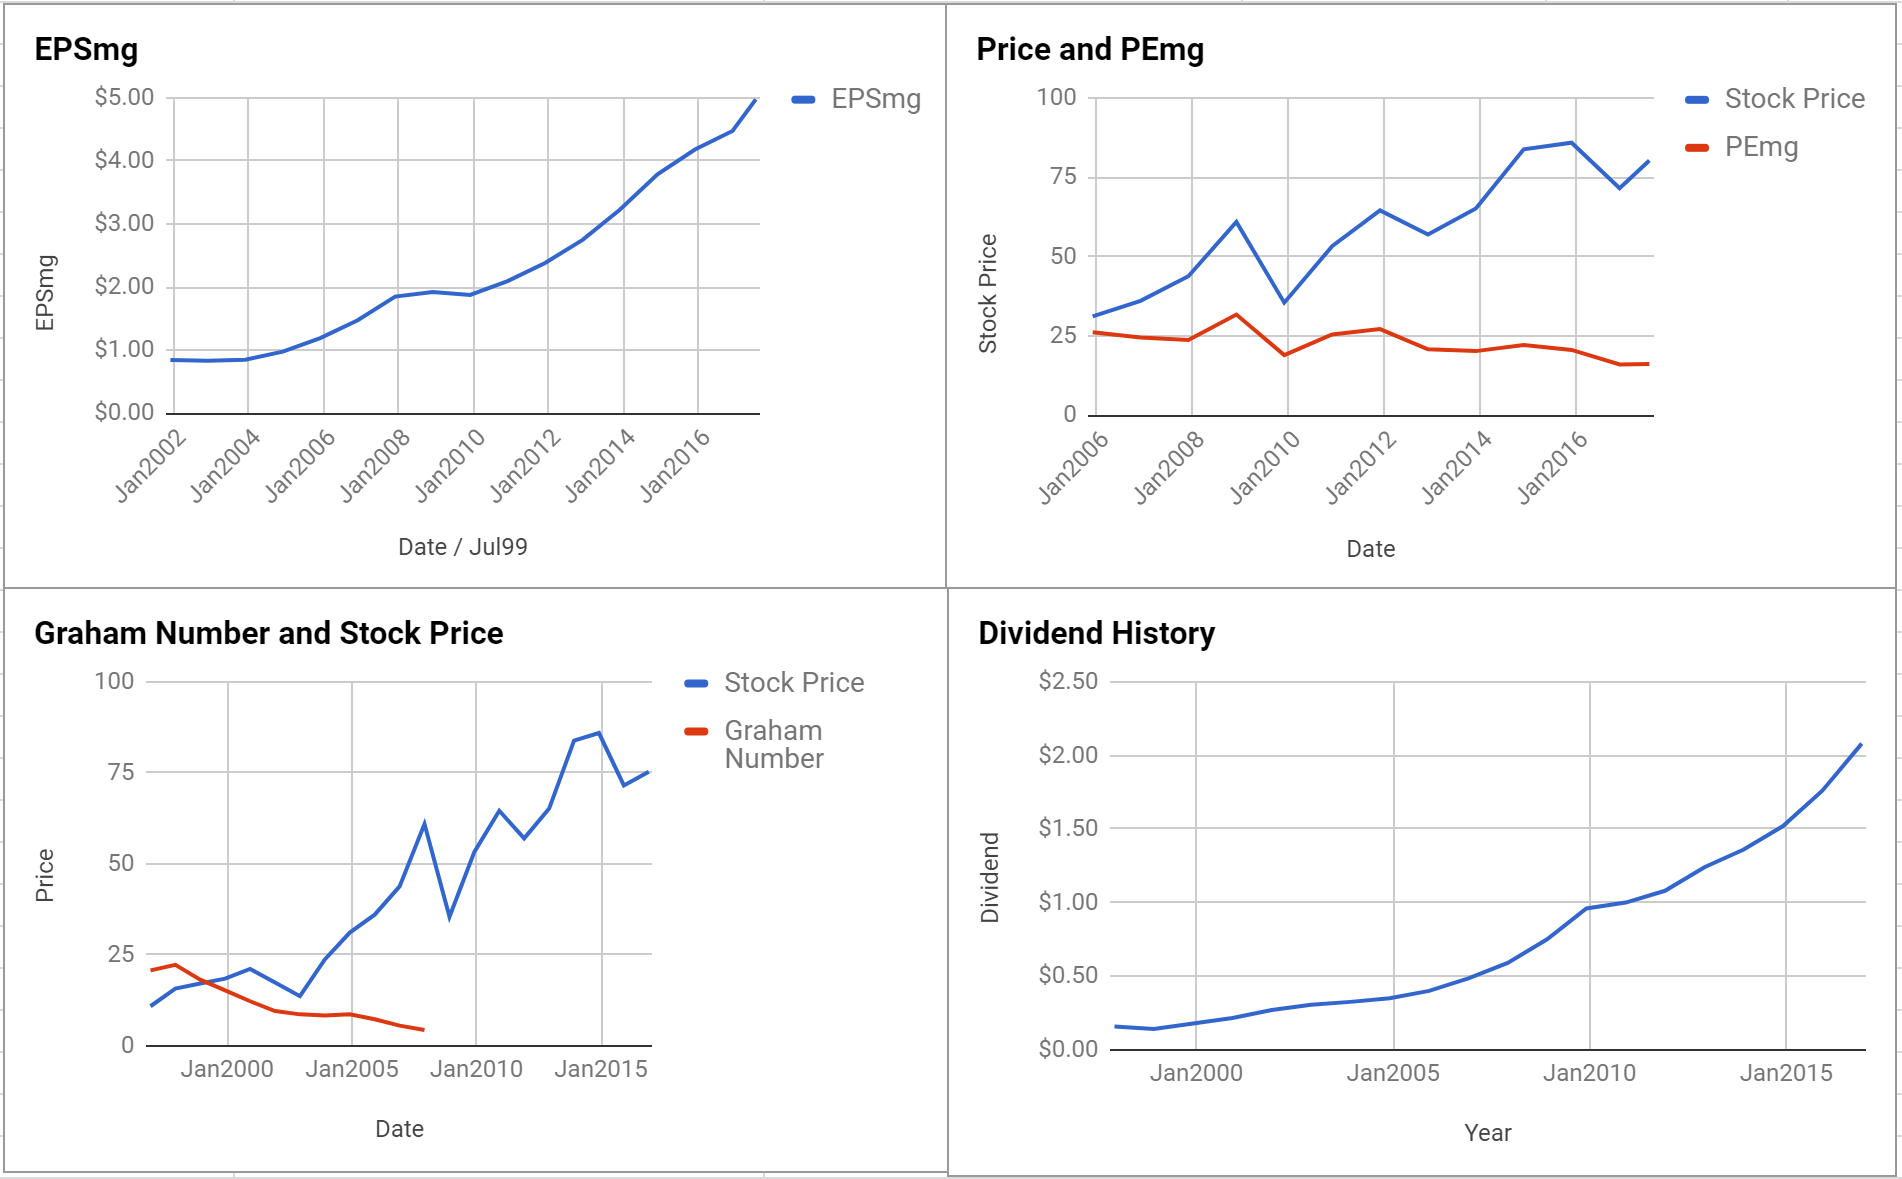
W. W. Grainger is suitable for the Enterprising Investor but not the more conservative Defensive Investor. The Defensive Investor is concerned with the high PEmg and price-book (P/B) ratios. The Enterprising Investor is only concerned with the level of debt relative to the net current assets. As a result, all Enterprising Investors should feel comfortable proceeding with the analysis.
As for valuation, the company appears to be fairly valued after growing its EPSmg from $8.13 in 2012 to an estimated $11.16 for 2016. This level of demonstrated earnings growth supports the market's implied estimate of 6.36% annual earnings growth over the next seven to 10 years. As a result, the valuation model returns an estimate of intrinsic value within a margin of safety relative to the price.
At the time of valuation, further research into W. W. Grainger revealed the company was trading above its Graham Number of $92.08. The company pays a dividend of $4.78 per share for a yield of 2%. Its PEmg of 21.21 was below the industry average of 22.25, which by some methods of valuation makes it one of the most undervalued stocks in its industry. Finally, the company was trading above its net current asset value (NCAV) of $-11.81. (See the full valuation)
Leggett & Platt Inc. (LEG, Financial)
Leggett & Platt is suitable for the Enterprising Investor but not the more conservative Defensive Investor. The Defensive Investor is concerned with the low current ratio and high PEmg and P/B ratios. The Enterprising Investor is only concerned with the level of debt relative to the net current assets. As a result, all Enterprising Investors should feel comfortable proceeding with the analysis.
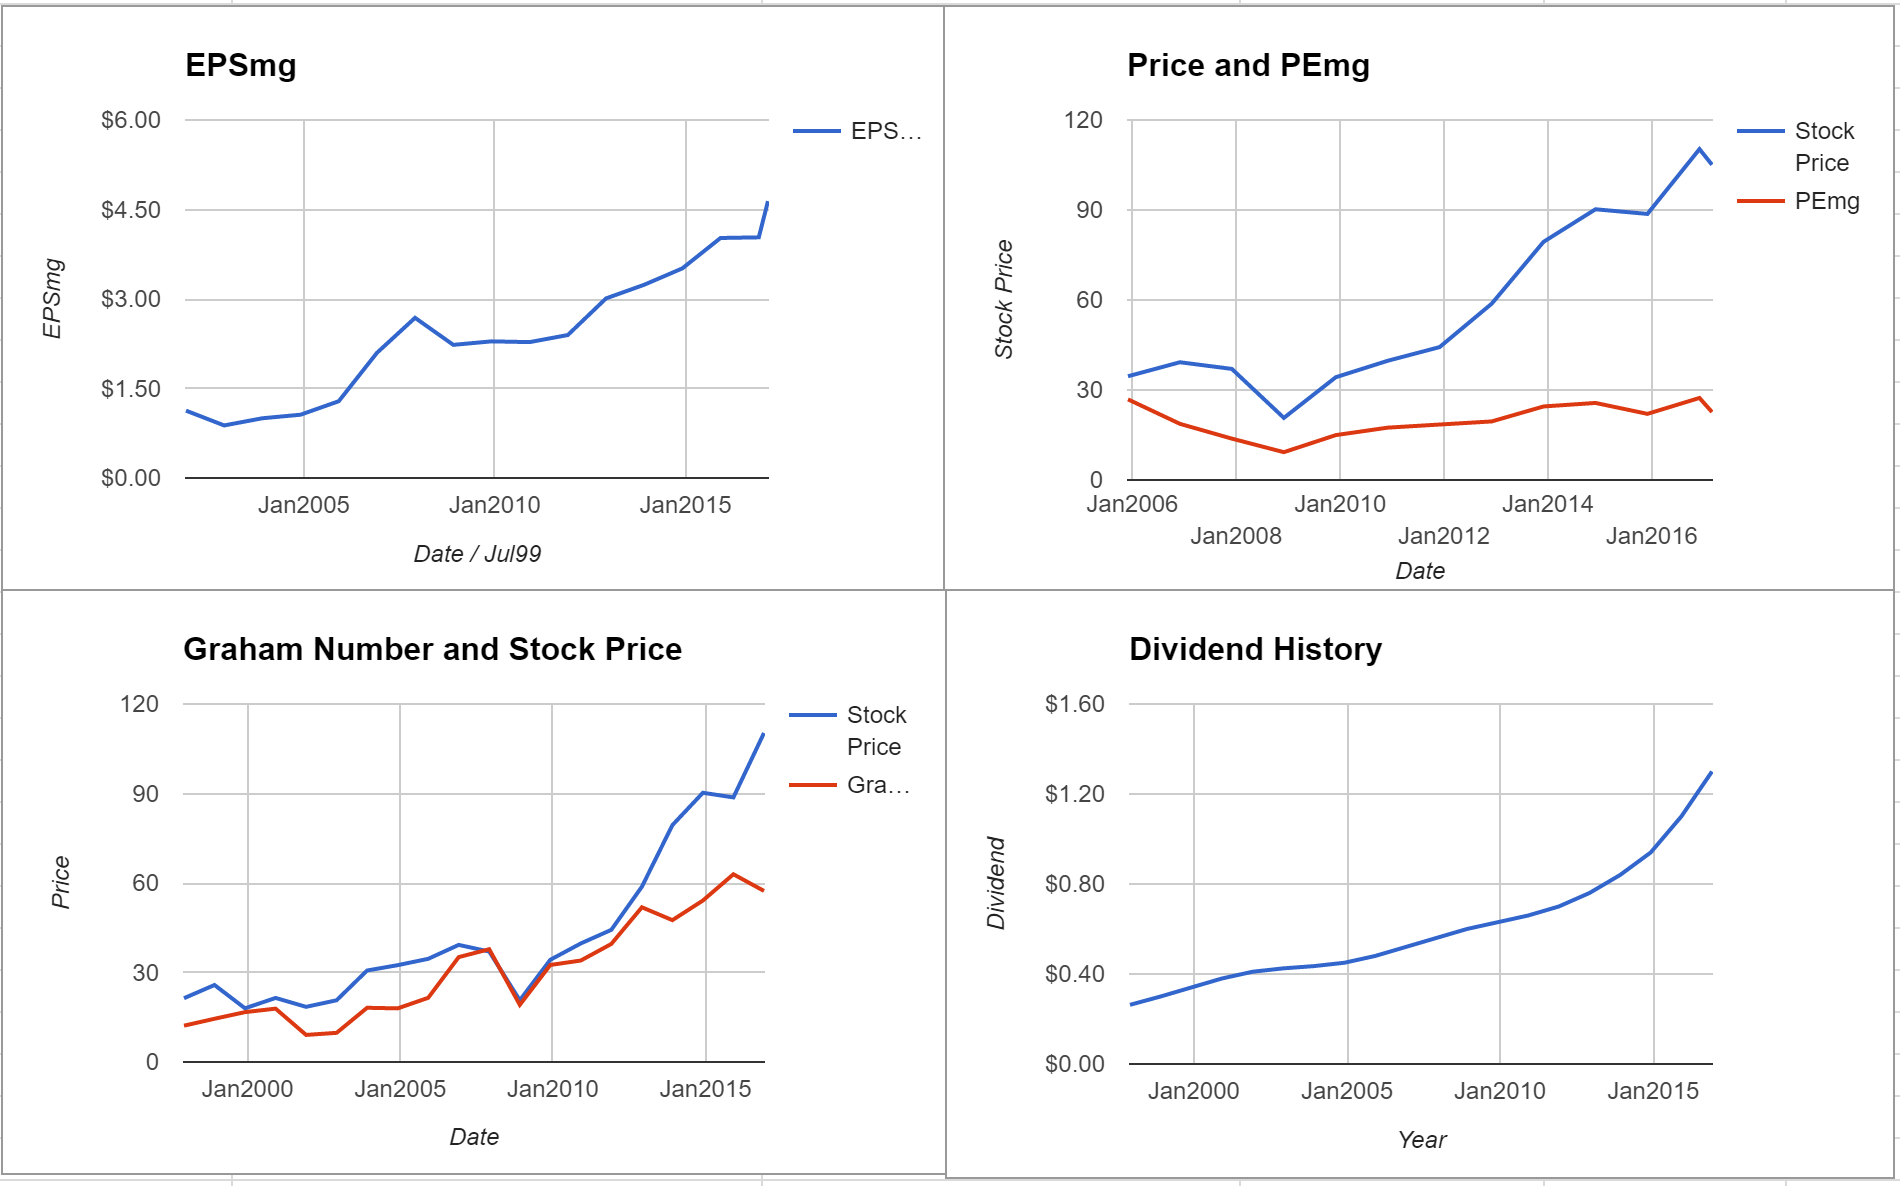
As for valuation, the company appears to be undervalued after growing its EPSmg from $1.31 in 2013 to an estimated $2.24 for 2017. This level of demonstrated earnings growth outpaces the market's implied estimate of 6.94% annual earnings growth over the next seven to 10 years. As a result, the valuation model returns an estimate of intrinsic value above the price.
At the time of valuation, further research into Leggett & Platt revealed the company was trading above its Graham Number of $21.87. The company pays a dividend of $1.34 per share for a yield of 2.7%, putting it among the best dividend-paying stocks today. Its PEmg of 22.37 was below the industry average of 25.38, which by some methods of valuation makes it one of the most undervalued stocks in its industry. Finally, the company was trading above its NCAV of $-4.05. (See the full valuation)
People's United Financial Inc. (PBCT, Financial)
People's United Financial qualifies for both the Defensive Investor and the Enterprising Investor. In fact, the company meets all of the requirements of both investor types, a rare accomplishment indicative of the company's strong financial position. The Enterprising Investor has no initial concerns. As a result, all value investors should feel comfortable proceeding with the analysis.
As for valuation, the company appears to be undervalued after growing its EPSmg from 51 cents in 2012 to an estimated 83 cents for 2016. This level of demonstrated earnings growth outpaces the market's implied estimate of 4.97% annual earnings growth over the next seven to 10 years. As a result, the valuation model returns an estimate of intrinsic value above the price. (See the full valuation)

T. Rowe Price Group Inc. (TROW)
T. Rowe Price qualifies for both the Defensive Investor and the Enterprising Investor. The Defensive Investor is only initially concerned with the high P/B ratio. The Enterprising Investor has no initial concerns. As a result, all value investors should feel comfortable proceeding with the analysis.
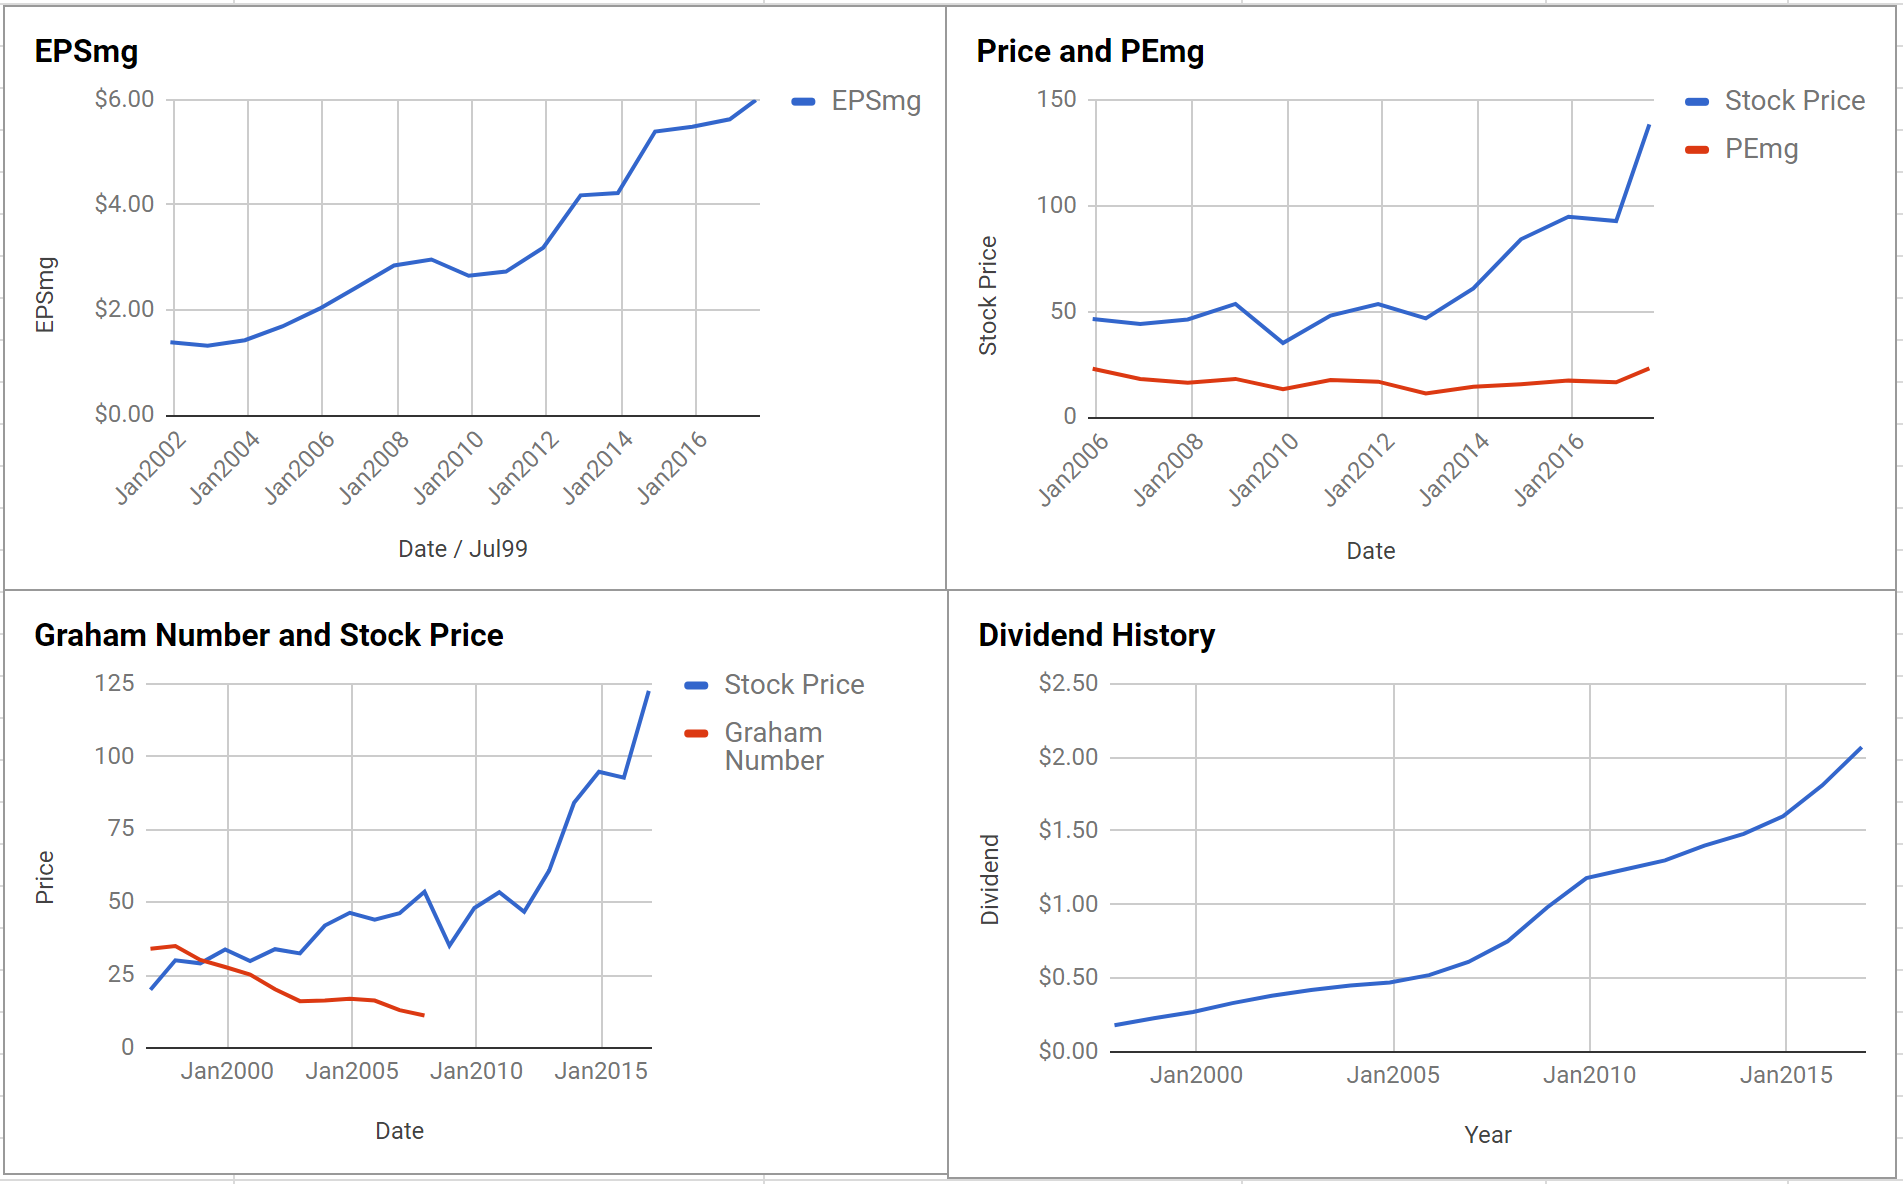
As for valuation, the company appears to be undervalued after growing its EPSmg from $3.23 in 2013 to an estimated $4.97 for 2017. This level of demonstrated earnings growth outpaces the market's implied estimate of 3.82% annual earnings growth over the next seven to 10 years. As a result, the valuation model returns an estimate of intrinsic value above the price.
At the time of valuation, further research into T. Rowe Price revealed the company was trading above its Graham Number of $51.41. The company pays a dividend of $2.16 per share for a yield of 2.7%, putting it among the best dividend-paying stocks today. Its PEmg of 16.13 was below the industry average of 21.55, which by some methods of valuation makes it one of the most undervalued stocks in its industry. Finally, the company was trading above its NCAV of $3.21. (See the full valuation)
United Technologies Corp. (UTX)
United Technologies qualifies for both the Defensive Investor and the Enterprising Investor. The Defensive Investor is only initially concerned with the low current ratio. The Enterprising Investor has concerns regarding the level of debt relative to the current assets. As a result, all value investors should feel comfortable proceeding with the analysis.
As for valuation, the company appears to be undervalued after growing its EPSmg from $5.17 in 2012 to an estimated $7.65 for 2016. This level of demonstrated earnings growth outpaces the market's implied estimate of 2.29% annual earnings growth over the next seven to 10 years. As a result, the valuation model returns an estimate of intrinsic value above the price. (See the full valuation)

The Good
The following companies have been rated as fairly valued and suitable for either the Defensive Investor or the Enterprising Investor:
A. O. Smith Corp. (AOS, Financial)
A. O. Smith is suitable for the Enterprising Investor but not the more conservative Defensive Investor. The Defensive Investor is concerned with the high PEmg and P/B ratios. The Enterprising Investor has no initial concerns. As a result, all Enterprising Investors should feel comfortable proceeding with the analysis.
As for valuation, the company appears to be fairly valued after growing its EPSmg from $1.9 in 2012 to an estimated $2.82 for 2016. This level of demonstrated earnings growth supports the market's implied estimate of 4.47% annual earnings growth over the next seven to 10 years. As a result, the valuation model returns an estimate of intrinsic value below the price. (See the full valuation)
Bemis Company Inc. (BMS, Financial)
Bemis is suitable for the Enterprising Investor but not the more conservative Defensive Investor. The Defensive Investor is concerned with the high PEmg and P/B ratios. The Enterprising Investor is only concerned with the level of debt relative to the net current assets. As a result, all Enterprising Investors should feel comfortable proceeding with the analysis.
As for valuation, the company appears to be overvalued after growing its EPSmg from $1.68 in 2012 to an estimated $2.28 for 2016. This level of demonstrated earnings growth does not support the market's implied estimate of 7.04% annual earnings growth over the next seven to 10 years. As a result, the valuation model returns an estimate of intrinsic value below the price. (See the full valuation)

Cincinnati Financial Corp. (CINF, Financial)
Cincinnati Financial is suitable for the Enterprising Investor but not the more conservative Defensive Investor. The Defensive Investor is concerned with the insufficient earnings growth over the last 10 years and the high PEmg ratio. The Enterprising Investor has no initial concerns. As a result, all Enterprising Investors should feel comfortable proceeding with the analysis.
As for valuation, the company appears to be fairly valued after growing its EPSmg from $2.12 in 2012 to an estimated $3.21 for 2016. This level of demonstrated earnings growth supports the market's implied estimate of 6.36% annual earnings growth over the next seven to 10 years. As a result, the valuation model returns an estimate of intrinsic value within a margin of safety relative to the price. (See the full valuation)
Carlisle Companies Inc. (CSL, Financial)
Carlisle Companies is suitable for the Enterprising Investor but not the more conservative Defensive Investor. The Defensive Investor is concerned with the high PEmg and P/B ratios. The Enterprising Investor has no initial concerns. As a result, all Enterprising Investors should feel comfortable proceeding with the analysis.
As for valuation, the company appears to be fairly valued after growing its EPSmg from $3.24 in 2013 to an estimated $4.64 for 2017. This level of demonstrated earnings growth supports the market's implied estimate of 7.07% annual earnings growth over the next seven to 10 years. As a result, the valuation model returns an estimate of intrinsic value within a margin of safety relative to the price.
At the time of valuation, further research into Carlisle Companies revealed the company was trading above its Graham Number of $70.65. The company pays a dividend of $1.3 per share for a yield of 1.2%. Its PEmg of 22.65 was below the industry average of 27.42, which by some methods of valuation makes it one of the most undervalued stocks in its industry. Finally, the company was trading above its NCAV of $-2.21. (See the full valuation)
Cintas Corp. (CTAS, Financial)
Cintas is suitable for the Enterprising Investor but not the more conservative Defensive Investor. The Defensive Investor is concerned with the low current ratio and high PEmg and P/B ratios. The Enterprising Investor is only concerned with the level of debt relative to the net current assets. As a result, all Enterprising Investors should feel comfortable proceeding with the analysis.
As for valuation, the company appears to be undervalued after growing its EPSmg from $2.07 in 2013 to an estimated $4.36 for 2017. This level of demonstrated earnings growth outpaces the market's implied estimate of 8.06% annual earnings growth over the next seven to 10 years. As a result, the valuation model returns an estimate of intrinsic value above the price. (See the full valuation)

Genuine Parts Co. (GPC, Financial)
Genuine Parts is suitable for the Enterprising Investor but not the more conservative Defensive Investor. The Defensive Investor is concerned with the low current ratio and high PEmg and P/B ratios. The Enterprising Investor is only concerned with the low current ratio. As a result, all Enterprising Investors should feel comfortable proceeding with the analysis.
As for valuation, the company appears to be overvalued after growing its EPSmg  from $3.46 in 2012 to an estimated $4.59 for 2016. This level of demonstrated earnings growth does not support the market's implied estimate of 7.19% annual earnings growth over the next seven to 10 years. As a result, the valuation model returns an estimate of intrinsic value below the price. (See the full valuation)
Hormel Foods Corp. (HRL, Financial)
Hormel is suitable for the Enterprising Investor but not the more conservative Defensive Investor. The Defensive Investor is concerned with the high PEmg and P/B ratios. The Enterprising Investor has no initial concerns. As a result, all Enterprising Investors should feel comfortable proceeding with the analysis.
As for valuation, the company appears to be fairly valued after growing its EPSmg from 89 cents in 2013 to an estimated $1.46 for 2017. This level of demonstrated earnings growth supports the market's implied estimate of 7.65% annual earnings growth over the next seven to 10 years. As a result, the valuation model returns an estimate of intrinsic value within a margin of safety relative to the price.
At the time of valuation, further research into Hormel revealed the company was trading above its Graham Number of $17.73. The company pays a dividend of 61 cents per share for a yield of 1.7%. Its PEmg of 23.8 was below the industry average of 24.74, which by some methods of valuation makes it one of the most undervalued stocks in its industry. Finally, the company was trading above its NCAV of 61 cents. (See the full valuation)

Illinois Tool Works Inc. (ITW, Financial)
Illinois Tool Works is suitable for the Enterprising Investor but not the more conservative Defensive Investor. The Defensive Investor is concerned with the high PEmg and P/B ratios. The Enterprising Investor is only concerned with the level of debt relative to the net current assets. As a result, all Enterprising Investors should feel comfortable proceeding with the analysis.
As for valuation, the company appears to be fairly valued after growing its EPSmg from $4.23 in 2013 to an estimated $5.99 for 2017. This level of demonstrated earnings growth supports the market's implied estimate of 7.29% annual earnings growth over the next seven to 10 years. As a result, the valuation model returns an estimate of intrinsic value within a margin of safety relative to the price.
At the time of valuation, further research into Illinois Tool Works revealed the company was trading above its Graham Number of $42.93. The company pays a dividend of $2.4 per share for a yield of 1.7%. Its PEmg of 23.09 was below the industry average of 26.48, which by some methods of valuation makes it one of the most undervalued stocks in its industry. Finally, the company was trading above its NCAV of $-13.18. (See the full valuation)
Ross Stores Inc. (ROST)
Ross Stores is suitable for the Enterprising Investor but not the more conservative Defensive Investor. The Defensive Investor is concerned with the low current ratio and high PEmg and P/B ratios. The Enterprising Investor has no initial concerns. As a result, all Enterprising Investors should feel comfortable proceeding with the analysis.
As for valuation, the company appears to be fairly valued after growing its EPSmg from $1.36 in 2013 to an estimated $2.35 for 2017. This level of demonstrated earnings growth supports the market's implied estimate of 7.44% annual earnings growth over the next seven to 10 years. As a result, the valuation model returns an estimate of intrinsic value within a margin of safety relative to the price. (See the full valuation)

Stanley Black & Decker Inc. (SWK)
Stanley Black & Decker is suitable for the Enterprising Investor but not the more conservative Defensive Investor. The Defensive Investor is concerned with the low current ratio and high PEmg and P/B ratios. The Enterprising Investor is only concerned with the level of debt relative to the net current assets. As a result, all Enterprising Investors should feel comfortable proceeding with the analysis.
As for valuation, the company appears to be undervalued after growing its EPSmg from $3.6 in 2013 to an estimated $6.08 for 2017. This level of demonstrated earnings growth outpaces the market's implied estimate of 6.66% annual earnings growth over the next seven to 10 years. As a result, the valuation model returns an estimate of intrinsic value above the price.
At the time of valuation, further research into Stanley Black & Decker revealed the company was trading above its Graham Number of $81. The company pays a dividend of $2.26 per share for a yield of 1.7%. Its PEmg of 21.83 was below the industry average of 24.17, which by some methods of valuation makes it one of the most undervalued stocks in its industry. Finally, the company was trading above its NCAV of $-30.22. (See the full valuation)
VF Corp. (VFC)
VF Corp. is suitable for the Enterprising Investor but not the more conservative Defensive Investor. The Defensive Investor is concerned with the low current ratio and high PEmg and P/B ratios. The Enterprising Investor has no initial concerns. As a result, all Enterprising Investors should feel comfortable proceeding with the analysis.
As for valuation, the company appears to be fairly valued after growing its EPSmg from $1.83 in 2012 to an estimated $2.72 for 2016. This level of demonstrated earnings growth supports the market's implied estimate of 7.2% annual earnings growth over the next seven to 10 years. As a result, the valuation model returns an estimate of intrinsic value within a margin of safety relative to the price. (See the full valuation)
The full list
To view the MG Value and PEmg information, you must be logged in as a premium member. Clicking on the company name will take you to its latest valuation.
For the investor type, a "D" indicates the company is suitable for the Defensive Investor, an "E" indicates the company is suitable for the Enterprising Investor and an "S" indicates the company is considered speculative at this time.
| Ticker | Name with Link | Investor Type | Latest Valuation Date | MG Value | Recent Price | Price as a percent of Value | PEmg Ratio | Div. Yield |
| ADM | Archer Daniels Midland Co. | E | Jan. 3 | --- | $41.56 | --- | --- | 2.84% |
| ADP | Automatic Data Processing | E | Nov. 20, 2016 | --- | $102.89 | --- | --- | 2.06% |
| AFL | Aflac Inc. | D | Dec. 19, 2016 | --- | $79.71 | --- | --- | 2.06% |
| ALB | Albemarle Corp. | E | March 18 | --- | $113.48 | --- | --- | 1.08% |
| AOS | A. O. Smith Corp. | E | June 11, 2016 | --- | $53.75 | --- | --- | 1.51% |
| APD | Air Products & Chemicals Inc. | S | Jan. 27 | --- | $145.15 | --- | --- | 2.34% |
| BCR | C. R. Bard Inc. | E | March 21 | --- | $319.42 | --- | --- | 0.31% |
| BDX | Becton Dickinson and Co. | S | Jan. 8 | --- | $199.17 | --- | --- | 1.33% |
| BEN | Franklin Resources Inc. | D | Feb. 24 | --- | $41.77 | --- | --- | 1.77% |
| BF.B | Brown-Forman Corp. | S | Feb. 2 | --- | $50.90 | --- | --- | 1.34% |
| BMS | Bemis Company Inc. | E | July 1, 2016 | --- | $41.68 | --- | --- | 2.71% |
| CAH | Cardinal Health Inc. | S | July 3, 2016 | --- | $64.36 | --- | --- | 2.41% |
| CFR | Cullen/Frost Bankers Inc. | E | Dec. 8, 2016 | --- | $85.00 | --- | --- | 2.52% |
| CHRW | C.H. Robinson Worldwide Inc. | S | Aug. 29, 2016 | --- | $66.86 | --- | --- | 2.50% |
| CINF | Cincinnati Financial Corp. | E | May 21, 2016 | --- | $76.98 | --- | --- | 2.42% |
| CL | Colgate-Palmolive Co. | S | April 8 | --- | $71.61 | --- | --- | 2.16% |
| CLX | Clorox Co. | S | Jan. 28 | --- | $138.83 | --- | --- | 2.24% |
| CSL | Carlisle Companies Inc. | E | Feb. 27 | --- | $92.40 | --- | --- | 1.41% |
| CTAS | Cintas Corp. | E | July 21, 2016 | --- | $133.87 | --- | --- | 0.78% |
| CVX | Chevron Corp. | S | March 15 | --- | $105.78 | --- | --- | 4.06% |
| CWT | California Water Service Group | S | March 26 | --- | $36.90 | --- | --- | 1.87% |
| DCI | Donaldson Company Inc. | E | July 17 | --- | $46.63 | --- | --- | 1.48% |
| DOV | Dover Corp | D | July 8, 2016 | --- | $83.70 | --- | --- | 1.98% |
| ECL | Ecolab Inc. | S | June 26, 2016 | --- | $130.40 | --- | --- | 1.04% |
| ED | Consolidated Edison Inc. | S | Feb. 26 | --- | $83.75 | --- | --- | 3.20% |
| EMR | Emerson Electric Co. | S | Feb. 12, 2016 | --- | $58.00 | --- | --- | 3.26% |
| EPD | Enterprise Products Partners L.P. | S | Aug. 27, 2016 | --- | $24.98 | --- | --- | 6.20% |
| ESS | Essex Property Trust Inc. | S | March 14 | --- | $264.20 | --- | --- | 2.42% |
| EXPD | Expeditors International of Washington | E | June 25, 2016 | --- | $54.98 | --- | --- | 1.31% |
| GPC | Genuine Parts Co. | E | July 8, 2016 | --- | $82.67 | --- | --- | 3.02% |
| GWW | W. W. Grainger Inc. | E | Jan. 12 | --- | $158.41 | --- | --- | 3.02% |
| HP | Helmerich & Payne Inc. | S | June 23, 2016 | --- | $43.25 | --- | --- | 6.36% |
| HRL | Hormel Foods Corp. | E | March 9 | --- | $33.93 | --- | --- | 1.80% |
| IBM | International Business Machines Corp. | S | March 13 | --- | $140.33 | --- | --- | 3.92% |
| ITW | Illinois Tool Works Inc. | E | Aug. 13 | --- | $135.60 | --- | --- | 1.77% |
| JKHY | Jack Henry & Associates Inc. | S | Jan. 30 | --- | $99.30 | --- | --- | 1.10% |
| JNJ | Johnson & Johnson | E | Jan. 16 | --- | $133.45 | --- | --- | 2.32% |
| KMB | Kimberly Clark Corp. | S | June 24, 2016 | --- | $122.68 | --- | --- | 2.90% |
| KO | The Coca-Cola Co. | S | July 28, 2016 | --- | $45.68 | --- | --- | 2.93% |
| LECO | Lincoln Electric Holdings Inc. | E | March 8 | --- | $85.16 | --- | --- | 1.54% |
| LEG | Leggett & Platt Inc. | E | March 26 | --- | $46.19 | --- | --- | 2.90% |
| LLTC | Linear Technology Corp. | E | July 12, 2016 | --- | $65.00 | --- | --- | 1.88% |
| LOW | Lowe's Companies Inc. | S | March 26 | --- | $73.85 | --- | --- | 1.80% |
| MCD | McDonald's Corp. | S | Nov. 20, 2016 | --- | $158.36 | --- | --- | 2.25% |
| MDT | Medtronic PLC | D | July 12, 2016 | --- | $83.52 | --- | --- | 1.82% |
| MKC | McCormick & Company Inc. | S | Jan. 3 | --- | $96.23 | --- | --- | 1.76% |
| MMM | 3M Co. | E | Dec. 13, 2016 | --- | $204.55 | --- | --- | 2.13% |
| NEE | NextEra Energy Inc. | S | Dec. 21, 2016 | --- | $150.45 | --- | --- | 2.25% |
| NNN | National Retail Properties Inc. | S | Dec. 4, 2016 | --- | $41.19 | --- | --- | 4.27% |
| PBCT | People's United Financial Inc. | D | June 20, 2016 | --- | $16.58 | --- | --- | 4.04% |
| PEP | PepsiCo Inc. | S | July 13, 2016 | --- | $118.26 | --- | --- | 2.42% |
| PG | Procter & Gamble Co. | S | July 8, 2016 | --- | $92.86 | --- | --- | 2.85% |
| PH | Parker-Hannifin Corp. | D | July 15, 2016 | --- | $155.15 | --- | --- | 1.62% |
| PPG | PPG Industries Inc. | S | Jan. 16 | --- | $102.39 | --- | --- | 1.48% |
| PX | Praxair Inc. | S | Aug. 21 | --- | $131.21 | --- | --- | 2.29% |
| ROST | Ross Stores Inc. | E | June 21, 2016 | --- | $58.56 | --- | --- | 0.80% |
| SHW | Sherwin-Williams Co. | S | July 12, 2016 | --- | $329.62 | --- | --- | 0.86% |
| SKT | Tanger Factory Outlet Centers Inc. | S | Jan. 16 | --- | $24.10 | --- | --- | 5.06% |
| SON | Sonoco Products Co. | E | Feb. 6 | --- | $47.62 | --- | --- | 3.02% |
| SPGI | S&P Global Inc | S | Feb. 8 | --- | $149.99 | --- | --- | 0.94% |
| SWK | Stanley Black & Decker Inc. | E | April 10 | --- | $137.07 | --- | --- | 1.65% |
| SYY | SYSCO Corp. | S | Jan. 25 | --- | $51.17 | --- | --- | 2.42% |
| TDS | Telephone & Data Systems Inc. | S | April 12 | --- | $28.54 | --- | --- | 2.07% |
| TGT | Target Corp. | S | March 7 | --- | $56.56 | --- | --- | 4.10% |
| TROW | T. Rowe Price Group Inc. | D | July 16 | --- | $82.37 | --- | --- | 2.62% |
| TSE:CNR | Canadian National Railway Co. | S | Jan. 30 | --- | $99.91 | --- | --- | 1.50% |
| UTX | United Technologies Corp. | D | May 18, 2016 | --- | $115.28 | --- | --- | 2.22% |
| VFC | VF Corp. | E | Aug. 1, 2016 | --- | $62.95 | --- | --- | 2.27% |
| WBA | Walgreens Boots Alliance Inc. | S | July 6, 2016 | --- | $80.60 | --- | --- | 1.76% |
| WMT | Wal-Mart Stores Inc. | S | May 20, 2016 | --- | $79.71 | --- | --- | 2.46% |
Disclosure:Â The author held a long position in Dover Corp. and People's United Financial Inc., but did not hold a position in any other company mentioned in this article at the time of publication and had no intention of changing that position within the next 72 hours. See my current holdings here. This article is not investment advice and all readers are encouraged to speak to a registered investment adviser prior to making any investing decisions. Please also read our full disclaimer. This article first appeared on ModernGraham.