
This week we look at the US trade balance trending back to normal, US CPI/inflation figures tending sideways, a pick up in US retail sales, further improvement in US industrial production, and a slight tapering off of US consumer sentiment. So the focus is completely on the US this week which is fitting given our update on the Chinese economy a few days ago following their big economic data release. So this week you've got the top 5 graphs for the 2 biggest economies.
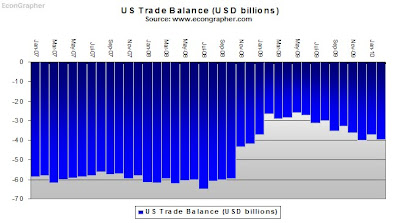
1. US Trade Balance - trending back to normal
The US trade balance figure came in at -$39.7 billion for February, slightly worse than consensus of -$39 billion, and worse than January's -$37.3 billion; and much worse than -$27 billion in Feb 2009. However, as bad as it is to have these imbalances, and as much as the US needs to really turn this around for a more sustainable recovery, this is actually somewhat of a positive figure. Though much of the increase was related to oil imports, there was also increase the non-oil aspects, so that reflects an improvement in demand (though likely still related to inventory cycle). This one will be interesting to watch if the Chinese change the yuan policy - will it get worse? or will spending react? The answer to both is probably yes - but with different timing.
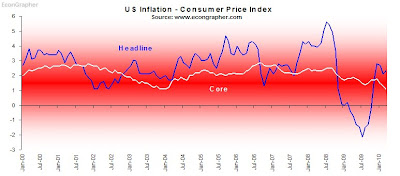
2. US Consumer Price Index - inflation taking a breather
The CPI index grew 2.3% y/y, sending headline inflation basically sideways; while core inflation fell further to 1.1%. How to read this part of the cycle is that things are basically taking a breather. My take is that this is a short period of consolidation before an eventual picking up in inflationary forces. There are a few leading indicators pointing to an increase in inflation, and stimulatory conditions from monetary and fiscal policy - compared with potentially redundant capacity will eventually see this picking up again. The yuan policy again will be a wild card for this - a significant increase might even see price inflation driven up by higher import costs.
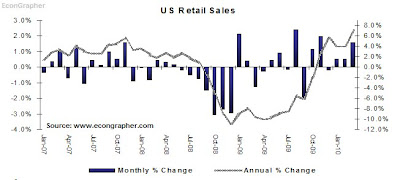
3. US Retail Sales - growing good, but...
US retail sales grew 1.6% month on month in March; greater than the expected 1.2% and previous 0.5% growth; placing it up 7.1% year over year. Stripping out Autos it was up 0.6% vs expected 0.5% and previous 0.8%. The key message is that there is some strength going on in US consumer spending at the moment. And though on absolute terms retail sales are still below trend, they are making some progress towards a return to trend. What this says in some sense is that there seems to be evidence of a cyclical recovery coming through - it's not necessarily a good thing to see US consumer spending picking up; because the US consumer on average doesn't save enough. If this trend continues then it will just be a back to normal recovery; leaving the same vulnerabilities in place.
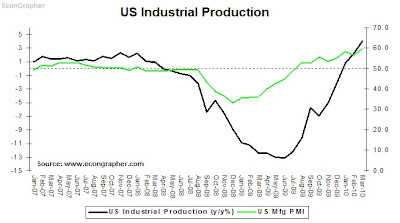
4. US Industrial Production - manufacturing expands
Unsurprisingly US industrial production further expanded in March. On a month over month basis it crept up only 0.1% (consensus was for 0.8%), vs Feb 0.1%. However year over year it picked up to 4% (-12.5% in 2009) from 2.2% in Feb. So there is some comparison bias in the yearly figures, but the strengthening does line up with other things, for example in the chart below ISM manufacturing PMI is overlayed and both indicators are consistent with expansion in US manufacturing (what's left of it). Much of this will be related to inventory building, but some may be related to increased consumer spending and export demand (e.g. China).
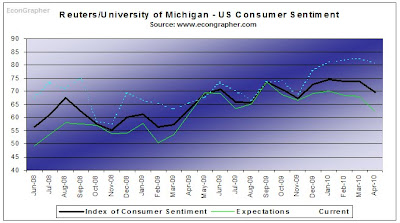
5. Reuters/University of Michigan US Consumer Sentiment - tapering off
Consumer sentiment came in at 69.5 well off consensus 75 and previous 73.6, but unremarkably up from 63 in April last year. Granted this is only the mid-month update, it does send some warning signs; especially for those who may be expecting a big rise in April payrolls (maybe unlikely given indications from this). The biggest drop was from expectations (62.3 vs Mar 67.9), but current conditions also fell (80.7 vs 82.4). Even eyeballing the chart below shows a trend of tapering off after a period of recovery. The main message is that the recovery is there, but it's not strong and there are risks, and of course - as we see now in consumer sentiment; it may be quite stop-start in nature.
Summary
So where does this leave us? Let's re-cap: there's a worsening trade balance which is mostly due to oil but reflects a little increase in demand; there's inflation basically going sideways or consolidating but with risks to the upside; there's consumer spending showing a marked pick-up but how strong remains to be seen; industrial production is improving but probably still mostly due to inventory building but maybe some iota of fundamental strength; and consumer sentiment is tapering off a bit showing people are still perhaps a little confused about where things are going.
These messages are all pretty much consistent with a fragile and artificially stimulated recovery that most agree is underway. There is a pretty high probability that the recovery wont be structural, rather it will be cyclical (back to normal). Inflation will eventually pick up again, and consumers will go back to their old habits. So in the end, as noted, there are positive signs, but are they really all that positive?
Sources:
Econ Grapher Analytics www.econgrapher.com
Trading Economics www.tradingeconomics.com
US Bureau of Labour Statistics www.bls.gov
Reuters/Univesity of Michigan customers.reuters.com
US Census Department www.census.gov
Article Source: http://www.econgrapher.com/top5graphs17apr.html
1. US Trade Balance - trending back to normal
The US trade balance figure came in at -$39.7 billion for February, slightly worse than consensus of -$39 billion, and worse than January's -$37.3 billion; and much worse than -$27 billion in Feb 2009. However, as bad as it is to have these imbalances, and as much as the US needs to really turn this around for a more sustainable recovery, this is actually somewhat of a positive figure. Though much of the increase was related to oil imports, there was also increase the non-oil aspects, so that reflects an improvement in demand (though likely still related to inventory cycle). This one will be interesting to watch if the Chinese change the yuan policy - will it get worse? or will spending react? The answer to both is probably yes - but with different timing.

2. US Consumer Price Index - inflation taking a breather
The CPI index grew 2.3% y/y, sending headline inflation basically sideways; while core inflation fell further to 1.1%. How to read this part of the cycle is that things are basically taking a breather. My take is that this is a short period of consolidation before an eventual picking up in inflationary forces. There are a few leading indicators pointing to an increase in inflation, and stimulatory conditions from monetary and fiscal policy - compared with potentially redundant capacity will eventually see this picking up again. The yuan policy again will be a wild card for this - a significant increase might even see price inflation driven up by higher import costs.

3. US Retail Sales - growing good, but...
US retail sales grew 1.6% month on month in March; greater than the expected 1.2% and previous 0.5% growth; placing it up 7.1% year over year. Stripping out Autos it was up 0.6% vs expected 0.5% and previous 0.8%. The key message is that there is some strength going on in US consumer spending at the moment. And though on absolute terms retail sales are still below trend, they are making some progress towards a return to trend. What this says in some sense is that there seems to be evidence of a cyclical recovery coming through - it's not necessarily a good thing to see US consumer spending picking up; because the US consumer on average doesn't save enough. If this trend continues then it will just be a back to normal recovery; leaving the same vulnerabilities in place.

4. US Industrial Production - manufacturing expands
Unsurprisingly US industrial production further expanded in March. On a month over month basis it crept up only 0.1% (consensus was for 0.8%), vs Feb 0.1%. However year over year it picked up to 4% (-12.5% in 2009) from 2.2% in Feb. So there is some comparison bias in the yearly figures, but the strengthening does line up with other things, for example in the chart below ISM manufacturing PMI is overlayed and both indicators are consistent with expansion in US manufacturing (what's left of it). Much of this will be related to inventory building, but some may be related to increased consumer spending and export demand (e.g. China).

5. Reuters/University of Michigan US Consumer Sentiment - tapering off
Consumer sentiment came in at 69.5 well off consensus 75 and previous 73.6, but unremarkably up from 63 in April last year. Granted this is only the mid-month update, it does send some warning signs; especially for those who may be expecting a big rise in April payrolls (maybe unlikely given indications from this). The biggest drop was from expectations (62.3 vs Mar 67.9), but current conditions also fell (80.7 vs 82.4). Even eyeballing the chart below shows a trend of tapering off after a period of recovery. The main message is that the recovery is there, but it's not strong and there are risks, and of course - as we see now in consumer sentiment; it may be quite stop-start in nature.

Summary
So where does this leave us? Let's re-cap: there's a worsening trade balance which is mostly due to oil but reflects a little increase in demand; there's inflation basically going sideways or consolidating but with risks to the upside; there's consumer spending showing a marked pick-up but how strong remains to be seen; industrial production is improving but probably still mostly due to inventory building but maybe some iota of fundamental strength; and consumer sentiment is tapering off a bit showing people are still perhaps a little confused about where things are going.
These messages are all pretty much consistent with a fragile and artificially stimulated recovery that most agree is underway. There is a pretty high probability that the recovery wont be structural, rather it will be cyclical (back to normal). Inflation will eventually pick up again, and consumers will go back to their old habits. So in the end, as noted, there are positive signs, but are they really all that positive?
Sources:
Econ Grapher Analytics www.econgrapher.com
Trading Economics www.tradingeconomics.com
US Bureau of Labour Statistics www.bls.gov
Reuters/Univesity of Michigan customers.reuters.com
US Census Department www.census.gov
Article Source: http://www.econgrapher.com/top5graphs17apr.html