
Pure Growth
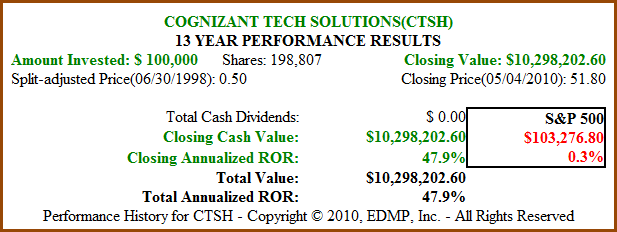
Cognizant Technology Solutions Corp. (CTSH, Financial) represents a quintessential example of a pure growth stock. Founded in 1994 as a captive arm of Dunn & Bradstreet it was spun-off as an independent public company on June 30, 1998. A $100,000 investment in its IPO and held through May 4, 2010 would be worth $10,298,202.60 for a compound annual return of 47.9%. An equal $100,000 investment in the S&P 500 over the same period would be worth $103,276.80 for a compound annual return of 0.30% (three-tenths of one percent). See Figure 1 below. Now that is a growth stock, and the stock market had little-to-nothing to do with shareholder rewards.
Figure 1 CTSH 13yr Price Performance
Recessions as Opportunities
Cognizant is headquartered in Teaneck, New Jersey and is a leading U.S. based provider of information technology consulting, IT infrastructure and business process outsourcing services. Recessions have historically represented enhanced opportunity for Cognizant to grow their businesses. Economic recovery provides a strong catalyst for growth as Cognizant clients' hunger for renewed top line growth motivates them to outsource non-core processes in order to free up investment capital.
Déjà vu all over Again
As Yogi Berra might put it, the “Great Recession” is déjà vu all over again for Cognizant Technologies Solutions (CTSH). The only other recession since Cognizant was a public company happened in 2001.
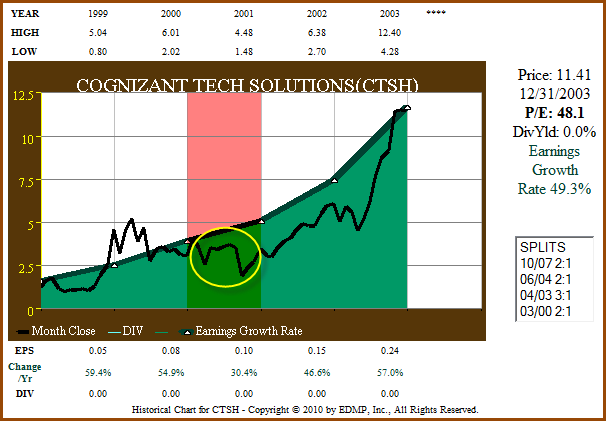
Utilizing our EDMP, Inc. F.A.S.T. Graphs™, we will review Cognizant’s stock price, correlated to earnings for the period 1999 to 2003. Figure 2 below covers Cognizant for the two years prior to the 2001 recession (red shaded area) and the two years after. Note that even though earnings growth stayed very strong (green line with white triangles) stock price fell precipitously in 2001 (yellow circle) before recovering strongly in 2002 and 2003. In the short run the emotion of fear drove price down, however, earnings ultimately drove long-term returns.
Figure 2 CTSH 1999-2003 EPS Growth Correlated to Price
The Present Time
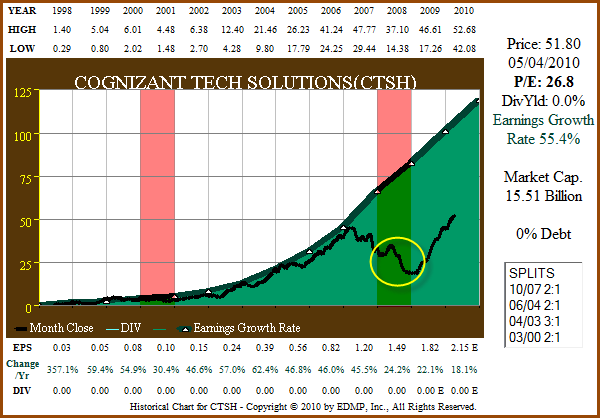
With Figure 3 below we look at Cognizant’s price and earnings correlated F.A.S.T. Graph from its public inception to present time. Once again we see that Cognizant’s stock price fell during the “Great Recession” just as it did in 2001. However, once again we also see that earnings have continued to advance and price is now moving to those advancing earnings.
Figure 3 CTSH 13yr EPS Growth Correlated to Price
Cognizant Beats Analysts Expectations
On May 4, 2010, Cognizant Technology Solutions reported a 33.6% increase in net profit for the first quarter ending March 2010. Additionally, management raised guidance as strong revenue performance was broad-based where all major industry segments saw healthy demand. Management also indicated that they felt the worst of the recession was behind them.
Growth Platforms
Francisco D’Souza, President & CEO spoke extensively during their conference call about Cognizant’s growth platform. He announced that they added five strategic accounts, defined as having the potential to ramp up to at least $5 million and potentially to $50 million in annual revenue. Two were from Financial Services, two from Retail and Manufacturing and one from Healthcare and Life Sciences. This brings their total strategic accounts to 149 out of 597 active accounts, most of which are Fortune 1000 customers.
In addition to strong demand from their core competencies, Cognizant has been investing human and financial resources into what they believe are powerful secular changes. These new opportunities are driven by the megatrends of digitization, demographic shifts, government-mandated change and new disruptive technologies such as cloud, social computing and virtualization.
The Cognizant Difference
Cognizant has long distinguished themselves against their peers with their unrivaled client-facing team. Cognizant continues to invest in and build on this team as customers have come to appreciate the hands-on benefit and service provided from their Two-in-a-Box™ (TiB) client engagement model. Additionally, Cognizant’s 2.0 (C2) single platform allows all teams to share knowledge, locate resources and provide access to worldwide talent pools to manage projects in real time from anywhere.
Financial Strength
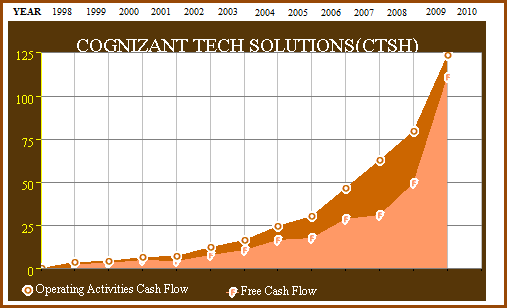
Cognizant has no debt on their balance sheet and the business is a strong cash flow generator. Cash on hand at quarter-end totaled $1.57 billion. Management runs the business with a target operating margin of between 19-20%, which they have recently exceeded. Gordon Coburn, COO, CFO & Treasurer, during the Q & A session of their conference call, talked about how margin expansion occurred during 2009 because growth slowed. Figure 4 below illustrates the impact this had on both operating cash flow (dark orange line marked with an “O”) and free cash flow (light orange line marked with a “F”), as both accelerated in 2009.
Figure 4 CTSH 13yr Operating Cash Flow and Free Cash Flow
Thesis for Growth
For Q1 2010, 79% of Cognizant’s revenues came from North America, 18% came from Europe and the remaining 3% from Asia-Pacific, Middle Eastern and Latin markets. The latter, and smallest market, which Cognizant refers to as “the rest of the world” is the fastest growing and in time could be potentially huge.
All of Cognizant’s major industry segments are currently experiencing healthy demand. Financial Services represents 41.5% of revenue and grew 5.3% on a sequential basis and grew 20.3% year over year. Healthcare represents 26.3% of revenues and grew 5.1% on a sequential basis and 33.3% year over year. Manufacturing and Logistics represent 18% of revenues and grew 6.4% sequentially and 40.7% year over year. Communications, Media and High Technology represent 14.1% of revenue and grew 11.8% sequentially and 32.7% year over year.
Cognizant sees expanding opportunity in Financial Services and Healthcare, their two largest verticals, as both are facing significant government mandated reform. Both of these important verticals could be motivated to outsource more services as a result. Therefore, the changing political landscape could re-invigorate growth in these otherwise maturing markets for Cognizant.
Cognizant is organized by vertical industry and service line to serve their customers’ comprehensive needs. Application management represents 55% of revenues and grew 4% sequentially and 28% year over year. The remaining 45% from Application Development grew 9% sequentially and 30% year over year. Whether measured by vertical industry lines or broad application offerings, Cognizant continues to generate strong growth.
Conclusion
In our opinion, Cognizant Technology Solutions Corp. (CTSH) represents a powerful growth franchise. Although historical earnings growth has exceeded 55% (see Figure 3 above), reason dictates that future growth must surely slow. However, that does not mean that future growth will be weak, just slower as the company gets bigger.
Consensus analysts’ estimates expect Cognizant to grow earnings between 18-20% for the next five years. Our own expectations are higher at 25% per annum, which is consistent with their average growth since 2007. Regardless of who is correct, everyone agrees that the Cognizant growth story is far from over.
Therefore, we believe Cognizant is a solid choice for investors seeking above-average growth of capital at today’s valuation. If price were to pull back, we would be more aggressive in our commitment.
Disclosure: Long CTSH at time of writing.
Disclosure: The opinions in this document are for informational and educational purposes only and should not be construed as a recommendation to buy or sell the stocks mentioned or to solicit transactions or clients. Past performance of the companies discussed may not continue and the companies may not achieve the earnings growth as predicted. The information in this document is believed to be accurate, but under no circumstances should a person act upon the information contained within. We do not recommend that anyone act upon any investment information without first consulting an investment advisor as to the suitability of such investments for his specific situation.
Cognizant Technology Solutions Corp. (CTSH, Financial) represents a quintessential example of a pure growth stock. Founded in 1994 as a captive arm of Dunn & Bradstreet it was spun-off as an independent public company on June 30, 1998. A $100,000 investment in its IPO and held through May 4, 2010 would be worth $10,298,202.60 for a compound annual return of 47.9%. An equal $100,000 investment in the S&P 500 over the same period would be worth $103,276.80 for a compound annual return of 0.30% (three-tenths of one percent). See Figure 1 below. Now that is a growth stock, and the stock market had little-to-nothing to do with shareholder rewards.
Figure 1 CTSH 13yr Price Performance
Recessions as Opportunities
Cognizant is headquartered in Teaneck, New Jersey and is a leading U.S. based provider of information technology consulting, IT infrastructure and business process outsourcing services. Recessions have historically represented enhanced opportunity for Cognizant to grow their businesses. Economic recovery provides a strong catalyst for growth as Cognizant clients' hunger for renewed top line growth motivates them to outsource non-core processes in order to free up investment capital.
Déjà vu all over Again
As Yogi Berra might put it, the “Great Recession” is déjà vu all over again for Cognizant Technologies Solutions (CTSH). The only other recession since Cognizant was a public company happened in 2001.
Utilizing our EDMP, Inc. F.A.S.T. Graphs™, we will review Cognizant’s stock price, correlated to earnings for the period 1999 to 2003. Figure 2 below covers Cognizant for the two years prior to the 2001 recession (red shaded area) and the two years after. Note that even though earnings growth stayed very strong (green line with white triangles) stock price fell precipitously in 2001 (yellow circle) before recovering strongly in 2002 and 2003. In the short run the emotion of fear drove price down, however, earnings ultimately drove long-term returns.
Figure 2 CTSH 1999-2003 EPS Growth Correlated to Price
The Present Time
With Figure 3 below we look at Cognizant’s price and earnings correlated F.A.S.T. Graph from its public inception to present time. Once again we see that Cognizant’s stock price fell during the “Great Recession” just as it did in 2001. However, once again we also see that earnings have continued to advance and price is now moving to those advancing earnings.
Figure 3 CTSH 13yr EPS Growth Correlated to Price
Cognizant Beats Analysts Expectations
On May 4, 2010, Cognizant Technology Solutions reported a 33.6% increase in net profit for the first quarter ending March 2010. Additionally, management raised guidance as strong revenue performance was broad-based where all major industry segments saw healthy demand. Management also indicated that they felt the worst of the recession was behind them.
Growth Platforms
Francisco D’Souza, President & CEO spoke extensively during their conference call about Cognizant’s growth platform. He announced that they added five strategic accounts, defined as having the potential to ramp up to at least $5 million and potentially to $50 million in annual revenue. Two were from Financial Services, two from Retail and Manufacturing and one from Healthcare and Life Sciences. This brings their total strategic accounts to 149 out of 597 active accounts, most of which are Fortune 1000 customers.
In addition to strong demand from their core competencies, Cognizant has been investing human and financial resources into what they believe are powerful secular changes. These new opportunities are driven by the megatrends of digitization, demographic shifts, government-mandated change and new disruptive technologies such as cloud, social computing and virtualization.
The Cognizant Difference
Cognizant has long distinguished themselves against their peers with their unrivaled client-facing team. Cognizant continues to invest in and build on this team as customers have come to appreciate the hands-on benefit and service provided from their Two-in-a-Box™ (TiB) client engagement model. Additionally, Cognizant’s 2.0 (C2) single platform allows all teams to share knowledge, locate resources and provide access to worldwide talent pools to manage projects in real time from anywhere.
Financial Strength
Cognizant has no debt on their balance sheet and the business is a strong cash flow generator. Cash on hand at quarter-end totaled $1.57 billion. Management runs the business with a target operating margin of between 19-20%, which they have recently exceeded. Gordon Coburn, COO, CFO & Treasurer, during the Q & A session of their conference call, talked about how margin expansion occurred during 2009 because growth slowed. Figure 4 below illustrates the impact this had on both operating cash flow (dark orange line marked with an “O”) and free cash flow (light orange line marked with a “F”), as both accelerated in 2009.
Figure 4 CTSH 13yr Operating Cash Flow and Free Cash Flow
Thesis for Growth
For Q1 2010, 79% of Cognizant’s revenues came from North America, 18% came from Europe and the remaining 3% from Asia-Pacific, Middle Eastern and Latin markets. The latter, and smallest market, which Cognizant refers to as “the rest of the world” is the fastest growing and in time could be potentially huge.
All of Cognizant’s major industry segments are currently experiencing healthy demand. Financial Services represents 41.5% of revenue and grew 5.3% on a sequential basis and grew 20.3% year over year. Healthcare represents 26.3% of revenues and grew 5.1% on a sequential basis and 33.3% year over year. Manufacturing and Logistics represent 18% of revenues and grew 6.4% sequentially and 40.7% year over year. Communications, Media and High Technology represent 14.1% of revenue and grew 11.8% sequentially and 32.7% year over year.
Cognizant sees expanding opportunity in Financial Services and Healthcare, their two largest verticals, as both are facing significant government mandated reform. Both of these important verticals could be motivated to outsource more services as a result. Therefore, the changing political landscape could re-invigorate growth in these otherwise maturing markets for Cognizant.
Cognizant is organized by vertical industry and service line to serve their customers’ comprehensive needs. Application management represents 55% of revenues and grew 4% sequentially and 28% year over year. The remaining 45% from Application Development grew 9% sequentially and 30% year over year. Whether measured by vertical industry lines or broad application offerings, Cognizant continues to generate strong growth.
Conclusion
In our opinion, Cognizant Technology Solutions Corp. (CTSH) represents a powerful growth franchise. Although historical earnings growth has exceeded 55% (see Figure 3 above), reason dictates that future growth must surely slow. However, that does not mean that future growth will be weak, just slower as the company gets bigger.
Consensus analysts’ estimates expect Cognizant to grow earnings between 18-20% for the next five years. Our own expectations are higher at 25% per annum, which is consistent with their average growth since 2007. Regardless of who is correct, everyone agrees that the Cognizant growth story is far from over.
Therefore, we believe Cognizant is a solid choice for investors seeking above-average growth of capital at today’s valuation. If price were to pull back, we would be more aggressive in our commitment.
Disclosure: Long CTSH at time of writing.
Disclosure: The opinions in this document are for informational and educational purposes only and should not be construed as a recommendation to buy or sell the stocks mentioned or to solicit transactions or clients. Past performance of the companies discussed may not continue and the companies may not achieve the earnings growth as predicted. The information in this document is believed to be accurate, but under no circumstances should a person act upon the information contained within. We do not recommend that anyone act upon any investment information without first consulting an investment advisor as to the suitability of such investments for his specific situation.