
There is a running argument regarding whether or not dividend paying stocks are interchangeable for bonds. The pro-bond side argues in favor of the stability of bond prices and the predictability of bond interest. The pro-dividend paying stocks side argues in favor of the potential for increasing dividend income coupled with possible capital appreciation. In the end, it all comes down to the question of risk versus reward.
Uncharacteristic bond risk
Uncharacteristic bond risk
In the spirit of full disclosure, we currently favor the dividend paying stock position and for the present eschew investing in bonds. Our position is predicated on the idea that because interest rates are so low the risk profile of bonds in general has become uncharacteristically high. The following graph shows that 10-year treasury note rates have been falling since the mid-1980s. Furthermore, although they rose from 1960 through the mid-1980s, today's 10-year treasury bond is lower than it was during the mid-1960s.
History of 10-Year Treasury Bond Rates
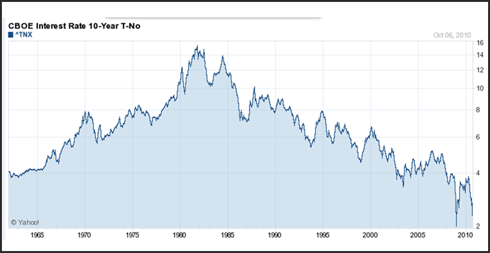
During periods of falling interest rates, bond prices will be stable since the price of pre-issued long-term bonds will tend to rise prior to maturity. Of course, as the bond gets closer to maturity, the price will move to par value. Conversely, during periods of rising interest rates the price of pre-issued long-term bonds will fall in order to make them competitive with new bonds being issued with higher interest rates. Another way to think about this is to understand that when interest rates are very high bonds are cheap and vice-versa.
Therefore, at 2.3% interest 10-year treasury bonds are extremely expensive based on historical norms. If you divide the current 2.3% interest into the hundred percent cost of a bond, the 10-year treasury bond is selling at over 43 times interest. That's pretty high. To put this into perspective, at today's rate a 10-year treasury bond would take over 43 years to pay you back your original investment.
To add further perspective to this debate between bonds versus dividend paying stocks it's useful to consider the following. As the 10-year treasury bond graph above depicts, the environment for stable bond prices has been benign for many decades as bonds have gone from being cheap (high rates) to becoming expensive (low rates). Therefore, investor attitudes towards bonds are benign as well. The only real trauma with owning bonds over the past several decades has been facing the grim reality of reinvesting at lower rates as your bonds matured.
The case for dividend paying stocks
Investor attitudes regarding owning stocks today, dividend paying or otherwise, is very poor. We believe this is due to the fact that equities, to the exact opposite of bonds, have gone from being very expensive to becoming inexpensive or at least reasonably priced today. Since calendar year 2000, common stocks in general have been awful investments providing little or no return to their investors. We argue that these bad results can be blamed almost totally on overvaluation.
True, there were real economic issues to deal with since calendar year 2000. However, the excessive valuation that was being applied to common stocks in calendar year 2000 made them more vulnerable than they would have been had valuations been more appropriate and fundamentally based.
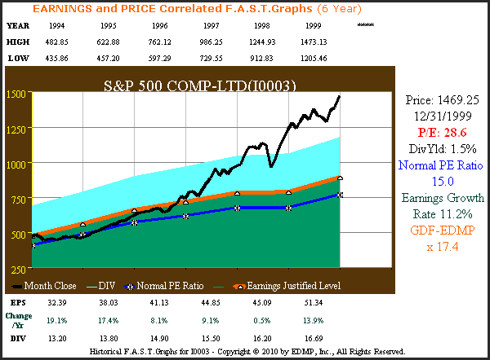
The following EDMP, Inc. F.A.S.T. Graph™ shows that the S&P 500 closed calendar year 1999 with a PE ratio of 28.6. This is close to double the historical normal (fair value) PE ratio of 15 (blue line with asterisk) that the S&P 500 should have traded at. Coming into calendar year 2000, stocks were overpriced and therefore violated the most sacred investing principle of buying low and selling high.
The following EDMP, Inc. F.A.S.T. Graph™ shows that the S&P 500 closed calendar year 1999 with a PE ratio of 28.6. This is close to double the historical normal (fair value) PE ratio of 15 (blue line with asterisk) that the S&P 500 should have traded at. Coming into calendar year 2000, stocks were overpriced and therefore violated the most sacred investing principle of buying low and selling high.
S&P 500 Overvaluation Year-end 1999
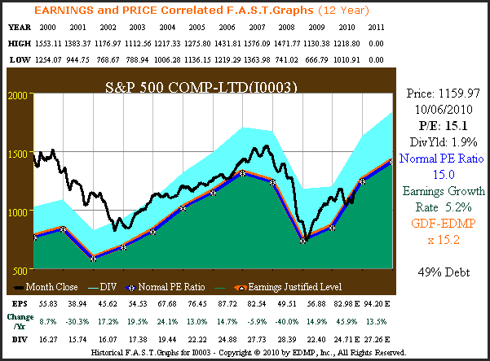
The EDMP, Inc. F.A.S.T. Graph™ below shows the S&P 500 since calendar year 2000 to current. As you can see earnings growth for the S&P 500 slowed from the 11.2% growth rate achieved from 1994 through 1999 to a growth rate of 5.2% from calendar year 2000 through October 6, 2010. However, understand that if the S&P 500 would have been valued at its normal 15 PE ratio (the blue and orange lines) the return on the S&P 500 would have averaged the 5.2% earnings growth achieved, plus dividends. Instead, due to the high starting valuation the S&P 500 generated a minus 2.2% compounded annual loss excluding dividends.
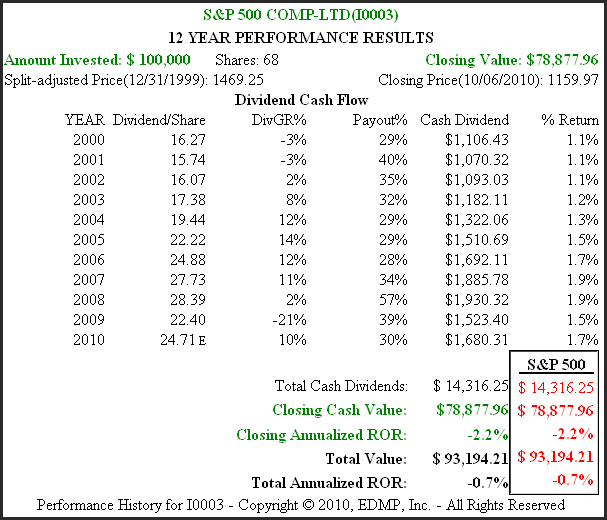
However, also note from the performance graph below, associated to the price and earnings correlated EDMP, Inc. F.A.S.T. Graph™ below, that the dividends from the S&P 500 companies reduced net loss to only a minus .7% per annum. Thanks to dividends long-term owners of the S&P 500 would've come close to breaking even. Admittedly, not a great return, but once again, we contend that valuation or more precisely overvaluation was the main culprit and not the asset class. We believe, based on the current overvaluation in bonds today that a similar overvaluation risk exists today for the bond asset class. We are not against bonds in the general sense; we are against investing in overvalued uncharacteristically risky bonds as they sit today.
S&P 500 Calendar Year 2000 - 10/06/2010 Price Correlated to Earnings
S&P 500 Calendar Year 2000 - 10/06/2010 Performance Including Dividends
Only the best equities will do
To further clarify our position on the dividend paying stocks over bonds debate we offer the following important distinction. If you're going to exchange dividend paying stocks for bonds, not just any dividend paying stock will do. In order to do this intelligently and keep the risk profile at a reasonable and tolerable level, your choice of dividend paying stocks must be highly selective. Only those companies that possess the highest quality characteristics and the most consistent and stable records of profitability and dividend payments should be considered, in our opinion.
On October 6, 2010 David Fish authored an article on Seeking Alpha that was selected as an editor’s pick titled "the six best US dividend stocks (Oct. Update).” In his article David Fish presented a four-step process for identifying quality dividend paying stocks. With his permission, we summarize those four steps as follows:
Step One: Sort the companies by payout ratio from low to high.
Step Two: Sort those companies by yield.
Step Three: Sort those companies by the price/earnings ratio (PE), low to high.
Step Four: Sort the remaining companies by five and 10-year dividend growth rates, high to low.
Through this process six companies made the grade: Procter & Gamble Co. (PG), AFLAC Inc. (AFL), Wal-Mart stores Inc. (WMT), Valspar Corp. (VAL), Medtronic Inc. (MDT) and Johnson & Johnson (JNJ). Of these six that passed David Fish's screen we own four of them with the other two currently on our research list. We believe this list represents the types of companies that could be considered by investors looking for an alternative to low return bonds today.
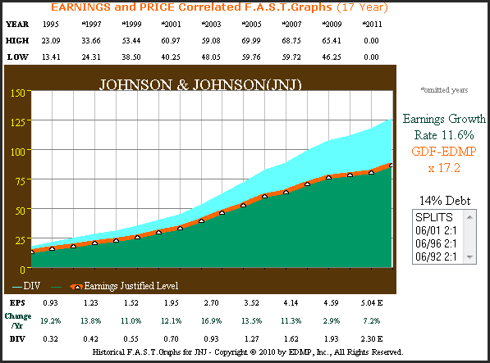
Since a picture is worth 1000 words, we thought it would be enlightening to present these six blue-chip Dividend Champions through the lens of our EDMP, Inc. F.A.S.T. Graphs™. We're going to first show these companies based on earnings and dividends only, no stock price. From this perspective, the consistency of each company's operating record is very apparent without the contamination of price volatility. In this format we are looking at the business, not the stock. In the long run we contend that the business matters most as long as valuations make sense at purchase.
PG 17yr. Earnings & Dividends Only

AFL 17yr. Earnings & Dividends Only

WMT 17yr. Earnings & Dividends Only
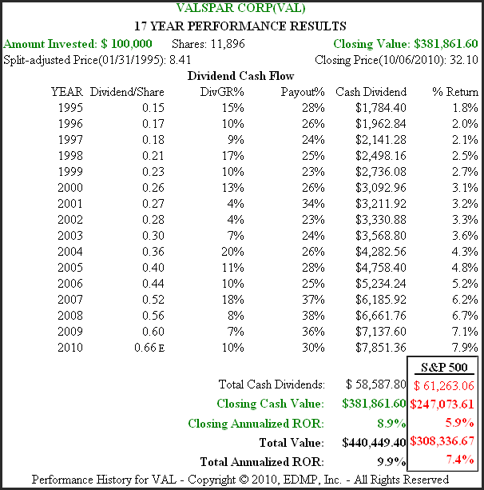
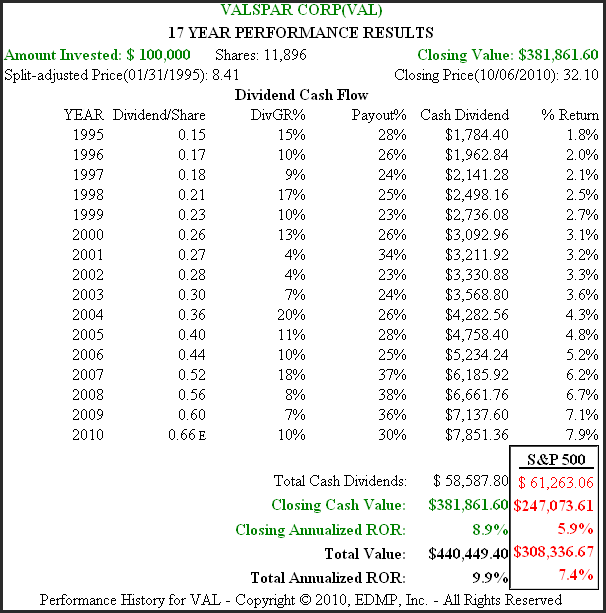
VAL 17yr. Earnings & Dividends Only

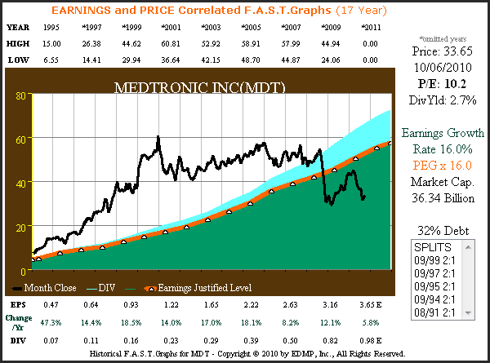
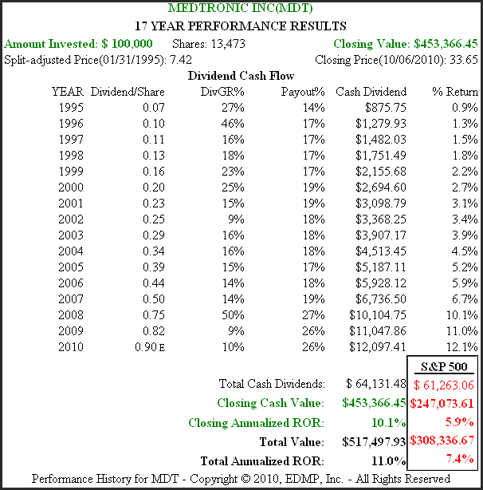
MDT 17yr. Earnings & Dividends Only


JNJ 17yr. Earnings & Dividends Only

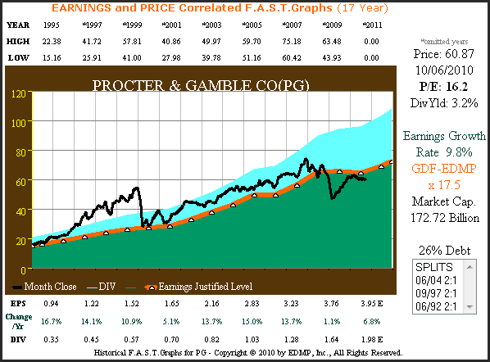
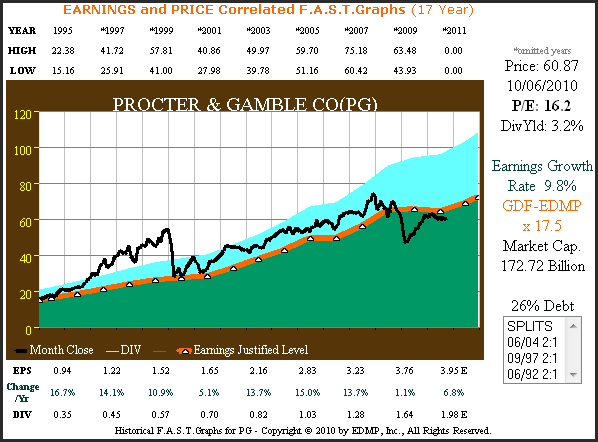
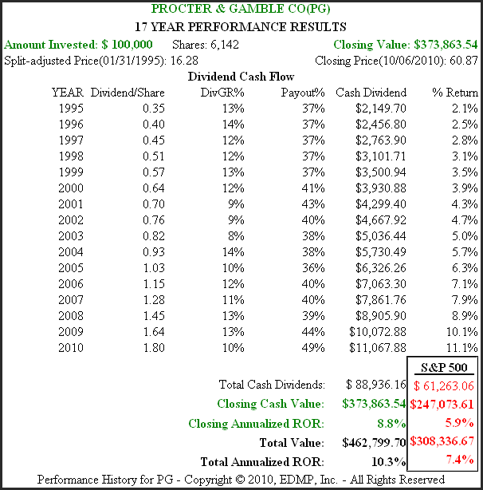
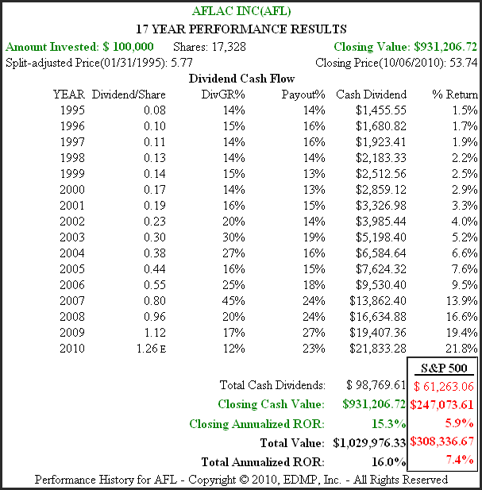
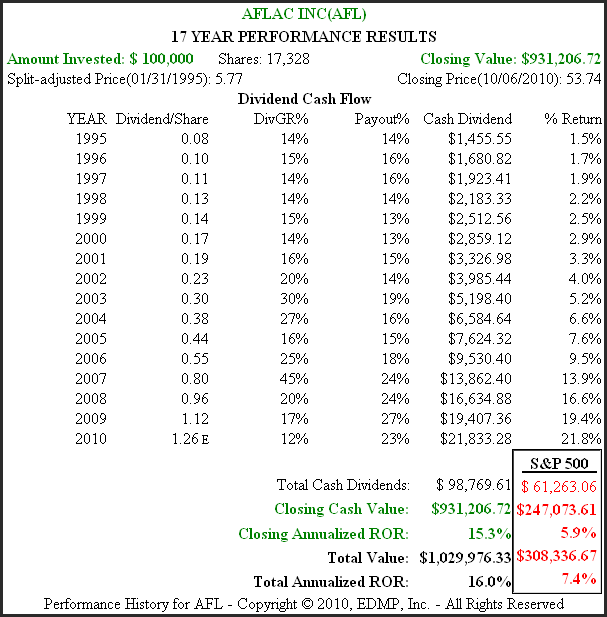
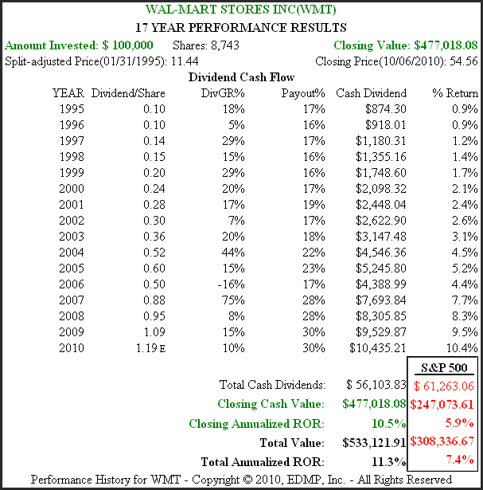
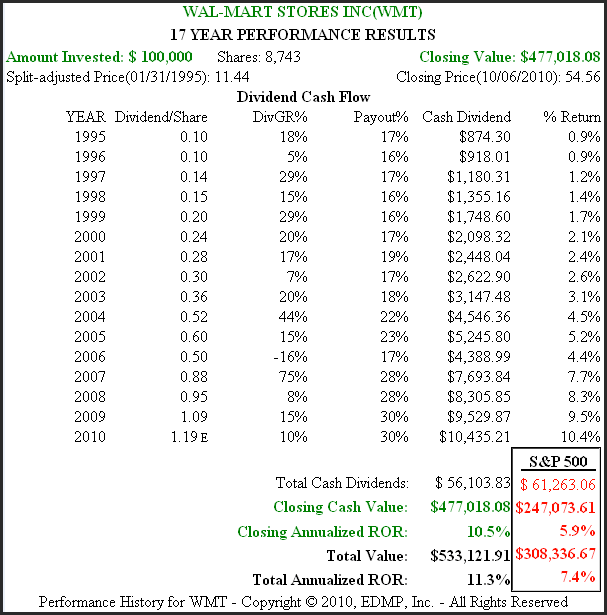
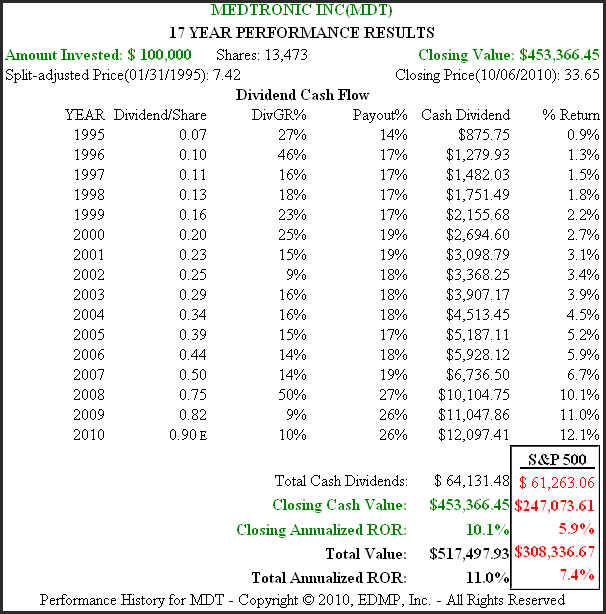
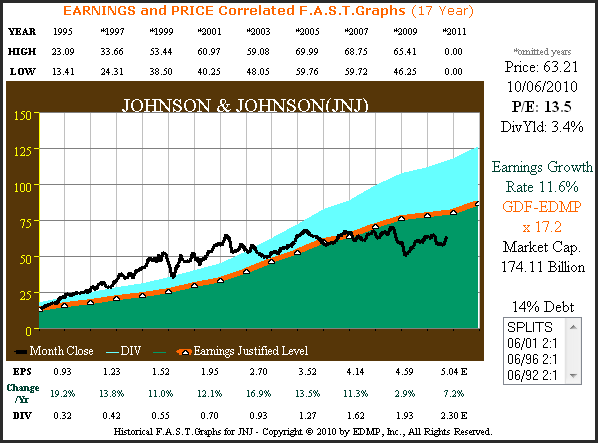
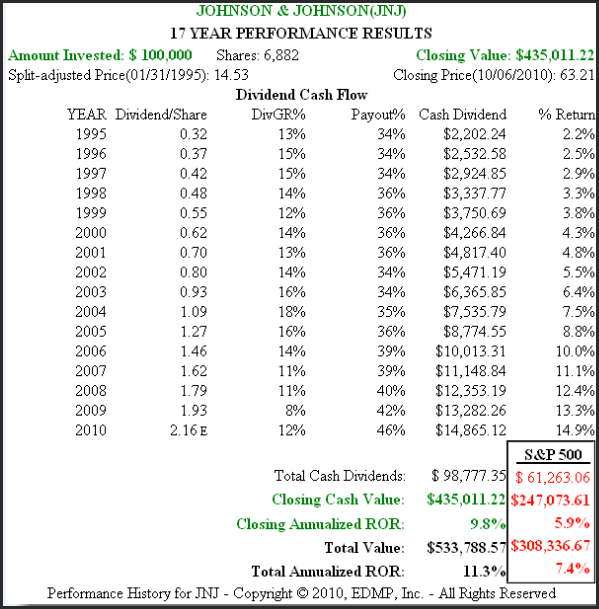
For the next set of charts we add monthly closing stock prices in order to illustrate how stock prices follow earnings over time. We include a performance record for each company which includes important information on dividends that David Fish referred to in his article. Note how each of these examples outperformed the S&P 500, a testament to their above-average status.
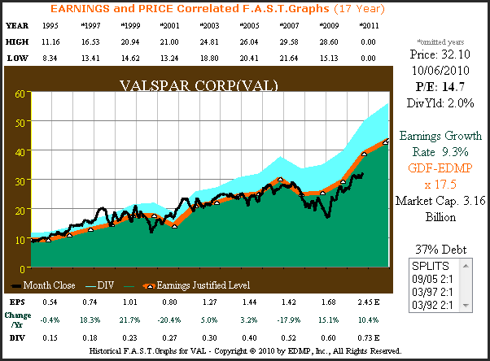
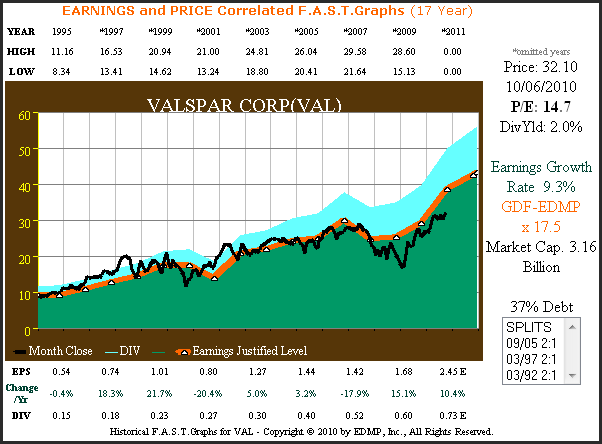
We're drawing each company's graph since calendar year 1995 in order to pick a year where valuation was in line with earnings justified levels. For reference, 1995 was the beginning of what went on to be called the infamous "irrational exuberant" era. This further highlights the importance of valuation to long-term investment returns.
As you review each price to earnings correlated graph, take special note of how closely performance is tied to earnings results. Any difference between earnings growth and shareholder returns can be explained by discrepancies in valuation either at the beginning of the time frame measured or at the end. Also, keep in mind that dividends are functionally related to earnings. In other words since dividends are paid out of earnings the size and velocity of dividend growth are a function of the size and velocity of earnings growth.
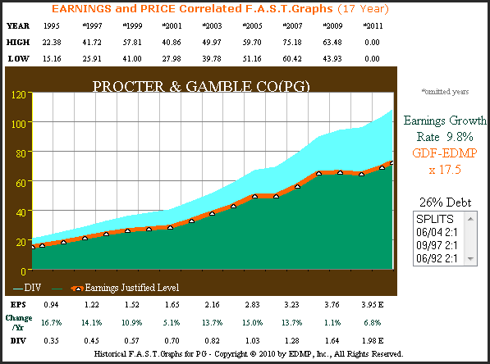
PG 17yr. Earnings & Price Correlated
PG 17 yr. Current Performance Including Dividends

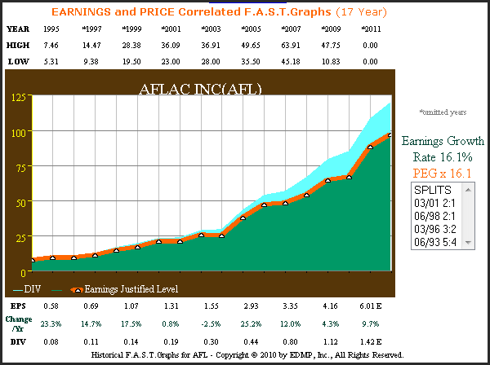
AFL 17yr. Earnings & Price Correlated
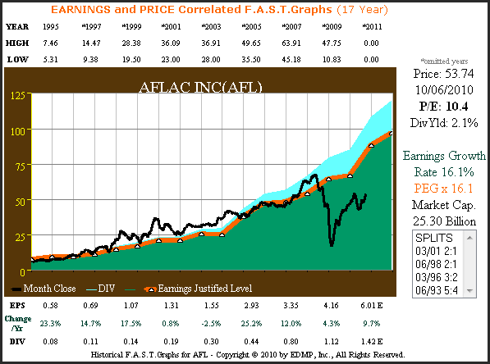

AFL 17 yr. Current Performance Including Dividends
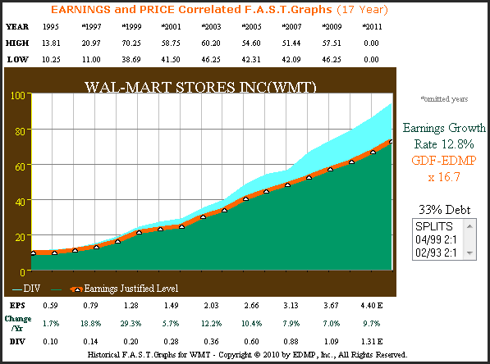
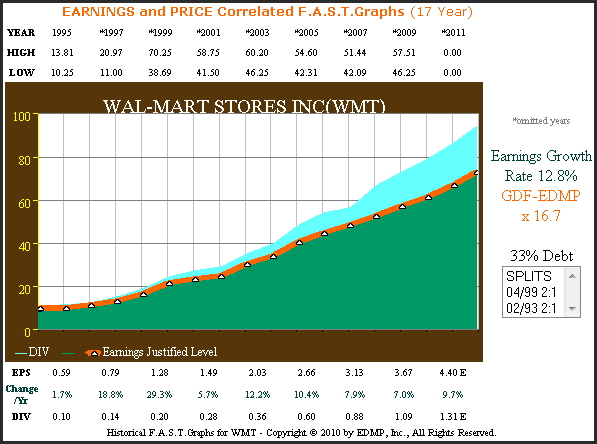
WMT 17yr. Earnings & Price Correlated

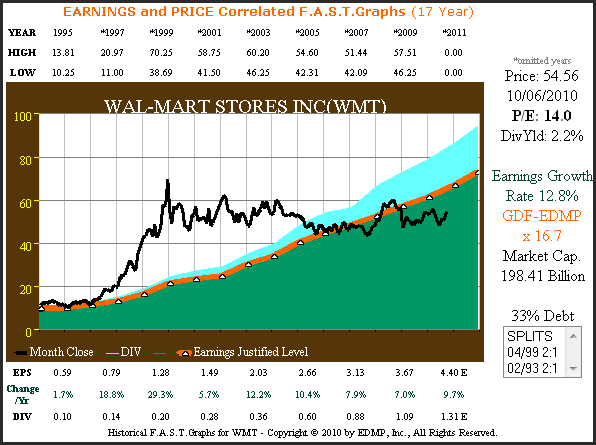
WMT 17 yr. Current Performance Including Dividends
VAL 17yr. Earnings & Price Correlated
VAL 17 yr. Current Performance Including Dividends
MDT 17yr. Earnings & Price Correlated

MDT 17 yr. Current Performance Including Dividends
JNJ 17yr. Earnings & Price Correlated

JNJ 17 yr. Current Performance Including Dividends

Conclusions
We don't believe that it's intelligent or prudent to stereotype any asset class. Not all stocks are the same, nor are all bonds. Therefore, we believe it's incumbent upon the investor to analyze each specific investment choice that they are considering in order to assess the risk and potential reward it specifically offers. On the other hand, there can be extreme circumstances that can indicate the complete avoidance of a certain asset class.
In calendar years 1996 through calendar year 2000 overvaluation relegated the S&P 500 to the category of a dangerous overpriced asset. However, there were a few select individual companies that still could have been invested in for the discerning investor. Of course with valuation generally high they were few and far between. Today, we believe the same situation applies to long-term bonds. First of all, the rates on long-term bonds are too low to be attractive in our opinion. If investors too frightened of equities choose bonds, we recommend that they keep their maturities very short term.
The big risk is if, and when, inflation rears its ugly head, the antidote to control it would be rising interest rates. This would be devastating to the price of long-term bonds. On the other hand, select Dividend Champions like those featured this article could be just what the doctor ordered. Current valuations are at historically low and apparently attractive levels, their dividend yields are competitive with bond rates and they provide the great advantage of having the opportunity to see those dividends increase each year. Of course there are no guarantees. However, with records of increasing dividends spanning more than 25 years even through the last great recession the odds appear at least reasonably in the long-term investor’s favor.
The opinions in this document are for informational and educational purposes only and should not be construed as a recommendation to buy or sell the stocks mentioned or to solicit transactions or clients. Past performance of the companies discussed may not continue and the companies may not achieve the earnings growth as predicted. The information in this document is believed to be accurate, but under no circumstances should a person act upon the information contained within. We do not recommend that anyone act upon any investment information without first consulting an investment advisor as to the suitability of such investments for his specific situation.