
Summary: CVS Caremark (CVS, Financial) is a leader in the pharmaceutical services industry. It was formed in 2007 as a result of the merger of the nation’s largest retail pharmacy chain, CVS, and the second largest prescription benefits manager (PBM), Caremark Rx.
CVS Caremark is the largest purchaser of prescription drugs and hence the lowest cost provider of prescription drugs in the United States. In addition, CVS/pharmacy is also among the very few drug store chains that are less than five miles of majority of the nation’s population. Third-party payers such as private insurers and public entities, who pay for 80% of the country’s prescription drug spending, have no choice but to include CVS’ pharmacies in their network. Without CVS, the third party payers face a valid threat that their members will have limited access to drug supply in many parts of the country. This enables CVS/pharmacy to have tremendous leverage over its “customers.”
CVS Caremark’s retail segment which mainly consists of the CVS/pharmacy drug stores has been a fine performer over the last decade. It has grown by taking share away from the independent pharmacies as well as pharmacies located in supermarkets and food stores. It has also grown by buying out many of the weaker chains. Its more recent acquisitions have helped it build a dominant position in regions like California and Hawaii that have historically been very difficult to penetrate. The price that CVS has paid for these acquisitions has been fair, and CVS has generally done a very good job at integrating them.
Since the merger, CVS/pharmacy has even outperformed its toughest competitor, Walgreens (WAG, Financial). Essentially, the merger has helped the company build a closed-loop system where they can provide incentives to its PBM members to fill their prescription through Caremark’s mail or at CVS stores, rather than at any of the other retail drug stores in the PBM network. This has driven same-store-sales at CVS pharmacies at levels much higher than Walgreens or any other of its competitors.
In contract, CVS Caremark’s Pharmacy Services division (Caremark) has performed poorly and significantly lagged its peers Medco Health Solutions (MHS, Financial) and Express Scripts (ESRX, Financial) since the merger. In the four years since the merger, there have been no noticeable synergies that were visible in Caremark’s performance. 2010 was the worst year in Caremark’s history because it lost over $5 billion in contracts – something unheard of in the PBM industry where client retention is generally very high.
There were a few factors that played a role in these contract losses. Some were lost due to poor service, some due to pricing issues, and some because Medco and Express Scripts did a good job on selling to clients lost by Caremark on the idea that the retail-PBM model was conflicting to their interests.
However, there are good reasons to be optimistic today despite the challenges at the PBM division. Caremark is now led by a well-respected PBM industry veteran, Per Lofberg. He recognizes that Caremark, a company that was built by acquisitions, has not been fully integrated yet and is the real reason for its poor service levels in some of the contracts lost. Various streamlining initiatives are underway now to finish these long-pending integration issues. Also, under his helm, the PBM business won two large contracts that have helped stabilize its client base. Lastly, changes have been made within Caremark’s marketing and sales organization to properly message the real value of CVS Caremark.
The author is of the opinion that having a retail-PBM model is no different than having a mail-PBM model of Medco and Express Scripts. If the model can help the PBM customer save money on its drug spending, then there is no conflict on driving the plan members to their own retail stores (or mail-order). Obviously, this also means that its competitors would lose business. This model has caused an outrage among the independent pharmacies upon whose urging the FTC is now looking for anti-competitive business practices at CVS Caremark. This is history repeating itself. FTC looked at the model of PBMs owning their own mail-order pharmacies in the earlier part of the decade, also on the urging of independent pharmacies, and found no conflicts.
No doubt that the PBM division at CVS Caremark has failed in the four years since the merger to deliver as promised at the time of the merger. But, an investment in CVS Caremark is about looking into the future in relation to the price today rather than at the past. Wall Street analysts who are tired of waiting for Caremark to start performing do not recognize this disconnect. Rightly so, because they are paid not to recognize this disconnect but to predict its earnings for the next few quarters.
The industry is facing a few headwinds for the next few quarters. Prescription volume is lower than some of the previous years because of weak flu trends and a decline in physician visits as a result of the weak economy. Margin is expected to be under pressure for the next few quarters because some drugs are going over-the-counter and because the pipeline for branded drugs going off-patent is weak.
However, there are some significant tailwinds that are expected to help the drug supply industry in the longer run. First, the demographics of the country are very favorable for the industry since the population in the age group 65 and older is expected to grow by 65% by 2025. This age group uses three times more prescriptions that the population group younger than 65. Secondly, under the recent health care reform act signed by President Obama in 2010, 32+ million new patients are expected to receive insurance coverage by 2019. This will result in 40+ million new prescriptions a year for CVS Caremark. Thirdly, the industry is facing its largest wave of brand-to-generics conversion in the next five years. Over $88 billion dollars of branded drugs are going to lose patent protection by 2015, starting with Pfizer’s best selling drug Lipitor in Q4 2011. For reasons explained in the Industry Analysis section of this report, the generic wave is expected to grow the bottom line by huge proportions for both the chain drug stores as well as the PBMs.
In addition to these trends, CVS Caremark as a company also has significant opportunities over the next five years. The company management has said that the days of big acquisitions are behind and it’s time for the company to improve its operations. They expect to make working capital improvements and take out a billion dollars in inventory in 2011 and 2013. This is expected to improve its return on capital metrics relative to where it stands today and more in-line with its competitors. The streamlining initiative at the PBM division is expected to deliver $250 million in savings each year from 2011 to 2015. Lastly, it has significant opportunity to further steer prescriptions filled at Caremark’s retail network (at pharmacies not owned by CVS Caremark) into its mail-order or into its pharmacies.
At today’s market cap of $49 billion, the author believes that CVS Caremark is undervalued by about 30% of its intrinsic value, assuming that the company capitalizes on the industry tailwinds and achieves the opportunities laid out earlier. But if it fails at these future initiatives, then the author believes that CVS Caremark will be able to grow its free cash flow ($3.2 billion in 2010) at 3% perpetually, slightly above the rate of inflation, providing the investor with a free cash flow yield of 9.5%. This is very attractive relative to the 3.5% yield on the 10-year U.S. government treasuries and to the limited opportunities in the frothy U.S. equity market today.
The products of the pharmaceutical industry are chemically synthesized small molecule drugs and, more lately, the biologic complex molecule drugs. The small molecule drugs are further classified in two categories – branded drugs and generic drugs.
The branded drugs have a patent on their chemical formulation or the process of manufacture. They are approved for sales & marketing after extensive clinical trials by the FDA under the Federal Food Drug and Cosmetics Act (FD&C) through a process known as “new drug application” (NDA). Patents on these drugs last for 20 years but are usually applied for before the clinical trials begin. The typical sales & marketing life of a patented drug is observed to be about 7 to 12 years (CBO, 1998). The patent is an incentive to encourage the manufacturers to innovate by risking substantial financial resources towards research & development for a relatively long period of time. The first brand-name drug to use a particular therapeutic mechanism – that is, to use a particular method to treat a given disease – is known as a breakthrough drug.
A drug that uses the same therapeutic mechanism as a breakthrough drug but different chemical formulation or manufacturing process is known as a “me-too” drug. Since the patent is on the chemical formulation or the manufacturing process, they do not infringe the patent of the breakthrough drug. Once approved by the FDA using the NDA process, these drugs lead to a form of imperfect competition between them and the breakthrough drugs, allowing the innovator firms to earn profits higher than in a perfectly competitive market but lower than in a monopoly market. The two drugs are together known as “multiple-source branded drugs.” In the absence of therapeutic equivalents of a branded drug, the breakthrough branded drug is also known as “single-source drug.”
To balance the interests of the consumer and the pharmaceutical industry, Congress passed the Hatch-Waxman Act in 1984 that allowed the FDA to approve the sale of follow-on versions (also known as generics) of off-patented branded drugs. The act eliminates the need for extensive trials and duplicative testing requirements for a generic equivalent of a previously approved patented drug. The FDA only requires the manufacturer of the generic drug to show its bioequivalence with its brand name equivalent, which is relatively inexpensive. (Bioequivalence, in simple terms, means that the active ingredient of the drug is released and absorbed at the same rate as the brand name equivalent). Estimates show that the R&D cost to bring a branded drug to market are in excess of a billion dollars, while the R&D cost to bring a generic drug to market is only 1 to 2 million dollars (ASPE Staff, 2010).
The generic manufacturer files an “abbreviated new drug application” (ANDA) to get approval for the generic. However, the “first-to-file” ANDA usually faces the risk of court litigation by the branded drug manufacturer. Thus, to incentivize the generics manufacturer, the FDA, under the Hatch-Waxman Act, extends a “180-day exclusivity” period to the first-to-file generics manufacturer. In this period, the manufacturer has exclusive license for marketing the generic. Since the manufacturer is not required to produce the drug during the ANDA period, often manufacturers will race to be the first one to file and disallow others from selling the drug.
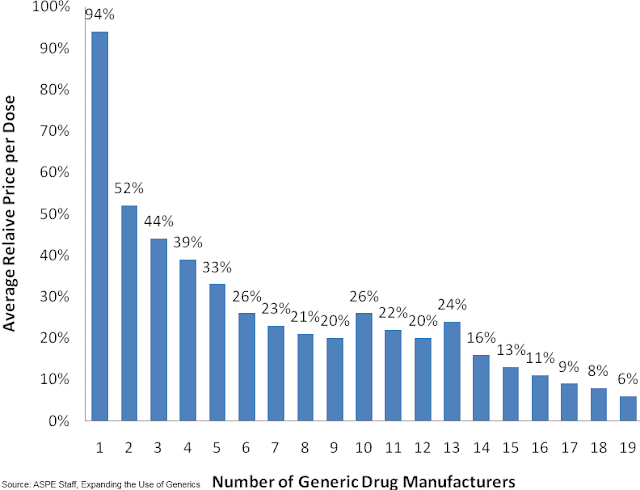
The first entrant during the exclusivity period has a very small effect on the drug price, but as the number of entrants grows the average price drops significantly (ASPE Staff, 2010). These lower prices are not because a reduction in price of the original brand name drug, but rather because of “automatic” substitution of higher-priced brand name drugs for the lower priced generics allowed under state laws (Steiner, 1985).
Another classification for prescription drugs that is commonly observed is traditional vs. specialty drugs. The small molecule chemically synthesized drugs (branded or generics) described above are known as traditional drugs. The specialty drugs are a result of recent innovations in biotechnology. These drugs are often derived from biological sources and are composed of complex molecules. The FDA approves these drugs under a different act called the Public Health Safety Act (PHS Act). Until recently, there was no pathway similar to that of the Hatch-Waxman to introduce follow-on versions (also known as biosimilars) of the biologic drugs. The Affordable Health Care Reform Act of 2010 amended the PHS Act to allow licensure of follow-on versions (Morgan Lewis, 2010).
The innovations in specialty drugs come at a very high cost. As an example, annual treatment for breast cancer with a specialty drug Herceptin can cost $48,000, and the annual cost for rheumatoid arthritis with Rhemicade can cost over $20,000 (FTC, 2009). Indeed, in 2010, off the $300 billion Americans spent on prescription drugs, 20% accounted for specialty drugs.
The specialty drugs target complex chronic diseases that occur in less than 3% of the population, and that often are life threatening in nature. They are usually dispensed from the physician’s office or specialty pharmacies that have the infrastructure for its unique handling requirements. Lastly, its administration often requires patient education and continuous monitoring.
Retail pharmacy chains have consolidated over the years to gain buying power from manufacturers and wholesalers and to broaden and strengthen the regional presence of their stores. The top four drug store chains account for 64 percent of market share today compared to less than 25 percent in 1996. Many of the weaker chains have been bought out, and all the other channels have been losing share to the chains.
Mail order pharmacies are generally used to obtain prescription drugs that treat chronic conditions (maintenance medications), but not suitable for acute conditions because it usually takes a few days for members to receive their drugs. The medications are dispensed typically in 90-day amounts per prescription, as opposed to the usual 30-day supply per prescription dispensed by a retail pharmacy. Mail-order pharmacies can be more cost efficient than retail pharmacies, because of their lower cost structure due to automatic dispensing and bulk purchasing of drugs.
Most pharmacies purchase their supply from the wholesalers, but often the large purchasers will bypass the wholesaler and obtain their supply from the manufacturers. They are also known as “self-warehousing” pharmacies.
PBMs establish a network of retail pharmacies so that members of the plan don’t have to travel long distances to fill their prescriptions. Since the retail pharmacies have access to a large number of patients through the PBM network, they are willing to give discounts to the PBM members that are not available to the non-insured customers.
Most PBMs also offer mail-order pharmacy services. The large PBMs own the mail pharmacy they use to serve their plan sponsor clients. The smaller PBMs either own their own mail pharmacies or contract with a mail pharmacy owned by another PBM or retail pharmacy. The retail as well as mail pharmacies are linked to the PBMs using a real-time point-of-system that is used by the PBMs for claims adjudication.
A PBM’s primary goal is to lower the costs for the plan sponsor without compromising the health outcome for the members of the program. To achieve this end, it designs and administers a plan for its clients and at the centerpiece of this plan is a list of authorized drugs called the formulary. The PBMs use an independent pharmacy and therapeutics (P&T) committee comprised of pharmacists and physicians from different specialties to design the formulary. Decisions about the design are based, first and foremost, on the appropriate care for the member and then as a result of the following criteria in order – efficacy, uniqueness and net drug cost.
The formulary has incentives built in to encourage appropriate member behavior. If someone wants to take a brand name contraceptive and there is a generic equivalent available, a PBM’s tiered formulary design will require her to pay a higher co-payment. PBM’s success rate at achieving the substitution of generic drugs for branded equivalent drugs is measured by “generic dispensing rate” (GDR).
The most common formulary design is a 3-tiered one. On a typical 3-tier formulary, the member’s copayment will be the lowest for the first-tier, which includes generic drugs; somewhat higher for the second-tier, which usually includes preferred brand drugs with no generic equivalent; and highest for the third-tier, which includes non-referred brand drugs or those drugs with a generic equivalent. Some plan designs include a fourth tier for drugs not included on the PBM formulary and for so-called lifestyle drugs, e.g., drugs to combat hair loss.
Similar to generic substitution, the formulary design also encourages therapeutic substitution. There are two types of interchanges. The first one involves brand-drug to brand-drug interchanges. For example, a patient presents a prescription for the cholesterol lowering drug Crestor, but the PBM, after obtaining physician’s approval, fills the prescription with Lipitor instead because of PBM’s preferential pricing with Pfizer, Lipitor’s manufacturer. The second type of therapeutic interchange refers to the interchange of a generic version of a therapeutically similar brand drug for the prescribed drug. For instance, generic Prozac is dispensed for a prescription for Zoloft.
Another commonly used feature is to require patients to follow “step-therapy.” Step-therapy refers to the plan design that will pay for certain more expensive drugs only if a physician first prescribes one or two less expensive prescriptions or over-the-counter drugs prior to prescribing a more expensive single-source drug in the same therapeutic category. For instance, in the case of a heartburn, a PBM implements step-therapy by requiring the patient to first try the cheaper H2 antagonists, and only if that fails to move to a proton-pump inhibitor like Omeprazole.
Plan designs may also include provisions intended to increase mail-order pharmacy usage, because of the lower prices. As an example, the copayment for a 90-day supply of drugs from mail may be the same or only twice as much for a 30-day supply from a retail pharmacy for three times as many doses.
PBMs today operate in a very demanding marketplace and hence have undergone major consolidation. Today, a majority of the prescription drug expenditures are managed by about 60 PBMs, of which the top 3, Medco Health Solutions, Caremark and Express Scripts, own over 50% of the market share.
PBMs have the following sources of revenue: (a) the spread between the amount they receive from the plan sponsor and the amount they reimburse to the pharmacies, (b) the spread between the rebates they receive from manufacturers for placement of their drugs on the formulary and the amount the PBMs pass on to the plan sponsor, (c) revenue from their mail-order and specialty pharmacy operations and, (d) administration fees.
The obvious question is why the markup of 20% on the manufacturer provided WAC? Barbara Martinez, in an article in the Wall Street Journal (Martinez, 2006), explains: “It is a vintage of the drug distribution that disappeared in the early 1980s. In the late 1960s, California Medicaid system needed a standardized way to reimburse the pharmacies for drugs because every claim was a paper claim based on whatever the pharmacist was charging. Two consultants came up with average wholesale price (AWP) after surmising that drug wholesalers generally charged retail pharmacies 20% more than they paid manufacturers for drugs. California decided to pay pharmacies this new AWP, plus an additional dispensing fee.” Over time, the wholesale business margins shrank and amid competition, they were charging pharmacies a mere 2% to 3% more than what they were paying to the manufacturers. But, the publishers continued to report 20% markup. Thus, third-party payers responded by demanding discounts off AWP.
Reimbursements rates for the pharmacies have been under pressure since the beginning of the decade. Reimbursements have gone down by 400 bps for retail pharmacies and 500 bps for mail-order pharmacies in the last decade.
But, the lower reimbursement off AWP is not necessarily bad by itself, because during this time AWP has seen a healthy growth rate of CAGR 7.85%. Effectively, in terms of dollar amounts the reimbursements are growing, because the pharmacies are receiving a smaller percentage of a much larger amount.
In the case of generic drugs, payers view AWP to be highly unreliable as a basis for reimbursement (CBO, 2007) because of the dynamic pricing in the generic drug market (see Figure 1). Payers either demand a deep discount of AWP or rely on an amount called “maximum allowable costs” (MAC) per unit dispensed. MAC is a reimbursement limit for a particular strength or a unit of generic drug irrespective of the manufacturer. PBMs and public party payers establish MAC based on market research of competing drug manufacturers. Each PBM will have its own MAC list, and some have more than one. Also, the federal government issues MAC list for generics that have more than three manufacturers.
The average spread per branded script at the independent pharmacies is $11.25 (CBO, 2004). The average spread per branded script at the chain pharmacies is only slightly better (in the range of $11.50 - $12.00), despite the larger volumes. The reason for such a small difference in spread is because the retail pharmacies have very limited ability to redirect the patient towards a particular branded drug among the various therapeutic equivalents. Such an interchange requires the physician’s permission, and the retail pharmacies are typically pressed for time to seek the required permission. Thus, the branded drug manufacturers treat all the retail pharmacies almost the same for pricing. This is also evident from a comment made by a vice-president of Walmart Pharmacy (Segrave, 2004): “For branded drugs, Walmart has little or no ability to negotiate discounts below the published WAC. Walmart has no greater leverage for branded drug products than any other retail class of trade pharmacy provider.”
The slightly higher spread at the chain pharmacies relative to the other retail pharmacies is a result of discounts that the wholesaler makes available exclusively to the chain pharmacies. The wholesalers provide these discounts to keep the chain pharmacies from bypassing them and going directly to the manufacturers by using their self-warehousing infrastructure.
The mail-order pharmacies have a noticeably lower acquisition cost for branded drugs compared to the retail pharmacies, and hence the spread they make on branded drugs is larger (in the range of $12.50-$13.00 per script). The source of the lower acquisition cost is because of the relatively higher ability of a mail-order pharmacy to build market share for the branded drug manufacturer. The mail-order pharmacy setting, unlike the retail pharmacy setting, allows the pharmacists to have more time to obtain the required physician’s permission for making therapeutic exchanges.
To summarize, gross margin on branded drugs varies based on the dispensing channel and is typically in the range of 8.5% to 10% depending on the type of pharmacy (average revenue for a branded script is approximately $128 and average spread is in the range $11.25 - $13.00).
As opposed to the branded drugs, the pharmacies make very high gross margins on generic drugs, in the range of 50-75%. Third-party payers allows the pharmacies to accrue a large portion of the benefits of dispensing generic drugs to encourage them to substitute generic drugs for branded drugs whenever possible, and thereby lower the overall expenditure on the much more expensive branded drugs.
Even though 50% to 75% sounds like a very big number, it is a high percentage of a much smaller number. The average revenue per generic script is only $24. The average spread per generic script for an independent pharmacy is $11.50. This is only marginally better than the spread that the independent pharmacy makes on branded drugs – just enough to encourage generic substitution.
However, the average spread per generic script is significantly higher at the chain pharmacies. The author’s analysis of data for CVS shows that the spread on generic drugs in on average $16-$18. In the case of generic drugs, the pharmacy has the sole decision on which manufacturer to use to fill the prescription. Add to this the fact that the chain pharmacies, because of their large concentration, have significant ability to move market share for the generic manufacturers towards their products. Hence, the manufacturer is willing to pass rebates to the chain pharmacies that are not available to any other class of its customers.
The chain pharmacies, because of this preferential pricing from the generic manufacturers, decide to bypass the wholesalers by using their own warehousing infrastructure. This gives rise to a second source of spreads for the chain pharmacies that are not available to the independent pharmacies. Such a direct purchasing decision allows them to capture the spread that the wholesalers usually make on supplying generics to independent pharmacies.
The economics of dispensing generic drugs for a mail order is very similar to that of the chain pharmacies for the same reasons. As per the author’s analysis of CVS’ data, the spread on generic drugs is even higher for the mail order, in the range of $20.
Unlike the branded drugs, the PBMs have no special ability to direct the plan member towards a particular generic, since the pharmacy dispenses the version of the generic that it has decided to stock. Thus, the manufacturers do not provide concessions to the PBMs for the generic drugs like in the case of branded drugs. However, the plan sponsor has to make the spread for generics at least marginally better than a branded drug to encourage generic substitution. The author estimates that the average spread per generic script for a large PBM is in the range of $2.75-$3.00.
Because the margins are so low when a prescription is filled at its retail network, the large PBMs have focused on driving members to their own mail pharmacies (or in the case of Caremark, towards the CVS retail pharmacies and Caremark’s mail-order pharmacies) where the profitability is much larger. In fact, the three large PBMs now derive ~60% of their gross margin from their mail-order operations, even though the mail-order prescriptions are only 25% of the total prescriptions.
As of Dec. 2010, CVS Pharmacy's segment includes 7,182 CVS/pharmacy retail drugstores of which 7,123 operate a pharmacy, 560 health clinics called Minute Clinic, most of them located inside the CVS/pharmacy drug stores, and CVS.com
CVS/pharmacy is an industry leader with No. 1 or No. 2 rankings in 20 of the top 25 markets across the country, filling 20% of all prescriptions in the retail drug market, and having a presence within three miles of 75% of U.S. population (CVS Caremark, 2009).
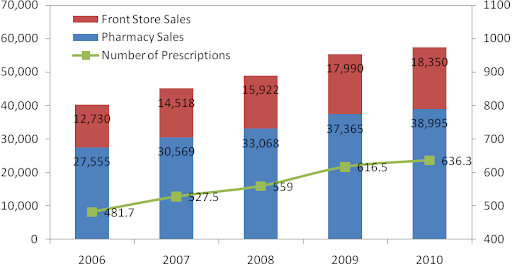
Revenue has grown at a CAGR of 9.2% over the last four years from $34 billion in 2006 to $57.3 billion in 2010. During this time, pharmacy sales have grown at a CAGR of 9.1% and front-end sales have grown at a CAGR of 9.6%.
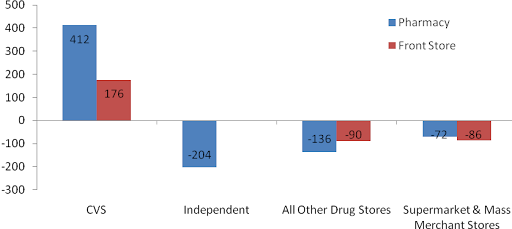
As per IMS Health data for 2005-2009, CVS/pharmacy has grown by taking market share from its peers in front-store as well as pharmacy sales.
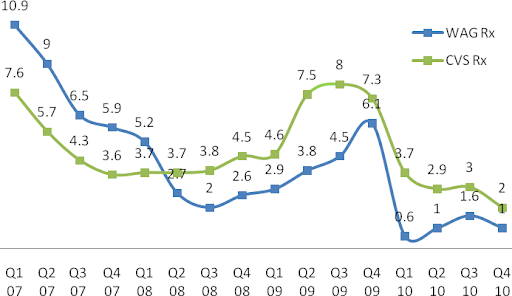
Until Q1 2008, prescription same-store sales (SSS) were lower for CVS/pharmacy relative to Walgreens. But, since then CVS/pharmacy has led Walgreens and the rest of the retail drug store industry (data not shown) in SSS. The primary driver for this trend has been a program called "Maintenance Choice" that CVS launched in Q1 2008.
Typically, PBMs allow members to fill 90-day prescriptions for chronic conditions at retail locations if the payer requests the service. If this option is made available, then a 90-day fill at retail costs less than three 30-day refills, but more than a 90-day at mail-order. Starting in 2008, CVS Caremark used its integrated PBM and retail model, to let its Maintenance Choice members fill 90-day prescriptions for chronic conditions at CVS/pharmacy at the same cost as at its mail-order. As PBM customers signed up for Maintenance Choice, more members were diverted to CVS/pharmacy from other retail drug stores in Caremark’s retail network, leading CVS/pharmacy to gain market share.
In fact, the reaction among the independent pharmacies was so intense that the National Community Pharmacists Association (NCPA) called out CVS Caremark for anti-competitive practices, which in turn led the FTC to launch a formal investigation against CVS in August, 2009. In Q3 2009, the PBM business lost major contracts which slowed growth in maintenance choice and was a reason for decline in SSS (there isn’t necessarily a cause-and-effect relationship here). Industry-wide SSS also declined due to short-term headwinds – lower physician visits for acute medications, decline in flu trends, higher prescription to OTC conversions, and weaker branded drugs to generic conversions (CVS Caremark, 2010).
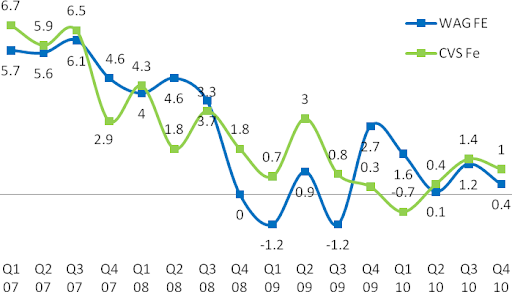
Unlike Rx SSS, Front-End (FE) SSS for both CVS/pharmacy and Walgreens have been trending down along with the general weakness in economy during the recession and decline in consumer confidence. It is very unlikely that the trend will rise to pre-recession levels when the consumer was over-leveraged.
These superior margins are a result of synergies of purchasing power CVS/pharmacy has as a result of being a subsidiary of CVS Caremark. Its industry-leading 20% market share helps CVS Caremark have tremendous leverage over the generic manufacturers.
As an example of this leverage, consider comments by an industry expert, Dr. Adam Fein (Fein, CVS' Channel Power, 2007): “In July [2007], CVS filed suit against Prasco LLC, the company that it had contracted to supply generic Allegra. The contract allegedly specified that CVS had a ‘Most Favored Nation’ clause to guarantee the lowest price of any customer, regardless of class of trade. But, as a result of the merger, CVS learned that, contrary the Agreement, Prasco had not, in fact, charged CVS the lowest price offered to any customer. Instead, CVS learned that Caremark had been charged a lower price than CVS. CVS is following a time-tested post-merger purchasing strategy – compare contracts and ask for the best price. They are taking advantage of the fact that generic companies compete for supply contracts and ‘shelf-space’ by lowering prices to the biggest customers. [Furthermore] Exhibit B of the Prasco complaint also demonstrates the power of a big buyer in the generics supply chain. ‘CVS Pharmaceuticals Business Standards’ (as of 2004) gives CVS price protection as a generic drug’s price falls. In other words, they can recover any decline in inventory value for products in their distribution centers plus five-weeks of inventory at store level (apparently without regard for actual store inventories).” This enormous buying clout that CVS enjoys, as a result of the merger, gives it the lowest cost structure in the industry.
Another source of higher margins for CVS (as well as Walgreens) relative to RAD is the significant leverage the two chains have in reimbursement negotiations over the PBMs because of their dominant national presence. PBMs have no choice but to include CVS (and Walgreens) in their retail network, thus giving the chains an upper hand in these negotiations.
For instance, consider the major battle that broke out between Walgreens and the PBM, Caremark, in July 2010. Walgreens announced that it was withdrawing from Caremark’s retail network as an attempt to get better reimbursement rates. This was a big hit to Caremark because without Walgreens it would simply be unable to provide its members access to a retail network in certain locations where Walgreens has significantly higher presence. In the Chicago-Naperville-Joliet, IL-IN-WI area Walgreens has 52% of prescription market share and CVS only 17% of prescription market share (Fein, CVS-WAG: Going from Bad to Atrocious, 2010). Eventually, Caremark and Walgreens came to an agreement in less than the weeks, under undisclosed financial terms that were probably in the favor of Walgreens.
Thus, purchasing power and dominant network are two characteristics unique to CVS/pharmacy (and to Walgreens too) that enable it (them) to have a moat deeper than any other player in this industry. This is only going to help it (them) gain market share from the other pharmacies over time. The next target to steal market share from is the financially weaker chain, Rite Aid.
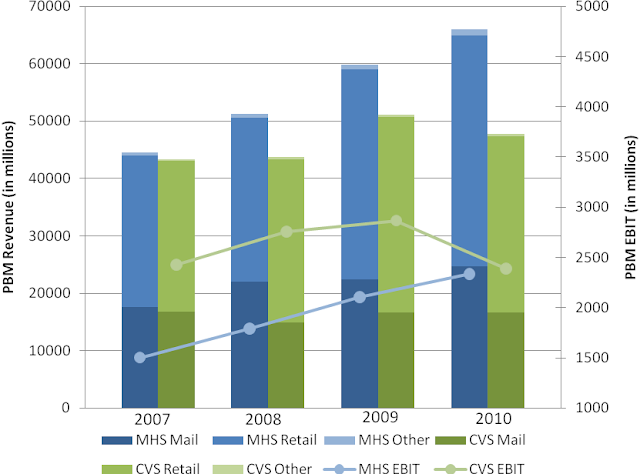
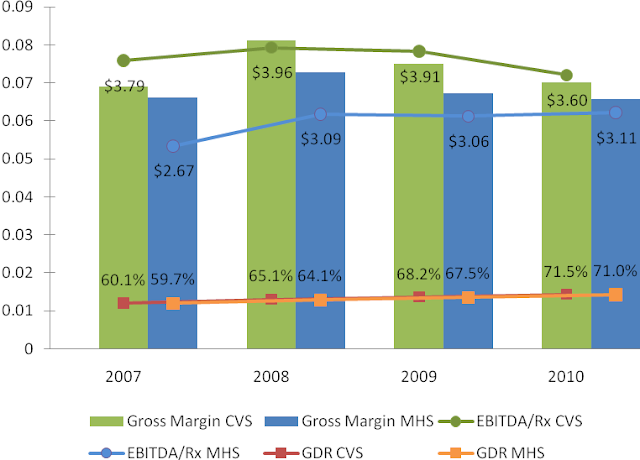
There are three metrics that are important for profitability – generic dispensing rate (GDR), gross margin, and EBITDA per prescription (EBITDA/Rx). Generic dispensing rate – the percentage of prescriptions dispensed with a generic drug instead of a branded drug – is the key driver. Caremark’s GDR has been higher than Medco’s GDR through the entire period from 2007 to 2010. This combined with Caremark’s lowest drug acquisition cost in the industry led to its superior gross margin and EBITDA/Rx.
However, both gross margin and EBITDA/Rx have been converging to that of Medco because Caremark has been “investing” a portion of its margin dollars to lock-in key client contracts. Another portion of the compression has come from a recent regulatory change that eliminates the network spread income that Caremark can make on its Med-D prescription drug plan (PDP). For readers not familiar with the Med-D, see reference (Avalere Health LLC, 2006). Medco is not a significant player in the lower margin Med-D business. Also, some portion of the compression has been because of the recent investments in the system streamlining initiatives.
1. Lost over a billion dollars in annual contract with Coventry Health Care because of “isolated” service issues, as per Chairman Tom Ryan (Seeking Alpha, 2009). Coventry had been a client of Caremark since 1999, so it was surprising that a long-time client decided not to renew its contract with Caremark because of an “isolated” issue. Unhappy with Mr. Ryan’s explanation, the author decided to do some “Phil Fisher”-style scuttlebutt and stumbled upon public testimonies of former employees of CVS Caremark (United States District Court for the District of Rhode Island, 2010). One (CW6) worked as a Client Liaison Coordinator in Nashville from 2005 to 2007 and was primarily responsible for monitoring the merger transition process among plan sponsors and resolving service interruption issues. More important to the scuttlebutt is that CW6 was a point-in-contact for Coventry. CW6 stated that indeed “service levels were low” because problems with computer systems often resulted in CVS representatives being unable to access [Coventry’s] information. Another former employee (CW5) of CVS Caremark who was a director of the PBM department from 2006 to 2008 stated that the problems at Coventry were further exacerbated by the fact that it had many different contracts with CVS Caremark, each calling for different pricing and custom benefits that the company’s systems could not support. “There was a lot of IT development that needed to be done in order to meet their needs, and if you don’t have enough resources to meet the timing on that, then obviously you have a very unhappy client.” Essentially, Coventry believed that it was given “a fluffed-up pamphlet of what [CVS Caremark was] going to provide for them as a company, and [it] didn’t deliver on its promise” (CV6).
2. Lost contract with Horizon Blue Shield of New Jersey (Horizon) worth between $1 billion to $1.3 billion annually (United States District Court for the District of Rhode Island, 2010). As per CW6, this loss was also because of the failed integration as Caremark had “no information on their [Horizon’s] formularies, no information on their drug costs.”
3. Lost $400 million annual contract with Chrysler United Auto Worker (UAW) retirees. Chrysler UAW fell under the newly created United Auto Workers retiree medical benefits trust, known as VEBA trust. The retirees of Ford and GM also fell under VEBA. Since Chrysler was the smallest of the three, Chrysler UAW moved to the PBM that managed Ford and GM retirees, Medco. Note that CVS Caremark continued to manage benefits for active employees and non-union retirees at Chrysler.
4. Lost $500 million annual contract with the State of Ohio on the managed Medicare business because of changes in the state’s regulatory policy to not carve out the PBM business.
5. Lost $600 of miscellaneous smaller clients that wanted to move to a smaller PBM instead of CVS Caremark.
6. Lost $1.7 billion from its Medicare Part D (Med-D) business. The loss came from “benchmark plans,” which are PDPs available under Med-D to low income subsidy (LIS) enrollees. Every year, PDPs bid on the benchmark plans in the nation’s 34 regions to provide prescription benefits to LIS. CVS Caremark only qualified for 15 regions in 2010, much lower than 28 regions in 2009, due to poor pricing.
Among all the losses, the one issue that is most worrisome and potentially systemic is the possibly pending system integration at the newly formed behemoth. As pointed out in the profitability section, it is somewhat comforting that Caremark has started to invest in the integration effort.
Although it’s too early to make a judgment on Mr. Lofberg, he has been an honest and transparent manager so far. Mr. Lofberg, in an interview with Bloomberg (Bloomberg, 2010), admitted that the PBM business at CVS is really “five segments that have not been fully integrated” and that completing the integration will be an “important initiative” over the next few years.
On a separate occasion, Mr. Lofberg admitted that the improper messaging at Caremark may have confused its clients and caused them to flee:
“I think customers are first and foremost interested in how can they save money on their benefits programs, how can they get good service for their members. And[i]they don’t really care that much if we are also a retail pharmacy chain in addition to being a PBM" (Fein, CVS Caremark: More Happy Talk, But Hard Work Remains, 2010).
This comment was made at the Q4 2009 earnings call when Mr. Lofberg was only five weeks into the job. It is commendable that so early on he had the courage to speak his mind rather speak what his boss Mr. Tom Ryan, the architect of the merger, might have liked.
In July 2010, Caremark announced the longest contract in the PBM industry, one for 12-years, with Aetna Inc. to serve its 9.5 million members and to administer its $9.5 billion annual drug spending, starting Jan 2011. With this contract, Aetna became the largest customer of Caremark.
Unlike the usual contracts, this one is mostly administrative in nature. Aetna will continue to retain its PBM and outsource the following functions to CVS Caremark:
· Administration of Aetna’s retail pharmacy network and management of pharmacy customer and member service functions
· Management of purchasing, inventory management, and prescriptions fulfillment for Aetna’s mail order and specialty pharmacy operations.
The benefit to Aetna is the potential to leverage CVS Caremark’s purchasing power as the largest procurer of prescription drugs as a means to lower-prices for Aetna’s customers. The benefit to Caremark, other than been a large deal, is somewhat lower than its usual book of business. The deal is expected to be dilutive to earnings in 2010 (due to implementation costs) in the 1c to 2c range, 1c to 3c accretive in 2011, 5c accretive in 2012, and 10c accretive in 2013 and beyond. A rough back-of-the-envelope calculation suggests that the deal will generate an operating margin (EBIT/Sales) of 2.4% once the deal is fully implemented in 2013 as compared to Caremark’s operating margin of 5%. However, the big opportunity to CVS Caremark that isn’t accounted for in the above calculation is going to come if Caremark up-sells Aetna on moving to Maintenance Choice.
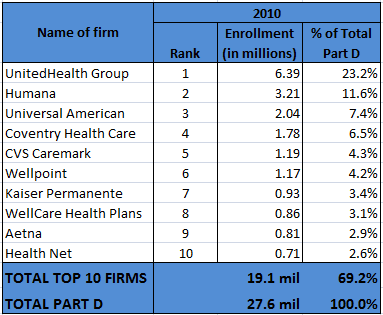
In Jan 2011, CVS acquired Universal American’s Med-D business for $1.25 billion. When combined together Universal American (UAM) and CVS Caremark would have been slightly larger than the second largest firm by Med-D 2010 enrollment, Humana (Fein, CVS-UAM: Part D Powehouse With Surprising Alliance, 2011). For this combination, Caremark paid a “fair” price about 8x EBITDA at UAM Med-D segment.
UAM marketed its PDP known as “Community CCRx” through its PBM, MemberHealth. The plan had no mail-order benefit. Thus, the plan had been very popular with the independent pharmacies because of their obvious bias against mail-order. Independent pharmacies made up over one-third of MemberHealth’s pharmacy network and accounted for a significant percentage of prescriptions filled under the CCRx PDP. In the near term, CVS will probably leave this partnership with the community pharmacies as is. However, in the longer run, it’s very likely that Caremark will use Maintenance Choice to steer the CCRx customers away from the community pharmacies into CVS/pharmacies.
Although not game changers, the two deals in addition to the streamlining initiative indicates that the turnaround at Caremark is now under way.
This report continues in a second part that can be found at CVS Caremark Part II - Financials & Valuation.
CVS Caremark is the largest purchaser of prescription drugs and hence the lowest cost provider of prescription drugs in the United States. In addition, CVS/pharmacy is also among the very few drug store chains that are less than five miles of majority of the nation’s population. Third-party payers such as private insurers and public entities, who pay for 80% of the country’s prescription drug spending, have no choice but to include CVS’ pharmacies in their network. Without CVS, the third party payers face a valid threat that their members will have limited access to drug supply in many parts of the country. This enables CVS/pharmacy to have tremendous leverage over its “customers.”
CVS Caremark’s retail segment which mainly consists of the CVS/pharmacy drug stores has been a fine performer over the last decade. It has grown by taking share away from the independent pharmacies as well as pharmacies located in supermarkets and food stores. It has also grown by buying out many of the weaker chains. Its more recent acquisitions have helped it build a dominant position in regions like California and Hawaii that have historically been very difficult to penetrate. The price that CVS has paid for these acquisitions has been fair, and CVS has generally done a very good job at integrating them.
Since the merger, CVS/pharmacy has even outperformed its toughest competitor, Walgreens (WAG, Financial). Essentially, the merger has helped the company build a closed-loop system where they can provide incentives to its PBM members to fill their prescription through Caremark’s mail or at CVS stores, rather than at any of the other retail drug stores in the PBM network. This has driven same-store-sales at CVS pharmacies at levels much higher than Walgreens or any other of its competitors.
In contract, CVS Caremark’s Pharmacy Services division (Caremark) has performed poorly and significantly lagged its peers Medco Health Solutions (MHS, Financial) and Express Scripts (ESRX, Financial) since the merger. In the four years since the merger, there have been no noticeable synergies that were visible in Caremark’s performance. 2010 was the worst year in Caremark’s history because it lost over $5 billion in contracts – something unheard of in the PBM industry where client retention is generally very high.
There were a few factors that played a role in these contract losses. Some were lost due to poor service, some due to pricing issues, and some because Medco and Express Scripts did a good job on selling to clients lost by Caremark on the idea that the retail-PBM model was conflicting to their interests.
However, there are good reasons to be optimistic today despite the challenges at the PBM division. Caremark is now led by a well-respected PBM industry veteran, Per Lofberg. He recognizes that Caremark, a company that was built by acquisitions, has not been fully integrated yet and is the real reason for its poor service levels in some of the contracts lost. Various streamlining initiatives are underway now to finish these long-pending integration issues. Also, under his helm, the PBM business won two large contracts that have helped stabilize its client base. Lastly, changes have been made within Caremark’s marketing and sales organization to properly message the real value of CVS Caremark.
The author is of the opinion that having a retail-PBM model is no different than having a mail-PBM model of Medco and Express Scripts. If the model can help the PBM customer save money on its drug spending, then there is no conflict on driving the plan members to their own retail stores (or mail-order). Obviously, this also means that its competitors would lose business. This model has caused an outrage among the independent pharmacies upon whose urging the FTC is now looking for anti-competitive business practices at CVS Caremark. This is history repeating itself. FTC looked at the model of PBMs owning their own mail-order pharmacies in the earlier part of the decade, also on the urging of independent pharmacies, and found no conflicts.
No doubt that the PBM division at CVS Caremark has failed in the four years since the merger to deliver as promised at the time of the merger. But, an investment in CVS Caremark is about looking into the future in relation to the price today rather than at the past. Wall Street analysts who are tired of waiting for Caremark to start performing do not recognize this disconnect. Rightly so, because they are paid not to recognize this disconnect but to predict its earnings for the next few quarters.
The industry is facing a few headwinds for the next few quarters. Prescription volume is lower than some of the previous years because of weak flu trends and a decline in physician visits as a result of the weak economy. Margin is expected to be under pressure for the next few quarters because some drugs are going over-the-counter and because the pipeline for branded drugs going off-patent is weak.
However, there are some significant tailwinds that are expected to help the drug supply industry in the longer run. First, the demographics of the country are very favorable for the industry since the population in the age group 65 and older is expected to grow by 65% by 2025. This age group uses three times more prescriptions that the population group younger than 65. Secondly, under the recent health care reform act signed by President Obama in 2010, 32+ million new patients are expected to receive insurance coverage by 2019. This will result in 40+ million new prescriptions a year for CVS Caremark. Thirdly, the industry is facing its largest wave of brand-to-generics conversion in the next five years. Over $88 billion dollars of branded drugs are going to lose patent protection by 2015, starting with Pfizer’s best selling drug Lipitor in Q4 2011. For reasons explained in the Industry Analysis section of this report, the generic wave is expected to grow the bottom line by huge proportions for both the chain drug stores as well as the PBMs.
In addition to these trends, CVS Caremark as a company also has significant opportunities over the next five years. The company management has said that the days of big acquisitions are behind and it’s time for the company to improve its operations. They expect to make working capital improvements and take out a billion dollars in inventory in 2011 and 2013. This is expected to improve its return on capital metrics relative to where it stands today and more in-line with its competitors. The streamlining initiative at the PBM division is expected to deliver $250 million in savings each year from 2011 to 2015. Lastly, it has significant opportunity to further steer prescriptions filled at Caremark’s retail network (at pharmacies not owned by CVS Caremark) into its mail-order or into its pharmacies.
At today’s market cap of $49 billion, the author believes that CVS Caremark is undervalued by about 30% of its intrinsic value, assuming that the company capitalizes on the industry tailwinds and achieves the opportunities laid out earlier. But if it fails at these future initiatives, then the author believes that CVS Caremark will be able to grow its free cash flow ($3.2 billion in 2010) at 3% perpetually, slightly above the rate of inflation, providing the investor with a free cash flow yield of 9.5%. This is very attractive relative to the 3.5% yield on the 10-year U.S. government treasuries and to the limited opportunities in the frothy U.S. equity market today.
CVS Caremark - Industry Analysis
Overview of Prescription Drugs
The products of the pharmaceutical industry are chemically synthesized small molecule drugs and, more lately, the biologic complex molecule drugs. The small molecule drugs are further classified in two categories – branded drugs and generic drugs.
The branded drugs have a patent on their chemical formulation or the process of manufacture. They are approved for sales & marketing after extensive clinical trials by the FDA under the Federal Food Drug and Cosmetics Act (FD&C) through a process known as “new drug application” (NDA). Patents on these drugs last for 20 years but are usually applied for before the clinical trials begin. The typical sales & marketing life of a patented drug is observed to be about 7 to 12 years (CBO, 1998). The patent is an incentive to encourage the manufacturers to innovate by risking substantial financial resources towards research & development for a relatively long period of time. The first brand-name drug to use a particular therapeutic mechanism – that is, to use a particular method to treat a given disease – is known as a breakthrough drug.
A drug that uses the same therapeutic mechanism as a breakthrough drug but different chemical formulation or manufacturing process is known as a “me-too” drug. Since the patent is on the chemical formulation or the manufacturing process, they do not infringe the patent of the breakthrough drug. Once approved by the FDA using the NDA process, these drugs lead to a form of imperfect competition between them and the breakthrough drugs, allowing the innovator firms to earn profits higher than in a perfectly competitive market but lower than in a monopoly market. The two drugs are together known as “multiple-source branded drugs.” In the absence of therapeutic equivalents of a branded drug, the breakthrough branded drug is also known as “single-source drug.”
To balance the interests of the consumer and the pharmaceutical industry, Congress passed the Hatch-Waxman Act in 1984 that allowed the FDA to approve the sale of follow-on versions (also known as generics) of off-patented branded drugs. The act eliminates the need for extensive trials and duplicative testing requirements for a generic equivalent of a previously approved patented drug. The FDA only requires the manufacturer of the generic drug to show its bioequivalence with its brand name equivalent, which is relatively inexpensive. (Bioequivalence, in simple terms, means that the active ingredient of the drug is released and absorbed at the same rate as the brand name equivalent). Estimates show that the R&D cost to bring a branded drug to market are in excess of a billion dollars, while the R&D cost to bring a generic drug to market is only 1 to 2 million dollars (ASPE Staff, 2010).
The generic manufacturer files an “abbreviated new drug application” (ANDA) to get approval for the generic. However, the “first-to-file” ANDA usually faces the risk of court litigation by the branded drug manufacturer. Thus, to incentivize the generics manufacturer, the FDA, under the Hatch-Waxman Act, extends a “180-day exclusivity” period to the first-to-file generics manufacturer. In this period, the manufacturer has exclusive license for marketing the generic. Since the manufacturer is not required to produce the drug during the ANDA period, often manufacturers will race to be the first one to file and disallow others from selling the drug.
The first entrant during the exclusivity period has a very small effect on the drug price, but as the number of entrants grows the average price drops significantly (ASPE Staff, 2010). These lower prices are not because a reduction in price of the original brand name drug, but rather because of “automatic” substitution of higher-priced brand name drugs for the lower priced generics allowed under state laws (Steiner, 1985).
Figure 1: Generic Competition and Drug Prices
Another classification for prescription drugs that is commonly observed is traditional vs. specialty drugs. The small molecule chemically synthesized drugs (branded or generics) described above are known as traditional drugs. The specialty drugs are a result of recent innovations in biotechnology. These drugs are often derived from biological sources and are composed of complex molecules. The FDA approves these drugs under a different act called the Public Health Safety Act (PHS Act). Until recently, there was no pathway similar to that of the Hatch-Waxman to introduce follow-on versions (also known as biosimilars) of the biologic drugs. The Affordable Health Care Reform Act of 2010 amended the PHS Act to allow licensure of follow-on versions (Morgan Lewis, 2010).
The innovations in specialty drugs come at a very high cost. As an example, annual treatment for breast cancer with a specialty drug Herceptin can cost $48,000, and the annual cost for rheumatoid arthritis with Rhemicade can cost over $20,000 (FTC, 2009). Indeed, in 2010, off the $300 billion Americans spent on prescription drugs, 20% accounted for specialty drugs.
The specialty drugs target complex chronic diseases that occur in less than 3% of the population, and that often are life threatening in nature. They are usually dispensed from the physician’s office or specialty pharmacies that have the infrastructure for its unique handling requirements. Lastly, its administration often requires patient education and continuous monitoring.
Overview of Supply Chain
Manufacturers
Manufacturers can be classified based on the drugs that they produce. Companies that focus on brand-name drugs invest heavily in research & development for the innovation of new drugs. Often, these companies have biotech divisions that focus on the innovation of specialty drugs. The producers of generic drugs do not require substantial investments and in fact, many of them are located in the countries where they can run efficient low-cost operations.Wholesalers
Wholesalers purchase pharmaceutical drugs from manufacturers and distribute to pharmacies, hospitals, long-term care facilities, and other medical facilities. Some sell to a broad number of clients and some specialize in sales of particular products to specific types of customers. The wholesalers industry has undergone major consolidation in the last 30 years. Today, the top three wholesalers own 90% of the market share. Their revenue model has evolved into a low margin business that makes money by maximizing economies of scale, creating physical distribution efficiencies and financial efficiencies (Kaiser Family Foundation, 2005).Pharmacies
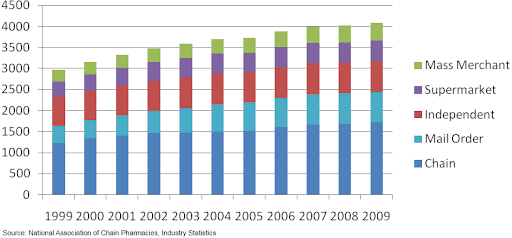
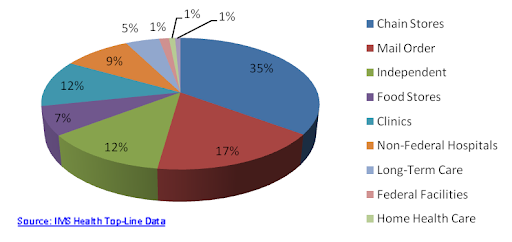
Pharmacies are the last step in distribution before prescription drugs reaches the consumer. There are several types of pharmacies such as independent drug stores, pharmacies in supermarkets and large retail stores, chain drug stores, long-term care pharmacies, mail-order pharmacies and specialty pharmacies.Figure 2: Prescription Sales by Pharmacy Type
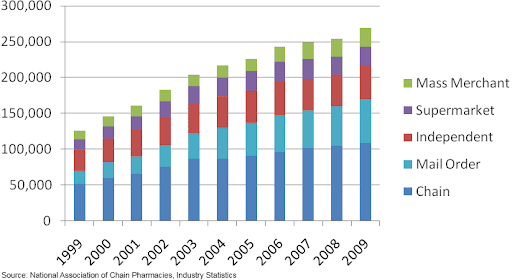
Figure 3: Number of Prescriptions by Pharmacy Type
Retail pharmacy chains have consolidated over the years to gain buying power from manufacturers and wholesalers and to broaden and strengthen the regional presence of their stores. The top four drug store chains account for 64 percent of market share today compared to less than 25 percent in 1996. Many of the weaker chains have been bought out, and all the other channels have been losing share to the chains.
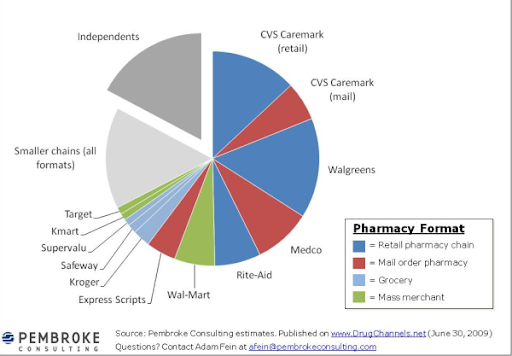
Figure 4: 2008 Prescription Sales at Retail/Mail Pharmacies
Mail order pharmacies are generally used to obtain prescription drugs that treat chronic conditions (maintenance medications), but not suitable for acute conditions because it usually takes a few days for members to receive their drugs. The medications are dispensed typically in 90-day amounts per prescription, as opposed to the usual 30-day supply per prescription dispensed by a retail pharmacy. Mail-order pharmacies can be more cost efficient than retail pharmacies, because of their lower cost structure due to automatic dispensing and bulk purchasing of drugs.
Most pharmacies purchase their supply from the wholesalers, but often the large purchasers will bypass the wholesaler and obtain their supply from the manufacturers. They are also known as “self-warehousing” pharmacies.
Other Channels
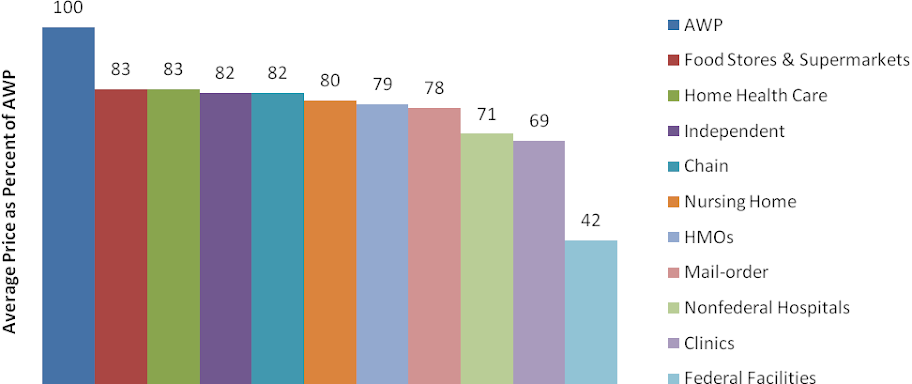
Other channels such as clinics, non-federal hospitals, long-term care, federal facilities, home health, HMOs and others accounted for 28% of drug sales in 2009. For the purpose of this report, we will not focus on these channels.Figure 5: Channel Distribution by U.S. Sales
Pharmacy Benefits Managers
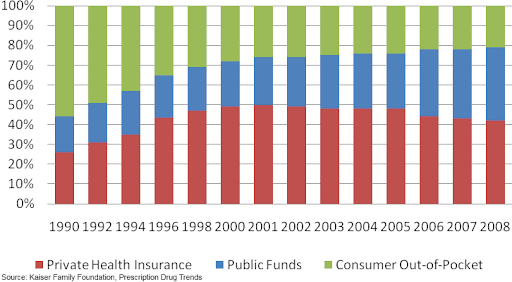
(PBMs) are third-party administrators of prescription drug insurance programs. Although not directly in the supply chain and relatively unknown to the end consumer, they exert significant influence on the pricing and delivery of drugs through their relationships with the other entities in the supply chain. The PBMs are contracted by payers of the prescription drug insurance (plan sponsors) such as self-insured employers, private health insurers, and public health programs to administer their benefits programs. Shown below is a chart of the distribution of total prescription drug expenditures by type of payer. Note that majority of private as well as public insurance programs outsource the administration to the PBMs.Figure 6: Who Pays for Prescription Drugs?
PBMs establish a network of retail pharmacies so that members of the plan don’t have to travel long distances to fill their prescriptions. Since the retail pharmacies have access to a large number of patients through the PBM network, they are willing to give discounts to the PBM members that are not available to the non-insured customers.
Most PBMs also offer mail-order pharmacy services. The large PBMs own the mail pharmacy they use to serve their plan sponsor clients. The smaller PBMs either own their own mail pharmacies or contract with a mail pharmacy owned by another PBM or retail pharmacy. The retail as well as mail pharmacies are linked to the PBMs using a real-time point-of-system that is used by the PBMs for claims adjudication.
A PBM’s primary goal is to lower the costs for the plan sponsor without compromising the health outcome for the members of the program. To achieve this end, it designs and administers a plan for its clients and at the centerpiece of this plan is a list of authorized drugs called the formulary. The PBMs use an independent pharmacy and therapeutics (P&T) committee comprised of pharmacists and physicians from different specialties to design the formulary. Decisions about the design are based, first and foremost, on the appropriate care for the member and then as a result of the following criteria in order – efficacy, uniqueness and net drug cost.
The formulary has incentives built in to encourage appropriate member behavior. If someone wants to take a brand name contraceptive and there is a generic equivalent available, a PBM’s tiered formulary design will require her to pay a higher co-payment. PBM’s success rate at achieving the substitution of generic drugs for branded equivalent drugs is measured by “generic dispensing rate” (GDR).
The most common formulary design is a 3-tiered one. On a typical 3-tier formulary, the member’s copayment will be the lowest for the first-tier, which includes generic drugs; somewhat higher for the second-tier, which usually includes preferred brand drugs with no generic equivalent; and highest for the third-tier, which includes non-referred brand drugs or those drugs with a generic equivalent. Some plan designs include a fourth tier for drugs not included on the PBM formulary and for so-called lifestyle drugs, e.g., drugs to combat hair loss.
Similar to generic substitution, the formulary design also encourages therapeutic substitution. There are two types of interchanges. The first one involves brand-drug to brand-drug interchanges. For example, a patient presents a prescription for the cholesterol lowering drug Crestor, but the PBM, after obtaining physician’s approval, fills the prescription with Lipitor instead because of PBM’s preferential pricing with Pfizer, Lipitor’s manufacturer. The second type of therapeutic interchange refers to the interchange of a generic version of a therapeutically similar brand drug for the prescribed drug. For instance, generic Prozac is dispensed for a prescription for Zoloft.
Another commonly used feature is to require patients to follow “step-therapy.” Step-therapy refers to the plan design that will pay for certain more expensive drugs only if a physician first prescribes one or two less expensive prescriptions or over-the-counter drugs prior to prescribing a more expensive single-source drug in the same therapeutic category. For instance, in the case of a heartburn, a PBM implements step-therapy by requiring the patient to first try the cheaper H2 antagonists, and only if that fails to move to a proton-pump inhibitor like Omeprazole.
Plan designs may also include provisions intended to increase mail-order pharmacy usage, because of the lower prices. As an example, the copayment for a 90-day supply of drugs from mail may be the same or only twice as much for a 30-day supply from a retail pharmacy for three times as many doses.
PBMs today operate in a very demanding marketplace and hence have undergone major consolidation. Today, a majority of the prescription drug expenditures are managed by about 60 PBMs, of which the top 3, Medco Health Solutions, Caremark and Express Scripts, own over 50% of the market share.
Industry Economics
For the purpose of the report, we will primarily focus on the economics of the pharmacies and the PBMs (since CVS Caremark is a retail pharmacy as well as a PBM).Revenue Sources
Retail, mail-order and specialty pharmacies have two main sources of revenue: (a) the “spread” between the reimbursement by the third-party payer (including the copayment by the member) and the net cost of acquiring the drug (b) fixed fee per prescription called a “dispensing fee.” The equation is very similar in the case of a non-insurance customer, but the spread is much higher because of the non-bargaining position of the non-insured customer.PBMs have the following sources of revenue: (a) the spread between the amount they receive from the plan sponsor and the amount they reimburse to the pharmacies, (b) the spread between the rebates they receive from manufacturers for placement of their drugs on the formulary and the amount the PBMs pass on to the plan sponsor, (c) revenue from their mail-order and specialty pharmacy operations and, (d) administration fees.
Prescription Drug Reimbursements
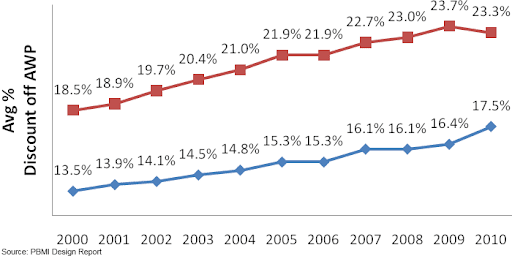
Pharmacies are reimbursed for brand name drugs by the PBMs, and public payers on the basis of a benchmark called “average wholesale price” (AWP). The formula used for reimbursement is of the form: “AWP – discount + dispensing fee.” The discounting is an indication that AWP is only a theoretical price in the pharmaceutical industry, very analogous to the sticker price in the automobile industry. Payers rely on AWP mostly because of its ready availability by publishers like Thomson Reuters. The publishers establish AWP in a standard way (Martinez, 2006) by marking up a manufacturer provided price called “wholesale acquisition cost” (WAC). The WAC is set by the manufacturer by using algorithms that take into account the demand for their product, anticipated competition and future marketing costs.The obvious question is why the markup of 20% on the manufacturer provided WAC? Barbara Martinez, in an article in the Wall Street Journal (Martinez, 2006), explains: “It is a vintage of the drug distribution that disappeared in the early 1980s. In the late 1960s, California Medicaid system needed a standardized way to reimburse the pharmacies for drugs because every claim was a paper claim based on whatever the pharmacist was charging. Two consultants came up with average wholesale price (AWP) after surmising that drug wholesalers generally charged retail pharmacies 20% more than they paid manufacturers for drugs. California decided to pay pharmacies this new AWP, plus an additional dispensing fee.” Over time, the wholesale business margins shrank and amid competition, they were charging pharmacies a mere 2% to 3% more than what they were paying to the manufacturers. But, the publishers continued to report 20% markup. Thus, third-party payers responded by demanding discounts off AWP.
Reimbursements rates for the pharmacies have been under pressure since the beginning of the decade. Reimbursements have gone down by 400 bps for retail pharmacies and 500 bps for mail-order pharmacies in the last decade.
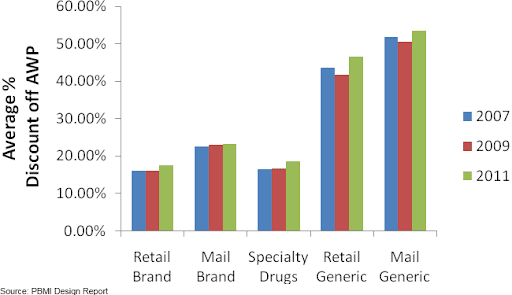
Figure 7: Trends in Single-Source Drug Reimbursements
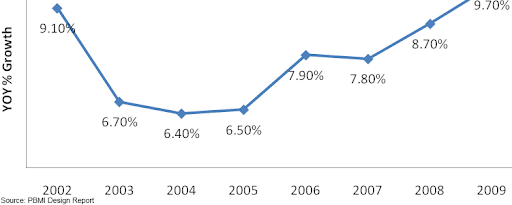
But, the lower reimbursement off AWP is not necessarily bad by itself, because during this time AWP has seen a healthy growth rate of CAGR 7.85%. Effectively, in terms of dollar amounts the reimbursements are growing, because the pharmacies are receiving a smaller percentage of a much larger amount.
Figure 8: Single-Source Drug AWP Growth
In the case of generic drugs, payers view AWP to be highly unreliable as a basis for reimbursement (CBO, 2007) because of the dynamic pricing in the generic drug market (see Figure 1). Payers either demand a deep discount of AWP or rely on an amount called “maximum allowable costs” (MAC) per unit dispensed. MAC is a reimbursement limit for a particular strength or a unit of generic drug irrespective of the manufacturer. PBMs and public party payers establish MAC based on market research of competing drug manufacturers. Each PBM will have its own MAC list, and some have more than one. Also, the federal government issues MAC list for generics that have more than three manufacturers.
Figure 9: Average Pharmacy Reimbursement by Dispensing Channel
Prescription Drug Acquisition and Pharmacy Profitability
Manufacturers provide concessions to the purchasers of their drugs based on (a) purchaser’s volume as well as (b) their ability to direct end consumers to the manufacturer’s drug from a set of competing drugs. Thus, manufacturers may offer concessions to one group of purchasers that may not be available to another group even if it has a higher volume because of its limited ability to influence the consumer.Figure 10: Acquisition Cost for Single-Source Drugs
The average spread per branded script at the independent pharmacies is $11.25 (CBO, 2004). The average spread per branded script at the chain pharmacies is only slightly better (in the range of $11.50 - $12.00), despite the larger volumes. The reason for such a small difference in spread is because the retail pharmacies have very limited ability to redirect the patient towards a particular branded drug among the various therapeutic equivalents. Such an interchange requires the physician’s permission, and the retail pharmacies are typically pressed for time to seek the required permission. Thus, the branded drug manufacturers treat all the retail pharmacies almost the same for pricing. This is also evident from a comment made by a vice-president of Walmart Pharmacy (Segrave, 2004): “For branded drugs, Walmart has little or no ability to negotiate discounts below the published WAC. Walmart has no greater leverage for branded drug products than any other retail class of trade pharmacy provider.”
The slightly higher spread at the chain pharmacies relative to the other retail pharmacies is a result of discounts that the wholesaler makes available exclusively to the chain pharmacies. The wholesalers provide these discounts to keep the chain pharmacies from bypassing them and going directly to the manufacturers by using their self-warehousing infrastructure.
The mail-order pharmacies have a noticeably lower acquisition cost for branded drugs compared to the retail pharmacies, and hence the spread they make on branded drugs is larger (in the range of $12.50-$13.00 per script). The source of the lower acquisition cost is because of the relatively higher ability of a mail-order pharmacy to build market share for the branded drug manufacturer. The mail-order pharmacy setting, unlike the retail pharmacy setting, allows the pharmacists to have more time to obtain the required physician’s permission for making therapeutic exchanges.
To summarize, gross margin on branded drugs varies based on the dispensing channel and is typically in the range of 8.5% to 10% depending on the type of pharmacy (average revenue for a branded script is approximately $128 and average spread is in the range $11.25 - $13.00).
As opposed to the branded drugs, the pharmacies make very high gross margins on generic drugs, in the range of 50-75%. Third-party payers allows the pharmacies to accrue a large portion of the benefits of dispensing generic drugs to encourage them to substitute generic drugs for branded drugs whenever possible, and thereby lower the overall expenditure on the much more expensive branded drugs.
Even though 50% to 75% sounds like a very big number, it is a high percentage of a much smaller number. The average revenue per generic script is only $24. The average spread per generic script for an independent pharmacy is $11.50. This is only marginally better than the spread that the independent pharmacy makes on branded drugs – just enough to encourage generic substitution.
However, the average spread per generic script is significantly higher at the chain pharmacies. The author’s analysis of data for CVS shows that the spread on generic drugs in on average $16-$18. In the case of generic drugs, the pharmacy has the sole decision on which manufacturer to use to fill the prescription. Add to this the fact that the chain pharmacies, because of their large concentration, have significant ability to move market share for the generic manufacturers towards their products. Hence, the manufacturer is willing to pass rebates to the chain pharmacies that are not available to any other class of its customers.
The chain pharmacies, because of this preferential pricing from the generic manufacturers, decide to bypass the wholesalers by using their own warehousing infrastructure. This gives rise to a second source of spreads for the chain pharmacies that are not available to the independent pharmacies. Such a direct purchasing decision allows them to capture the spread that the wholesalers usually make on supplying generics to independent pharmacies.
The economics of dispensing generic drugs for a mail order is very similar to that of the chain pharmacies for the same reasons. As per the author’s analysis of CVS’ data, the spread on generic drugs is even higher for the mail order, in the range of $20.
PBM Profitability
A PBM’s spread from dispensing a prescription at its retail network (not at a pharmacy owned by the PBM) is usually much larger for branded drugs than for generic drugs. This is because the PBMs have an immense influence on the choice of branded drug dispensed in their network pharmacies because of their ability to include a particular branded drug from a set of therapeutic substitutes in the formulary. Furthermore, they can ensure formulary compliance among its members by setting a low copayment for a formulary-branded drug compared to the other therapeutic equivalents. The average spread per branded script for a large PBM is in the range of $1.75 - $2.00 (Abrams, 2008).Unlike the branded drugs, the PBMs have no special ability to direct the plan member towards a particular generic, since the pharmacy dispenses the version of the generic that it has decided to stock. Thus, the manufacturers do not provide concessions to the PBMs for the generic drugs like in the case of branded drugs. However, the plan sponsor has to make the spread for generics at least marginally better than a branded drug to encourage generic substitution. The author estimates that the average spread per generic script for a large PBM is in the range of $2.75-$3.00.
Because the margins are so low when a prescription is filled at its retail network, the large PBMs have focused on driving members to their own mail pharmacies (or in the case of Caremark, towards the CVS retail pharmacies and Caremark’s mail-order pharmacies) where the profitability is much larger. In fact, the three large PBMs now derive ~60% of their gross margin from their mail-order operations, even though the mail-order prescriptions are only 25% of the total prescriptions.
CVS Caremark – Segment Analysis
Retail Business
History
CVS was originally a division of Melville Corporation. In 1996, Melville Corporation divested its other businesses such as Linen ‘n Things, KB Toys, and Marshalls, and changed its name to CVS Corporation. Since then, CVS has primarily grown through acquisitions. In 1997, CVS used the proceeds from the divesture to double its 1,400 store count by purchasing the 2,500-store chain Revco. In 1998, CVS got an instant lead in the Detroit market through its 207 store purchase from Arbor Drugs in Michigan. In 1999, CVS acquired Soma.com and renamed it CVS.com to become the first fully integrated online and brick-and-mortar pharmacy. In 2004, CVS purchased 1,268 Eckerd drug stores, most of them located in Texas and Florida. In 2006, CVS acquired the freestanding drug operations of supermarket chain Albertsons. The deal included the acquisition of 700 drug stores under the banner of Osco Drug and Sav-On Drugs, with primary concentration of stores in southern California and Chicago. In 2008, CVS acquired Longs Drugs, thus expanding its presence in historically hard-to-penetrate markets, California and Hawaii (Wikipedia).As of Dec. 2010, CVS Pharmacy's segment includes 7,182 CVS/pharmacy retail drugstores of which 7,123 operate a pharmacy, 560 health clinics called Minute Clinic, most of them located inside the CVS/pharmacy drug stores, and CVS.com
CVS/pharmacy is an industry leader with No. 1 or No. 2 rankings in 20 of the top 25 markets across the country, filling 20% of all prescriptions in the retail drug market, and having a presence within three miles of 75% of U.S. population (CVS Caremark, 2009).
Revenue
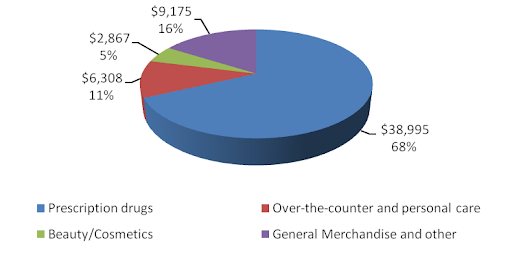
A typical drugstore sells prescription drugs and front-store merchandise such as over-the-counter drugs and personal care products, beauty products and cosmetics and general merchandise such as convenience foods, seasonal merchandise, film and photo finishing services and other items.Figure 11: 2010 CVS Caremark Retail Segment Revenue Break Down
Revenue has grown at a CAGR of 9.2% over the last four years from $34 billion in 2006 to $57.3 billion in 2010. During this time, pharmacy sales have grown at a CAGR of 9.1% and front-end sales have grown at a CAGR of 9.6%.
Figure 12: CVS Caremark Retail Segment Revenue Growth
As per IMS Health data for 2005-2009, CVS/pharmacy has grown by taking market share from its peers in front-store as well as pharmacy sales.
Figure 13: CVS Caremark Retail Market Share Growth
Same-Store-Sales
Since CVS/pharmacy has grown primarily through acquisitions, it is important to look at same-store sales to evaluate the core performance of its stores.Figure 14: Rx Same-Store-Sales Trends
Until Q1 2008, prescription same-store sales (SSS) were lower for CVS/pharmacy relative to Walgreens. But, since then CVS/pharmacy has led Walgreens and the rest of the retail drug store industry (data not shown) in SSS. The primary driver for this trend has been a program called "Maintenance Choice" that CVS launched in Q1 2008.
Typically, PBMs allow members to fill 90-day prescriptions for chronic conditions at retail locations if the payer requests the service. If this option is made available, then a 90-day fill at retail costs less than three 30-day refills, but more than a 90-day at mail-order. Starting in 2008, CVS Caremark used its integrated PBM and retail model, to let its Maintenance Choice members fill 90-day prescriptions for chronic conditions at CVS/pharmacy at the same cost as at its mail-order. As PBM customers signed up for Maintenance Choice, more members were diverted to CVS/pharmacy from other retail drug stores in Caremark’s retail network, leading CVS/pharmacy to gain market share.
In fact, the reaction among the independent pharmacies was so intense that the National Community Pharmacists Association (NCPA) called out CVS Caremark for anti-competitive practices, which in turn led the FTC to launch a formal investigation against CVS in August, 2009. In Q3 2009, the PBM business lost major contracts which slowed growth in maintenance choice and was a reason for decline in SSS (there isn’t necessarily a cause-and-effect relationship here). Industry-wide SSS also declined due to short-term headwinds – lower physician visits for acute medications, decline in flu trends, higher prescription to OTC conversions, and weaker branded drugs to generic conversions (CVS Caremark, 2010).
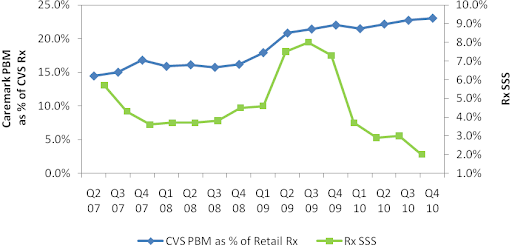
Figure 15: Caremark PBM as % of CVS Prescription Sales
Unlike Rx SSS, Front-End (FE) SSS for both CVS/pharmacy and Walgreens have been trending down along with the general weakness in economy during the recession and decline in consumer confidence. It is very unlikely that the trend will rise to pre-recession levels when the consumer was over-leveraged.
Figure 16: Front-Store Same-Store-Sales Trends
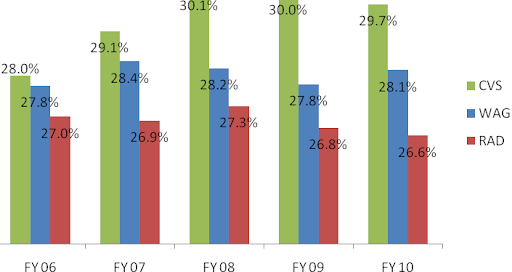
Gross Margin
CVS/pharmacy outperforms both Walgreens and Rite Aid by a significant margin.Figure 17: Gross Margin as % of Revenue
These superior margins are a result of synergies of purchasing power CVS/pharmacy has as a result of being a subsidiary of CVS Caremark. Its industry-leading 20% market share helps CVS Caremark have tremendous leverage over the generic manufacturers.
As an example of this leverage, consider comments by an industry expert, Dr. Adam Fein (Fein, CVS' Channel Power, 2007): “In July [2007], CVS filed suit against Prasco LLC, the company that it had contracted to supply generic Allegra. The contract allegedly specified that CVS had a ‘Most Favored Nation’ clause to guarantee the lowest price of any customer, regardless of class of trade. But, as a result of the merger, CVS learned that, contrary the Agreement, Prasco had not, in fact, charged CVS the lowest price offered to any customer. Instead, CVS learned that Caremark had been charged a lower price than CVS. CVS is following a time-tested post-merger purchasing strategy – compare contracts and ask for the best price. They are taking advantage of the fact that generic companies compete for supply contracts and ‘shelf-space’ by lowering prices to the biggest customers. [Furthermore] Exhibit B of the Prasco complaint also demonstrates the power of a big buyer in the generics supply chain. ‘CVS Pharmaceuticals Business Standards’ (as of 2004) gives CVS price protection as a generic drug’s price falls. In other words, they can recover any decline in inventory value for products in their distribution centers plus five-weeks of inventory at store level (apparently without regard for actual store inventories).” This enormous buying clout that CVS enjoys, as a result of the merger, gives it the lowest cost structure in the industry.
Another source of higher margins for CVS (as well as Walgreens) relative to RAD is the significant leverage the two chains have in reimbursement negotiations over the PBMs because of their dominant national presence. PBMs have no choice but to include CVS (and Walgreens) in their retail network, thus giving the chains an upper hand in these negotiations.
For instance, consider the major battle that broke out between Walgreens and the PBM, Caremark, in July 2010. Walgreens announced that it was withdrawing from Caremark’s retail network as an attempt to get better reimbursement rates. This was a big hit to Caremark because without Walgreens it would simply be unable to provide its members access to a retail network in certain locations where Walgreens has significantly higher presence. In the Chicago-Naperville-Joliet, IL-IN-WI area Walgreens has 52% of prescription market share and CVS only 17% of prescription market share (Fein, CVS-WAG: Going from Bad to Atrocious, 2010). Eventually, Caremark and Walgreens came to an agreement in less than the weeks, under undisclosed financial terms that were probably in the favor of Walgreens.
Thus, purchasing power and dominant network are two characteristics unique to CVS/pharmacy (and to Walgreens too) that enable it (them) to have a moat deeper than any other player in this industry. This is only going to help it (them) gain market share from the other pharmacies over time. The next target to steal market share from is the financially weaker chain, Rite Aid.
Operating Expenses
Operating expenses as a percentage of sales have been fairly constant over the years and in the same range as Walgreens.Figure 18: Operating Expenses as % of Revenue
Operating Earnings
All of the above drivers led to superior growth in operating earnings at CVS pharmacy of CAGR 18.6% compared to a CAGR of only 5.8% at Walgreens and losses at Rite-Aid (data not shown) in the period 2006-2010.Figure 19: Retail Pharmacy Operating Earnings
Pharmacy Services Business
Revenue
CVS’s PBM division, Caremark Pharmacy Services, has lagged its main competitor, Medco Health Solutions (MHS) since the time of the merger. In the first three years, net contract wins at Caremark were very slow relative to Medco Health Solutions. The bigger blow came in 2010, when Caremark lost $4.5 billion (net) in contracts, causing major “heart palpitations” (Seeking Alpha, 2009) among the investor community. During 2007-2010, as one would expect, EBIT followed the dismal revenue trend.Figure 20: Caremark/MHS Revenue & EBIT
Profitability
The management team at Caremark obviously failed at client retention. Luckily, the failure did not extend to the performance of the retained business and in fact it was more profitable than Medco. This is somewhat comforting because if the reasons for the contract losses can be fixed, then the declining trends at Caremark could easily be turned around.Figure 21: Caremark/MHS Profitability
There are three metrics that are important for profitability – generic dispensing rate (GDR), gross margin, and EBITDA per prescription (EBITDA/Rx). Generic dispensing rate – the percentage of prescriptions dispensed with a generic drug instead of a branded drug – is the key driver. Caremark’s GDR has been higher than Medco’s GDR through the entire period from 2007 to 2010. This combined with Caremark’s lowest drug acquisition cost in the industry led to its superior gross margin and EBITDA/Rx.
However, both gross margin and EBITDA/Rx have been converging to that of Medco because Caremark has been “investing” a portion of its margin dollars to lock-in key client contracts. Another portion of the compression has come from a recent regulatory change that eliminates the network spread income that Caremark can make on its Med-D prescription drug plan (PDP). For readers not familiar with the Med-D, see reference (Avalere Health LLC, 2006). Medco is not a significant player in the lower margin Med-D business. Also, some portion of the compression has been because of the recent investments in the system streamlining initiatives.
Contract Losses
An examination of the contract loses in 2010 is important because it can throw light on possible systemic issues at Caremark.1. Lost over a billion dollars in annual contract with Coventry Health Care because of “isolated” service issues, as per Chairman Tom Ryan (Seeking Alpha, 2009). Coventry had been a client of Caremark since 1999, so it was surprising that a long-time client decided not to renew its contract with Caremark because of an “isolated” issue. Unhappy with Mr. Ryan’s explanation, the author decided to do some “Phil Fisher”-style scuttlebutt and stumbled upon public testimonies of former employees of CVS Caremark (United States District Court for the District of Rhode Island, 2010). One (CW6) worked as a Client Liaison Coordinator in Nashville from 2005 to 2007 and was primarily responsible for monitoring the merger transition process among plan sponsors and resolving service interruption issues. More important to the scuttlebutt is that CW6 was a point-in-contact for Coventry. CW6 stated that indeed “service levels were low” because problems with computer systems often resulted in CVS representatives being unable to access [Coventry’s] information. Another former employee (CW5) of CVS Caremark who was a director of the PBM department from 2006 to 2008 stated that the problems at Coventry were further exacerbated by the fact that it had many different contracts with CVS Caremark, each calling for different pricing and custom benefits that the company’s systems could not support. “There was a lot of IT development that needed to be done in order to meet their needs, and if you don’t have enough resources to meet the timing on that, then obviously you have a very unhappy client.” Essentially, Coventry believed that it was given “a fluffed-up pamphlet of what [CVS Caremark was] going to provide for them as a company, and [it] didn’t deliver on its promise” (CV6).
2. Lost contract with Horizon Blue Shield of New Jersey (Horizon) worth between $1 billion to $1.3 billion annually (United States District Court for the District of Rhode Island, 2010). As per CW6, this loss was also because of the failed integration as Caremark had “no information on their [Horizon’s] formularies, no information on their drug costs.”
3. Lost $400 million annual contract with Chrysler United Auto Worker (UAW) retirees. Chrysler UAW fell under the newly created United Auto Workers retiree medical benefits trust, known as VEBA trust. The retirees of Ford and GM also fell under VEBA. Since Chrysler was the smallest of the three, Chrysler UAW moved to the PBM that managed Ford and GM retirees, Medco. Note that CVS Caremark continued to manage benefits for active employees and non-union retirees at Chrysler.
4. Lost $500 million annual contract with the State of Ohio on the managed Medicare business because of changes in the state’s regulatory policy to not carve out the PBM business.
5. Lost $600 of miscellaneous smaller clients that wanted to move to a smaller PBM instead of CVS Caremark.
6. Lost $1.7 billion from its Medicare Part D (Med-D) business. The loss came from “benchmark plans,” which are PDPs available under Med-D to low income subsidy (LIS) enrollees. Every year, PDPs bid on the benchmark plans in the nation’s 34 regions to provide prescription benefits to LIS. CVS Caremark only qualified for 15 regions in 2010, much lower than 28 regions in 2009, due to poor pricing.
Among all the losses, the one issue that is most worrisome and potentially systemic is the possibly pending system integration at the newly formed behemoth. As pointed out in the profitability section, it is somewhat comforting that Caremark has started to invest in the integration effort.
Management Changes
The contract loses were announced to the investor community in the Q3 2009 earnings call. Along with the announcement came the announcement that the President of Caremark, Howard McClure, was “retiring.” He was replaced by a 62-year-old PBM industry veteran, Per Lofberg. His most notable accolade was his success at Merck-Medco Managed Care as its head before the company was spun-off to become Medco Health Solutions.Although it’s too early to make a judgment on Mr. Lofberg, he has been an honest and transparent manager so far. Mr. Lofberg, in an interview with Bloomberg (Bloomberg, 2010), admitted that the PBM business at CVS is really “five segments that have not been fully integrated” and that completing the integration will be an “important initiative” over the next few years.
On a separate occasion, Mr. Lofberg admitted that the improper messaging at Caremark may have confused its clients and caused them to flee:
“I think customers are first and foremost interested in how can they save money on their benefits programs, how can they get good service for their members. And[i]they don’t really care that much if we are also a retail pharmacy chain in addition to being a PBM" (Fein, CVS Caremark: More Happy Talk, But Hard Work Remains, 2010).
This comment was made at the Q4 2009 earnings call when Mr. Lofberg was only five weeks into the job. It is commendable that so early on he had the courage to speak his mind rather speak what his boss Mr. Tom Ryan, the architect of the merger, might have liked.
Turnaround
Under his helm, Mr. Lofberg helped Caremark stabilize its client base by executing two large deals – the partnership with Aetna Inc. and the acquisition of Med-D business of United American.In July 2010, Caremark announced the longest contract in the PBM industry, one for 12-years, with Aetna Inc. to serve its 9.5 million members and to administer its $9.5 billion annual drug spending, starting Jan 2011. With this contract, Aetna became the largest customer of Caremark.
Unlike the usual contracts, this one is mostly administrative in nature. Aetna will continue to retain its PBM and outsource the following functions to CVS Caremark:
· Administration of Aetna’s retail pharmacy network and management of pharmacy customer and member service functions
· Management of purchasing, inventory management, and prescriptions fulfillment for Aetna’s mail order and specialty pharmacy operations.
The benefit to Aetna is the potential to leverage CVS Caremark’s purchasing power as the largest procurer of prescription drugs as a means to lower-prices for Aetna’s customers. The benefit to Caremark, other than been a large deal, is somewhat lower than its usual book of business. The deal is expected to be dilutive to earnings in 2010 (due to implementation costs) in the 1c to 2c range, 1c to 3c accretive in 2011, 5c accretive in 2012, and 10c accretive in 2013 and beyond. A rough back-of-the-envelope calculation suggests that the deal will generate an operating margin (EBIT/Sales) of 2.4% once the deal is fully implemented in 2013 as compared to Caremark’s operating margin of 5%. However, the big opportunity to CVS Caremark that isn’t accounted for in the above calculation is going to come if Caremark up-sells Aetna on moving to Maintenance Choice.
In Jan 2011, CVS acquired Universal American’s Med-D business for $1.25 billion. When combined together Universal American (UAM) and CVS Caremark would have been slightly larger than the second largest firm by Med-D 2010 enrollment, Humana (Fein, CVS-UAM: Part D Powehouse With Surprising Alliance, 2011). For this combination, Caremark paid a “fair” price about 8x EBITDA at UAM Med-D segment.
Figure 22: Med-D 2010 Top 10 Firms
UAM marketed its PDP known as “Community CCRx” through its PBM, MemberHealth. The plan had no mail-order benefit. Thus, the plan had been very popular with the independent pharmacies because of their obvious bias against mail-order. Independent pharmacies made up over one-third of MemberHealth’s pharmacy network and accounted for a significant percentage of prescriptions filled under the CCRx PDP. In the near term, CVS will probably leave this partnership with the community pharmacies as is. However, in the longer run, it’s very likely that Caremark will use Maintenance Choice to steer the CCRx customers away from the community pharmacies into CVS/pharmacies.
Although not game changers, the two deals in addition to the streamlining initiative indicates that the turnaround at Caremark is now under way.
This report continues in a second part that can be found at CVS Caremark Part II - Financials & Valuation.