
This is Part II of a two-part report on CVS Caremark for the April Value Contest. Part I can be found here.
(1) CVS Caremark changed its segment reporting by segregating corporate costs into a new corporate segment in 2009. Disclosure was provided for restating results of 2008 to confirm the new reporting, but not for 2007. Thus, pharmacy and retail EBITDA in 2007 included corporate expenses that have been excluded for 2008-2010. NR for corporate EBITDA means “not reported.”
Consolidated EBITDA grew at a CAGR of 9%, but free cash flow per share grew at a faster rate of 16%. Obviously, one could say that the growth was sponsored through the two acquisitions – Caremark (Q1 2007) and Longs Drugs (Q4 2008). It’s difficult to say what portion of consolidated EBITDA in 2007-2010 came from the acquired entities due to lack of financial disclosure, but it’s easy to see that CVS Caremark could sustain its free cash flow generation in 2009-2010 even in the absence of acquisitions.
Despite the contract losses of 2010, free cash flow grew by 7.5%. The decline in Pharmacy Services EBITDA was made up by the improvements in working capital management. CFO Dave Denton commented at 2010 Analyst Day that this is an area of new focus for management, since the days of large acquisitions were mostly over for CVS Caremark. Furthermore, management expects to take out a billion-dollar in inventory in 2011 and another billion in 2013.
To understand how CVS Caremark used the cash flow generated at the company, let’s drill through the sources and uses of cash.
CVS Caremark uses sales leaseback transactions for new store development by selling stores to unrelated parties and then leasing the stores back under leases accounted for as operating leases. Since this is an ongoing activity for CVS Caremark, the proceeds from sales leaseback are netted against capex in the calculation of free cash flow. This is valid because the operating cash flows already capture the cost of using the assets in its operations. If the sales leaseback transactions were sporadic, then this would not be appropriate.
Through 2007-2010, CVS generated about $10.3 billion in free cash flow and returned $10.9 billion to shareholders in return. Although this sounds really good, ask the pre-merger shareholders for their opinion. Both CVS’ and Caremark’s shareholders who were touted the benefits of the “merger of the equals” by their respective management team let their share be diluted massively, but they have not yet seen the benefits – both in terms of business performance and share price.
However, as a new shareholder of CVS Caremark, the cash allocation policy of 2007-2010, if continued in the future, is quite comforting given that CVS’ days of big acquisitions are behind. At the analyst day, Dave Denton said that acquisitions going forward will be mostly “bolt-on,” which one can interpret to be of the United American types – not requiring new equity or large amounts of cash.
Looking back, CVS paid the cash required for its acquisitions mostly by raising new debt. It raised about $4.6 billion in new debt and used $4.9 billion cash for its acquisitions. For a company that has such predictable cash flows, some amount of leverage is not such a bad thing. This takes the reader to the next topic – CVS Caremark’s balance sheet.
In addition to the long-term debt, the company also carries off-balance sheet liabilities in the form of operating/capital leases. Accounting for these leases, the debt to EBITDA ratio (adj. debt/EBITDA) is 2.7x and has been in 2.8x – 3.0x range in the last three years (CVS Caremark, 2010), which is very reasonable for a predictable business like CVS Caremark.
In conclusion, CVS Caremark’s balance sheet is in fine shape and the least of the author’s worries.
In addition, the prevalence of chronic diseases among the U.S. population has been growing at an alarming rate. The overall cost to treat these diseases is expected to grow to an even more alarming $4 trillion by 2023. Third-party payers who bear most of these costs will seek out the PBMs to improve prescription adherence among its members. Research has shown that even though adherence raises the cost of prescription drug spending, it lowers the overall health care costs due to lower utilization of the more expensive hospital care services. Thus, an increase in adherence will directly benefit the pharmacies.
Today only 14% of Caremark’s members use Maintenance Choice, but management thinks that it can get penetration to 50% over time (CVS Caremark, 2010). Last reported, $520 million prescriptions were filled at Caremark’s retail network, not accounting for the new business at Aetna and UAM. The incremental margin of moving a prescription from Caremark’s retail network to Maintenance Choice is huge.
As an illustrative example, let’s work out the additional cash flow if Caremark could move another 10% of the 500 million prescriptions retail network prescriptions to Maintenance Choice. The incremental margin when a prescription is filled at Caremark’s mail-order or CVS/pharmacy, instead of at Caremark’s retail network, for branded drugs is about a $1 and for generic drugs is about $6 (for an older generic) to $13 (for a newer generic) on a very conservative basis. For the purposes of this exercise, we use the lower number - $6.
Using CVS/pharmacy’s GDR of 70%, the incremental margin for 10% of its retail network prescriptions comes out to be:
50 million x [(0.7 GDR x $6 incremental margin on generic) + (0.4 x $1 incremental margin on branded)] = $230 million.
If most of these prescriptions are dispensed through CVS pharmacies, then the incremental cost of dispensing the additional prescriptions is insignificant. This is because most of the retail pharmacies are operating below capacity. For the ones that aren’t, CVS Caremark recently started a call center to consolidate the call traffic from the busy stores to the call center to free up some capacity at the stores. Thus, $230 million in margin drops straight to EBITDA, leading to $160 million in additional free cash flow net of taxes. This does not account for the additional acute prescriptions that members may pick up from CVS as they fill their 90-day prescriptions.
Not accounting for the windfall profits for CVS Caremark during the exclusivity period for each of these drugs, the estimated incremental EBITDA from these patent expirations is half a billion dollars!
As seen in the industry analysis section, a self-warehousing pharmacy can make an incremental profit of $4 when a $128 branded script goes off patent, i.e., the incremental margin is 3.125%. Taking CVS’ market share for the $88 billion going off patent and multiplying with the incremental margin, we get:
= $88 billion x 20% market share x 0.03125 incremental margin = $550 million
How about the one-time windfall profits from the exclusivity period for each of these drugs? When a drug enters the exlusivity period, the price of the drug falls by 20% at the most. The incremental gross margin for the chain pharmacies is in the range of 40%. The exclusivity period last for 6 months, so the math works out as follows:
= $88 billion x 0.5 (180-day exclusivity) x 20% market share x 0.4 incremental margin = $3.5 billion
As a check, compare the coming wave to the last generics wave in 2006-2007 during which CVS Caremark could boost its earnings by about 20%. However, this time around all the partipants of the drug supply chain have gotten smarter and are asking for concessions to share some of the benefits of the generics wave. So, to compensate for these demands, we will not account for the benefits that CVS will earn during the exclusivity period ($3.5 billion is a lot to give away in concessions when CVS Caremark has powerful leverage over the rest of the participants). This in the author’s opinion is a very very conservative estimate of the impact of the oncoming generic wave.
The $550 million of incremental margin drops straight to EBITDA since the costs of dispensing a branded drug is no different than a generic drug. Taking taxes out, this is $385 million of additional cash flow that will accrue to the company each year after 2015.
Using a conservative multiple of 15 times free cash flow, the generic wave and Maintenance Choice represents a present value of $5 billion (discounted from 2015 to present using 10% discount rate) i.e. 10% of its market cap today.
Expenditures on specialty drugs are expected to grow to over $300 billion dollars by 2020. Specialty drugs have been the fastest growing cost line item with a CAGR of 18% for 2008-2010.
By 2020, it is estimated that 8 out of the top 10 selling drugs (shown in green) will be specialty drugs. Currently there are over 600 new drugs in the specialty pipeline, 335 off which are in Phase II and 276 are in Phase III. Historically ~30% of the Phase II products and ~40% of the Phase III products are approved (Medco, 2010).
The economics for specialty drugs are very similar to that of branded drugs, but the average price of a specialty drug is much higher. Thus, the gross margin in dollar terms is much higher than for the traditional branded drugs. As of 2010, CVS Caremark fills or manages over $11 billion of specialty drugs annually, about 12% of its prescription revenues.
An important development to note is the new pathway laid out at the recent health care reform for the marketing approval of biosimilars, the follow-on versions of specialty drugs.
Although this is the analogous to the Hatch-Waxman Act that gave rise to the generics industry, economics research has shown that the price competition between the patented specialty drugs and their follow-on versions will be more like the one between multi-source branded drugs rather than like the one between the patented drugs and the generic drugs. So, instead of prices falling by 90% when a generic is introduced, the price for specialty drugs is expected to fall by 30%. The availability of follow-on biologics could be potentially good for the PBMs, as manufacturers may award the PBMs with rebates higher than today for preferred placement of their drug on the PBM formulary.
Over 46 biotech products worth $42 billion in sales are expected to lose patents through 2020. The earliest biosimilars opportunity is expected to be in 2013 (Medco, 2010).
CVS Caremark’s free cash flow yield based on TTM Free Cash Flow (FCF) is 6.66%. Using a conservative terminal FCF growth rate of 3% yields an expected rate of return of 9.6% (Using E(r) = FCF/Market Cap + Terminal Growth Rate derived from Gordon-Growth Model).
Remember that 2010 represents the low end of CVS Caremark’s free cash flow generation abilities due to deleveraging within the PBM segment. Free cash flow in 2011 is expected to be in the $4 billion to $4.2 billion range yielding an expected rate of return (using the same terminal growth rate of 3%) of 11% to 11.5%. This is very attractive relative to 10-year Treasuries that are yielding a mere 3.4%.
The assumption that free cash flow only grows at 3% from here on out is ridiculously conservative. This does not account for growth in free cash flow as a result of:
· Favorable demographics leading to higher drug utilization.
· Growth in gross margin as a result of oncoming generics wave.
· Opportunity to move current retail network business within Caremark to Maintenance Choice, as well as within the new book of business through Aetna contract and Med-D business at UAM.
· Improvements in working capital leading by taking out a billion dollars of inventory in 2013.
· Continued share gains from competitors (independents and weaker chains – Rite Aid).
· Streamlining initiatives leading to savings of $250 million a year until 2015 in the PBM segment.
· Replacement of expiring patented drugs with more expensive specialty drugs.
· Growth in margin with introduction of biosimilars.
Management has set a target for 2011-2015 to:
· Grow revenue by CAGR of 11% to 13% and operating profit by 9% to 11% at the PBM segment.
· Grow revenue by CAGR of 5% to 8% with same store sales at 3% to 5%, and operating profit by 8% to 10%.
If they hit their target, it would amount to free cash flow of $5.5 to $6.5 billion annually between 2011 and 2015. If the targets were cut in half, then free cash would still amount to $4.5 to $5.5 billion annually for 2011-2015. Half of their target is quite realistic given the tremendous tailwinds in the next five years.
If one assumes that:
· CVS Caremark’s free cash flow ramps up from $4 billion in 2011 to $5.5 billion in 2015 (instead of annual contribution of $4.5 billion to $5.5 billion set by half of management targets)
· Free cash flow grows by 3% in perpetuity 2015 onwards (same as assuming 15 times free cash flow).
· The discount rate is 10%
Then, DCF leads to an equity valuation of $64.5 billion for CVS Caremark, ~30% higher than its market cap today. On a per-share basis, a stock’s intrinsic value is $47 vs. today’s stock price at $36.
To understand why a 15x multiple of free cash flow is reasonable, the author refers the reader to George Gannon’s recent article: “What Is the Right Multiple to Pay for a Stock?”
CVS Caremark is also trading at a significant discount on a sum-of-parts basis to its stand-alone retail pharmacy peer Walgreens (WAG, Financial) and PBM peer Medco (MHS, Financial).
Walgreens is trading at a TTM EV/EBITDA multiple of 7.8x and its PBM peers Medco/Express Scripts are trading at an average TTM EV/EBITDA multiple of 10.9x. Applying these multiple to CVS Caremark’s two segments, backing out the intersegment eliminations and corporate EBITDA at an average of the two segment’s multiple (9.4x) gives an enterprise value of $67.1 billion.
$43.3 (retail EBITDA multiple) + $30.3 (PBM EBITDA multiple) - $6.5 (corporate & intersegment EBITDA multiple) = $67.1 billion.
Subtracting net debt of $8.6 billion gives CVS Caremark a valuation of $58.4 billion, about 18.8% higher than its market cap of $49.2 billion.
Since then, there have been many management changes. The architect of the merger, then-CEO of Caremark is now "retired." Also, the CEO of CVS, Thomas Ryan, has decided to step down in May, 2011.
The PBM segment is now led by Mr. Lofberg, who has been forthright so far about challenges that the company is facing, which is very refreshing. As outlined in detail in the PBM section of this article, this change has done a lot of good so far for the PBM segment. Mr. Lofberg bought CVS Caremark stock worth $7 million with his own funds when he took up the job (at ~$33). Mr. Ryan’s position has been filled by Larry Merlo, who has been at CVS retail for 20 years and knows the retail business better than anyone else. So, the author is of the opinion that the company is in better hands today than in the past.
Now that the two architects of the merger are no more at the company, it is likely that the new management team will look for “all ways to help shareholders realize the full value of the company” (comment by CFO Dave Denton at Analyst Day 2010). The one possibility is the spinoff of the Caremark division if management is unsuccessful at retaining or growing its PBM client base. The merger closed in March, 2007, so a spin-off after March, 2012, would be tax-free to the shareholders. This is only the author’s speculation because CFO Dave Denton specifically commented that this is not an option that is under consideration yet.
The issue that is most concerning is one of corporate governance because of the compensation of the prior management team. Mr. Ryan received $23 million each year since the merger. When compared to the better-performing PBM peers’ CEOs who received about $10 million lower, Mr. Ryan’s compensation seems egregious.
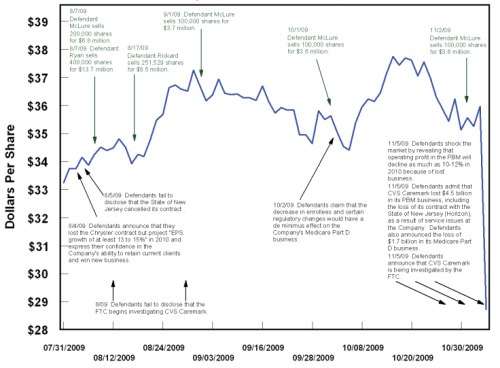
The other concerning issue is the selling of a large quantity of shares by the insiders a year prior to the announcement of the contract losses in the PBM segment. Whether the selling by the insiders was based on material non-public information is the subject of an ongoing class action suit against CVS Caremark (United States District Court for the District of Rhode Island, 2010). The author does not have an opinion on this matter, but it is troubling, and one to watch out for among the members of the new management team.
· Continued retention and growth of net business within the PBM segment as per management targets.
· Growth in free cash flow as per management’s targets.
ASPE Staff. (2010). Expanding the Use of Generics.
Avalere Health LLC. (2006). Follow the Dollar / Understanding Drug Prices and Beneficiary Costs Under Medicare Part D.
Bloomberg. (2010). CVS to Invest 'Substantial' Amounts in Caremark Units.
CBO. (1998). How increased competition from generic drugs has affected prices and returns in the pharmaceutical industry.
CBO. (2004). Medicaid's Reimbursements to Pharmacies for Prescription Drugs.
CBO. (2007). Prescription Drug Pricing in the Private Sector.
CVS Caremark. (2009). Analyst Day.
CVS Caremark. (2010). Analyst Day.
Fein, D. A. (2010). CVS Caremark: More Happy Talk, But Hard Work Remains.
Fein, D. A. (2007). CVS' Channel Power.
Fein, D. A. (2011). CVS-UAM: Part D Powehouse With Surprising Alliance.
Fein, D. A. (2010). CVS-WAG: Going from Bad to Atrocious.
FTC. (2009). Emerging Health Care Issues: Follow-on biologic drug competition.
Kaiser Family Foundation. (2005). Follow the Pill: Understanding the U.S. Commercial Pharmaceutical Supply Chain.
Martinez, B. (2006). How Quiet Moves by a Publisher Sway Billions in Drug Spending. Wall Street Journal.
Medco. (2010). Analyst Day.
Morgan Lewis. (2010). Healthcare Reform Law: A New Pathway for Biosimilar Products.
Seeking Alpha. (2009). CVS Caremark Q3 2009 Earnings Call.
Segrave, F. (2004). Medicaid Prescription Drug Reimbursement: Why the Government Pays Too Much.
Steiner, A. M. (1985). Generic Substitution and Prescription Drug Prices: Economic Effects of State Drug Product Selection Laws. FTC.
United States District Court for the District of Rhode Island. (2010). Richard Medoff vs. CVS Caremark Corporation, Thomas Ryan, David Rickard, and Howard McLure.
Wikipedia. CVS Pharmacy.
Cash Flow Generation
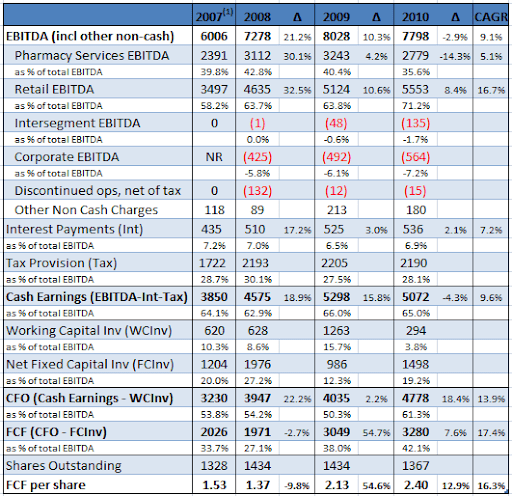
To understand the real earnings power of CVS Caremark, let’s examine its free cash flow statement (constructed using CVS Caremark’s supplemental disclosure and cash flow statement).Figure 23: CVS Caremark 2007-2010 Free Cash Flow Data
(1) CVS Caremark changed its segment reporting by segregating corporate costs into a new corporate segment in 2009. Disclosure was provided for restating results of 2008 to confirm the new reporting, but not for 2007. Thus, pharmacy and retail EBITDA in 2007 included corporate expenses that have been excluded for 2008-2010. NR for corporate EBITDA means “not reported.”
Consolidated EBITDA grew at a CAGR of 9%, but free cash flow per share grew at a faster rate of 16%. Obviously, one could say that the growth was sponsored through the two acquisitions – Caremark (Q1 2007) and Longs Drugs (Q4 2008). It’s difficult to say what portion of consolidated EBITDA in 2007-2010 came from the acquired entities due to lack of financial disclosure, but it’s easy to see that CVS Caremark could sustain its free cash flow generation in 2009-2010 even in the absence of acquisitions.
Despite the contract losses of 2010, free cash flow grew by 7.5%. The decline in Pharmacy Services EBITDA was made up by the improvements in working capital management. CFO Dave Denton commented at 2010 Analyst Day that this is an area of new focus for management, since the days of large acquisitions were mostly over for CVS Caremark. Furthermore, management expects to take out a billion-dollar in inventory in 2011 and another billion in 2013.
To understand how CVS Caremark used the cash flow generated at the company, let’s drill through the sources and uses of cash.
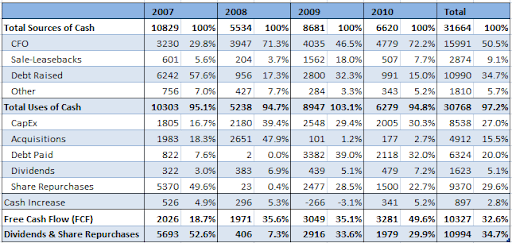
Figure 24: CVS Caremark 2007-2010 Sources/Uses of Cash
CVS Caremark uses sales leaseback transactions for new store development by selling stores to unrelated parties and then leasing the stores back under leases accounted for as operating leases. Since this is an ongoing activity for CVS Caremark, the proceeds from sales leaseback are netted against capex in the calculation of free cash flow. This is valid because the operating cash flows already capture the cost of using the assets in its operations. If the sales leaseback transactions were sporadic, then this would not be appropriate.
Through 2007-2010, CVS generated about $10.3 billion in free cash flow and returned $10.9 billion to shareholders in return. Although this sounds really good, ask the pre-merger shareholders for their opinion. Both CVS’ and Caremark’s shareholders who were touted the benefits of the “merger of the equals” by their respective management team let their share be diluted massively, but they have not yet seen the benefits – both in terms of business performance and share price.
However, as a new shareholder of CVS Caremark, the cash allocation policy of 2007-2010, if continued in the future, is quite comforting given that CVS’ days of big acquisitions are behind. At the analyst day, Dave Denton said that acquisitions going forward will be mostly “bolt-on,” which one can interpret to be of the United American types – not requiring new equity or large amounts of cash.
Looking back, CVS paid the cash required for its acquisitions mostly by raising new debt. It raised about $4.6 billion in new debt and used $4.9 billion cash for its acquisitions. For a company that has such predictable cash flows, some amount of leverage is not such a bad thing. This takes the reader to the next topic – CVS Caremark’s balance sheet.
Balance Sheet
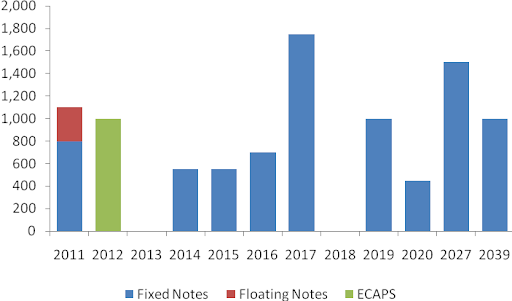
CVS Caremark carries $9.6 billion in long-term debt on its balance sheet. However, for a company that has predictable cash flows, the debt is not of much concern. Furthermore, debt maturing in the next five years is small ($3.2 billion) relative to its historical cash-flow generation through the last four years ($10 billion free cash flow aggregate). Almost all the long-term debt is fixed in nature and is well staggered.Figure 25: CVS Debt 2011-2039
In addition to the long-term debt, the company also carries off-balance sheet liabilities in the form of operating/capital leases. Accounting for these leases, the debt to EBITDA ratio (adj. debt/EBITDA) is 2.7x and has been in 2.8x – 3.0x range in the last three years (CVS Caremark, 2010), which is very reasonable for a predictable business like CVS Caremark.
In conclusion, CVS Caremark’s balance sheet is in fine shape and the least of the author’s worries.
Outlook
CVS Caremark has tremendous tailwinds that are expected to help it grow its free cash flow at the same rate, if not better, than the last five years.Aging Population & Rise in Chronic Diseases
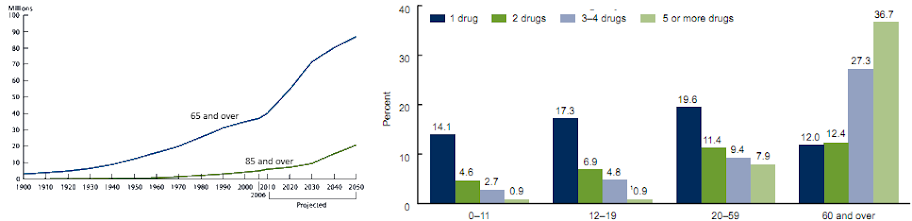
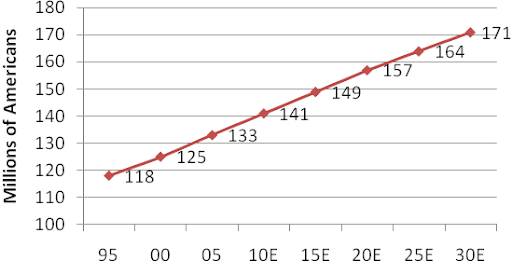
The population of age 65 and older is expected to grow by 65% from 2008 to 2025, which in turn will help growth in utilization of prescription drugs. The age group of 65 and older uses three times more prescription drugs than the age group younger than 65.Figure 26: Aging U.S. Population & Prescription Use by Age
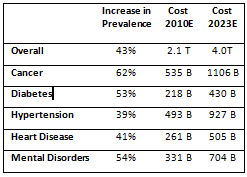
In addition, the prevalence of chronic diseases among the U.S. population has been growing at an alarming rate. The overall cost to treat these diseases is expected to grow to an even more alarming $4 trillion by 2023. Third-party payers who bear most of these costs will seek out the PBMs to improve prescription adherence among its members. Research has shown that even though adherence raises the cost of prescription drug spending, it lowers the overall health care costs due to lower utilization of the more expensive hospital care services. Thus, an increase in adherence will directly benefit the pharmacies.
Figure 27: Prevalence of Chronic Diseases
Importance of Adherence & Maintenance Choice
Adherence is also known to increase when the patient can interact face-to-face with the pharmacist. Thus, plans like Maintenance Choice at CVS Caremark that offer to dispense 90-day prescriptions at retail locations at the same cost as the mail-order have started gaining more popularity. More recently, Walgreens also started a “90-day at Retail” program to encourage customers to fill their 90-day prescriptions at their local Walgreens pharmacy (instead of the mail-order). The main difference is that Walgreens does not own a PBM and thus cannot offer to fill at retail at the same cost as at an integrated retail-PBM CVS Caremark. Such a trend also means that independent pharmacies will continue to lose market share as they that cannot fill 90-day medications at the same cost as CVS Caremark.Today only 14% of Caremark’s members use Maintenance Choice, but management thinks that it can get penetration to 50% over time (CVS Caremark, 2010). Last reported, $520 million prescriptions were filled at Caremark’s retail network, not accounting for the new business at Aetna and UAM. The incremental margin of moving a prescription from Caremark’s retail network to Maintenance Choice is huge.
As an illustrative example, let’s work out the additional cash flow if Caremark could move another 10% of the 500 million prescriptions retail network prescriptions to Maintenance Choice. The incremental margin when a prescription is filled at Caremark’s mail-order or CVS/pharmacy, instead of at Caremark’s retail network, for branded drugs is about a $1 and for generic drugs is about $6 (for an older generic) to $13 (for a newer generic) on a very conservative basis. For the purposes of this exercise, we use the lower number - $6.
Using CVS/pharmacy’s GDR of 70%, the incremental margin for 10% of its retail network prescriptions comes out to be:
50 million x [(0.7 GDR x $6 incremental margin on generic) + (0.4 x $1 incremental margin on branded)] = $230 million.
If most of these prescriptions are dispensed through CVS pharmacies, then the incremental cost of dispensing the additional prescriptions is insignificant. This is because most of the retail pharmacies are operating below capacity. For the ones that aren’t, CVS Caremark recently started a call center to consolidate the call traffic from the busy stores to the call center to free up some capacity at the stores. Thus, $230 million in margin drops straight to EBITDA, leading to $160 million in additional free cash flow net of taxes. This does not account for the additional acute prescriptions that members may pick up from CVS as they fill their 90-day prescriptions.
Impact of Health Care Reform
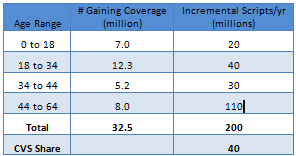
One of the byproducts of the Affordable Care Act (ACA) signed by President Obama is that an additional 32 million people will gain coverage by 2019. Possibly half of the population will gain coverage of prescription benefits through Med-D. CVS Caremark’s second largest position in Med-D, post its acquisition of UAM, will help it capture this additional business. In total, CVS with its 20% market share could gain an additional 40 million prescriptions annually – i.e., 5% growth in volume over its 2010 prescriptions.Figure 29: Health Reform & Increased Coverage
Generics Wave
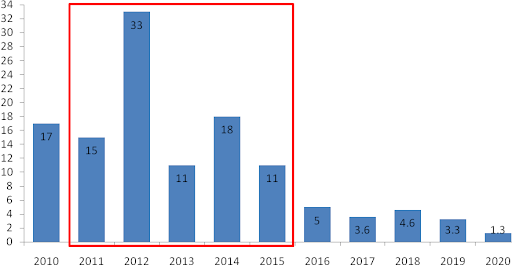
The most significant tailwind that is expected to boost CVS Caremark’s growth over the next five years is the coming “generic wave” – created by patent expirations of an astonishing $88 billion! (Medco, 2010)Figure 30: 2010-2015 Dollar Value of Branded Drugs Going Off-Patent
Not accounting for the windfall profits for CVS Caremark during the exclusivity period for each of these drugs, the estimated incremental EBITDA from these patent expirations is half a billion dollars!
As seen in the industry analysis section, a self-warehousing pharmacy can make an incremental profit of $4 when a $128 branded script goes off patent, i.e., the incremental margin is 3.125%. Taking CVS’ market share for the $88 billion going off patent and multiplying with the incremental margin, we get:
= $88 billion x 20% market share x 0.03125 incremental margin = $550 million
How about the one-time windfall profits from the exclusivity period for each of these drugs? When a drug enters the exlusivity period, the price of the drug falls by 20% at the most. The incremental gross margin for the chain pharmacies is in the range of 40%. The exclusivity period last for 6 months, so the math works out as follows:
= $88 billion x 0.5 (180-day exclusivity) x 20% market share x 0.4 incremental margin = $3.5 billion
As a check, compare the coming wave to the last generics wave in 2006-2007 during which CVS Caremark could boost its earnings by about 20%. However, this time around all the partipants of the drug supply chain have gotten smarter and are asking for concessions to share some of the benefits of the generics wave. So, to compensate for these demands, we will not account for the benefits that CVS will earn during the exclusivity period ($3.5 billion is a lot to give away in concessions when CVS Caremark has powerful leverage over the rest of the participants). This in the author’s opinion is a very very conservative estimate of the impact of the oncoming generic wave.
The $550 million of incremental margin drops straight to EBITDA since the costs of dispensing a branded drug is no different than a generic drug. Taking taxes out, this is $385 million of additional cash flow that will accrue to the company each year after 2015.
Using a conservative multiple of 15 times free cash flow, the generic wave and Maintenance Choice represents a present value of $5 billion (discounted from 2015 to present using 10% discount rate) i.e. 10% of its market cap today.
Specialty Drugs
The one worry that investors have is about the generics patent cliff post 2015. This is somewhat valid because the pipeline of branded drugs expiring from 2016-2020 is $17.8 billion, which is five times smaller than the 2011-2015 pipeline. Herein enters Specialty Drugs.Expenditures on specialty drugs are expected to grow to over $300 billion dollars by 2020. Specialty drugs have been the fastest growing cost line item with a CAGR of 18% for 2008-2010.
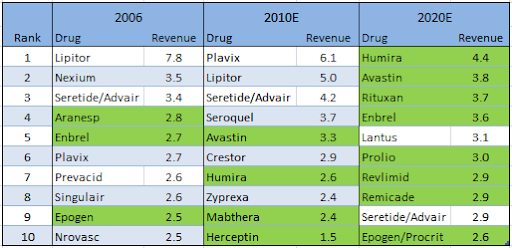
Figure 31: Projected Change in Top 10 Drug Mix 2006-2020
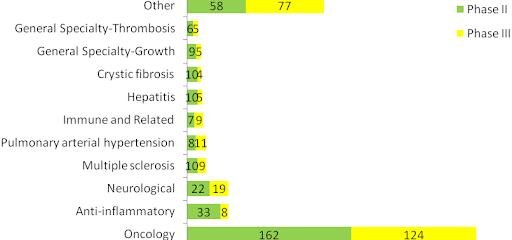
By 2020, it is estimated that 8 out of the top 10 selling drugs (shown in green) will be specialty drugs. Currently there are over 600 new drugs in the specialty pipeline, 335 off which are in Phase II and 276 are in Phase III. Historically ~30% of the Phase II products and ~40% of the Phase III products are approved (Medco, 2010).
Figure 32: Specialty Drugs Pipeline
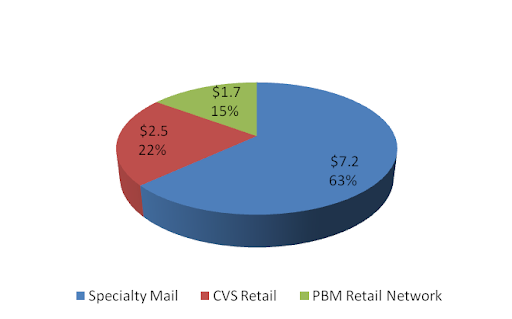
The economics for specialty drugs are very similar to that of branded drugs, but the average price of a specialty drug is much higher. Thus, the gross margin in dollar terms is much higher than for the traditional branded drugs. As of 2010, CVS Caremark fills or manages over $11 billion of specialty drugs annually, about 12% of its prescription revenues.
Figure 33: CVS Caremark Specialty Revenue Mix
An important development to note is the new pathway laid out at the recent health care reform for the marketing approval of biosimilars, the follow-on versions of specialty drugs.
Although this is the analogous to the Hatch-Waxman Act that gave rise to the generics industry, economics research has shown that the price competition between the patented specialty drugs and their follow-on versions will be more like the one between multi-source branded drugs rather than like the one between the patented drugs and the generic drugs. So, instead of prices falling by 90% when a generic is introduced, the price for specialty drugs is expected to fall by 30%. The availability of follow-on biologics could be potentially good for the PBMs, as manufacturers may award the PBMs with rebates higher than today for preferred placement of their drug on the PBM formulary.
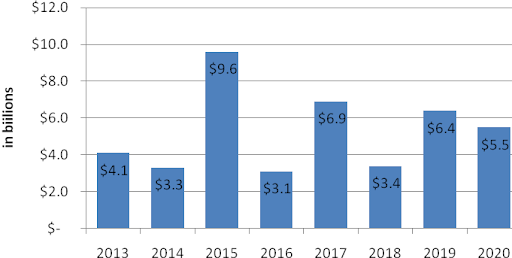
Over 46 biotech products worth $42 billion in sales are expected to lose patents through 2020. The earliest biosimilars opportunity is expected to be in 2013 (Medco, 2010).
Figure 34: Dollar Value of Specialty Drugs Going Off-Patent
Valuation
CVS Caremark’s valuation is based on its April 15, 2010 share price of $36 and market cap of $49.2 billion.CVS Caremark’s free cash flow yield based on TTM Free Cash Flow (FCF) is 6.66%. Using a conservative terminal FCF growth rate of 3% yields an expected rate of return of 9.6% (Using E(r) = FCF/Market Cap + Terminal Growth Rate derived from Gordon-Growth Model).
Remember that 2010 represents the low end of CVS Caremark’s free cash flow generation abilities due to deleveraging within the PBM segment. Free cash flow in 2011 is expected to be in the $4 billion to $4.2 billion range yielding an expected rate of return (using the same terminal growth rate of 3%) of 11% to 11.5%. This is very attractive relative to 10-year Treasuries that are yielding a mere 3.4%.
The assumption that free cash flow only grows at 3% from here on out is ridiculously conservative. This does not account for growth in free cash flow as a result of:
· Favorable demographics leading to higher drug utilization.
· Growth in gross margin as a result of oncoming generics wave.
· Opportunity to move current retail network business within Caremark to Maintenance Choice, as well as within the new book of business through Aetna contract and Med-D business at UAM.
· Improvements in working capital leading by taking out a billion dollars of inventory in 2013.
· Continued share gains from competitors (independents and weaker chains – Rite Aid).
· Streamlining initiatives leading to savings of $250 million a year until 2015 in the PBM segment.
· Replacement of expiring patented drugs with more expensive specialty drugs.
· Growth in margin with introduction of biosimilars.
Management has set a target for 2011-2015 to:
· Grow revenue by CAGR of 11% to 13% and operating profit by 9% to 11% at the PBM segment.
· Grow revenue by CAGR of 5% to 8% with same store sales at 3% to 5%, and operating profit by 8% to 10%.
If they hit their target, it would amount to free cash flow of $5.5 to $6.5 billion annually between 2011 and 2015. If the targets were cut in half, then free cash would still amount to $4.5 to $5.5 billion annually for 2011-2015. Half of their target is quite realistic given the tremendous tailwinds in the next five years.
If one assumes that:
· CVS Caremark’s free cash flow ramps up from $4 billion in 2011 to $5.5 billion in 2015 (instead of annual contribution of $4.5 billion to $5.5 billion set by half of management targets)
· Free cash flow grows by 3% in perpetuity 2015 onwards (same as assuming 15 times free cash flow).
· The discount rate is 10%
Then, DCF leads to an equity valuation of $64.5 billion for CVS Caremark, ~30% higher than its market cap today. On a per-share basis, a stock’s intrinsic value is $47 vs. today’s stock price at $36.
To understand why a 15x multiple of free cash flow is reasonable, the author refers the reader to George Gannon’s recent article: “What Is the Right Multiple to Pay for a Stock?”
CVS Caremark is also trading at a significant discount on a sum-of-parts basis to its stand-alone retail pharmacy peer Walgreens (WAG, Financial) and PBM peer Medco (MHS, Financial).
Walgreens is trading at a TTM EV/EBITDA multiple of 7.8x and its PBM peers Medco/Express Scripts are trading at an average TTM EV/EBITDA multiple of 10.9x. Applying these multiple to CVS Caremark’s two segments, backing out the intersegment eliminations and corporate EBITDA at an average of the two segment’s multiple (9.4x) gives an enterprise value of $67.1 billion.
$43.3 (retail EBITDA multiple) + $30.3 (PBM EBITDA multiple) - $6.5 (corporate & intersegment EBITDA multiple) = $67.1 billion.
Subtracting net debt of $8.6 billion gives CVS Caremark a valuation of $58.4 billion, about 18.8% higher than its market cap of $49.2 billion.
Management
Management has done a fine job at CVS retail over the last decade. However, execution at the PBM segment has been quite the opposite. In addition, the merger has destroyed value for the pre-merger shareholders so far.Since then, there have been many management changes. The architect of the merger, then-CEO of Caremark is now "retired." Also, the CEO of CVS, Thomas Ryan, has decided to step down in May, 2011.
The PBM segment is now led by Mr. Lofberg, who has been forthright so far about challenges that the company is facing, which is very refreshing. As outlined in detail in the PBM section of this article, this change has done a lot of good so far for the PBM segment. Mr. Lofberg bought CVS Caremark stock worth $7 million with his own funds when he took up the job (at ~$33). Mr. Ryan’s position has been filled by Larry Merlo, who has been at CVS retail for 20 years and knows the retail business better than anyone else. So, the author is of the opinion that the company is in better hands today than in the past.
Now that the two architects of the merger are no more at the company, it is likely that the new management team will look for “all ways to help shareholders realize the full value of the company” (comment by CFO Dave Denton at Analyst Day 2010). The one possibility is the spinoff of the Caremark division if management is unsuccessful at retaining or growing its PBM client base. The merger closed in March, 2007, so a spin-off after March, 2012, would be tax-free to the shareholders. This is only the author’s speculation because CFO Dave Denton specifically commented that this is not an option that is under consideration yet.
The issue that is most concerning is one of corporate governance because of the compensation of the prior management team. Mr. Ryan received $23 million each year since the merger. When compared to the better-performing PBM peers’ CEOs who received about $10 million lower, Mr. Ryan’s compensation seems egregious.
The other concerning issue is the selling of a large quantity of shares by the insiders a year prior to the announcement of the contract losses in the PBM segment. Whether the selling by the insiders was based on material non-public information is the subject of an ongoing class action suit against CVS Caremark (United States District Court for the District of Rhode Island, 2010). The author does not have an opinion on this matter, but it is troubling, and one to watch out for among the members of the new management team.
Figure35: CVS Caremark Insider Selling 2009
Risks
The possibility of continued client losses and/or the failure to win new business within the PBM segment is one of the primary risks (something that can cause a permanent loss in capital) the author sees with an investment in CVS Caremark.Catalysts
· Continued retention and growth of net business within the PBM segment as per management targets.
· Growth in free cash flow as per management’s targets.
Disclosure
This is not a recommendation to buy or sell any security mentioned in this article. The author has a long position in CVS Caremark that he initiated at an average price of $33.Bibliography
Abrams, L. W. (2008). Quantifying Medco's Business Model: An Update.ASPE Staff. (2010). Expanding the Use of Generics.
Avalere Health LLC. (2006). Follow the Dollar / Understanding Drug Prices and Beneficiary Costs Under Medicare Part D.
Bloomberg. (2010). CVS to Invest 'Substantial' Amounts in Caremark Units.
CBO. (1998). How increased competition from generic drugs has affected prices and returns in the pharmaceutical industry.
CBO. (2004). Medicaid's Reimbursements to Pharmacies for Prescription Drugs.
CBO. (2007). Prescription Drug Pricing in the Private Sector.
CVS Caremark. (2009). Analyst Day.
CVS Caremark. (2010). Analyst Day.
Fein, D. A. (2010). CVS Caremark: More Happy Talk, But Hard Work Remains.
Fein, D. A. (2007). CVS' Channel Power.
Fein, D. A. (2011). CVS-UAM: Part D Powehouse With Surprising Alliance.
Fein, D. A. (2010). CVS-WAG: Going from Bad to Atrocious.
FTC. (2009). Emerging Health Care Issues: Follow-on biologic drug competition.
Kaiser Family Foundation. (2005). Follow the Pill: Understanding the U.S. Commercial Pharmaceutical Supply Chain.
Martinez, B. (2006). How Quiet Moves by a Publisher Sway Billions in Drug Spending. Wall Street Journal.
Medco. (2010). Analyst Day.
Morgan Lewis. (2010). Healthcare Reform Law: A New Pathway for Biosimilar Products.
Seeking Alpha. (2009). CVS Caremark Q3 2009 Earnings Call.
Segrave, F. (2004). Medicaid Prescription Drug Reimbursement: Why the Government Pays Too Much.
Steiner, A. M. (1985). Generic Substitution and Prescription Drug Prices: Economic Effects of State Drug Product Selection Laws. FTC.
United States District Court for the District of Rhode Island. (2010). Richard Medoff vs. CVS Caremark Corporation, Thomas Ryan, David Rickard, and Howard McLure.
Wikipedia. CVS Pharmacy.