

Take a look at this 10-year chart for earnings per share and Ebitda at the discount retailer Big Lots Inc. (BIG, Financial).

To put the key data points into words, earnings per share jumped from $3.07 per share in July 2019 to $18.19 in July 2020, and back down to $7.06 per share in July 2021. Ebitda follows the same path.
What are we seeing?
About Big Lots
The company operates a chain of discount stores, more than 1,400 of them, in the U.S. It provided this information in its third-quarter 2021 investor presentation:

It also has been growing and optimizing its e-commerce operations:

Over the past few years, the company has been transforming itself, using what it calls Operation North Star:

When I last wrote about Big Lots in December 2020, the company looked promising thanks to the North Star initiatives. Since then, however, we have seen a turn in the company’s fortunes.
To look for more insight into the situation, let’s go back to the 10-year chart and add a trendline (and using just earnings per share for simplicity):

It appears we are seeing a reversion to the mean, meaning the second half of 2019 and first half of 2020 were outliers. So the current earnings per share and Ebitda numbers may have overshot the mean, but they are in the right ballpark.
Is the company still worth owning, given the pullback? Let’s look at the fundamentals.
Competition
Discount retail is a crowded field, and Big Lots faces competition from some of the biggest and best-managed retailers in the world, a list that includes Walmart (WMT, Financial), Dollar General (DG, Financial) and Costco (COST, Financial). As this 10-year chart indicates, Big Lots has lagged the others:

Still, management argued in the 10-K for 2020 that it has several moats protecting its pricing and margins:
- In Furniture, management noted its believes the "competitive advantage is attributable to our sourcing relationships, our in-store availability, and everyday value offerings.”
- In regard to Seasonal, the company has "a competitive advantage in this category by offering trend-right products with a strong value proposition in our own brands.” It also noted that “much of this merchandise is sourced on an import basis, which allows us to maintain our competitive pricing.”
- Last but not least, Big Lots has "a competitive advantage in the Food and Consumables categories based on our sourcing capabilities for closeout merchandise.”
The following comparison of net margins among the four discounters adds weight to the proposition that Big Lots is reverting to the mean:

Note that the net margins of Dollar General and Walmart also began to decline in April 2020.
Risks
According to the 10-K, the company faces risks in multiple areas, including:
- Operational risks involve the typical challenges facing retailers, including inventory levels, merchandise that meets customers’ changing preferences, store locations and IT systems.
- Economic conditions, which Big Lots said can have a direct impact on its operations.
- Regulatory affairs also have an impact. The company said, “Global sourcing of many of the products we sell is an important factor in driving higher operating profit. During 2020, we purchased approximately 21% of our products, at cost, directly from overseas vendors, including 13% from vendors located in China.” Changes in tariffs, for example, would affect its revenue and profitability.
Financial strength

Big Lots receives just a middling score for financial strength. According to this chart on its Summary page, Big Lots has increased its debt:

At the same time, though, we see it has a comfortable interest coverage ratio. Is there something else going on here?
Indeed, there is. As Praveen Chawla pointed out in a comment on my December 2020 discussion, “Most of the debt is actually capital lease obligations, which was always there but due to change in accounting rules has to be now shown on the balance sheet.”
Checking the current financials, we see Big Lots posted the following figures at the end of October 2021 (the end of its third quarter):
- Short-term debt: $0.
- Long-term debt: $0.
- Long-term capital lease obligations: $1.58 billion.
Those lease obligations cover future “rent” for its physical stores. The company plans to open a net 50 new stores in 2022, so we can expect this line item to continue to rise.
At the bottom of the table, we see that ROIC is greater than WACC, which is positive news. The return on invested capital is 8.22%, while the weighted average cost of capital is 6.82%.
Turning to free cash flow, it, too, appears to be reverting to the mean after dramatic dips and sharp rises:

Overall, Big Lots appears to deserve a higher score than 5 out of 10 because long-term debt was lumped in with long-term capital lease obligations.
Profitability

We know that Big Lots enjoys better margins than most retail–defensive companies. For example, we see it has a higher net margin than 72.38% of peers and competitors. Its comparisons with the its own history are not as robust, but we shouldn’t expect much green in the wake of the big spike.
Regardless, the return on equity of 18.81% is nearly twice the industry median of 9.45%.
Even more encouraging news comes from the growth lines. Over the past three years, average revenue growth of 9.6% per year is nearly triple the industry median of 3.3%. What’s more, it has generated that growth while in competition with the likes of Costco and Walmart.
Both Ebitda and earnings per share growth far exceed revenue growth, which tells us management is doing an excellent job of managing its capital. Undoubtedly, those metrics get a boost from e-commerce, which requires no costly retail space.
Performance
We’ve shown Big Lots’ performance against the three big competitors already; now we have a GuruFocus table showing its annualized returns and its total returns:

Note the bumpiness of those returns. Not surprisingly, it has just a 2. 5 out of five-star rating for predictability.
The stock with which it is being compared is PriceSmart Inc. (PSMT, Financial).
Dividends

One effect of the recent price slide has been an improvement in the dividend yield. At 2.76%, it is well above the industry median of 2.01%. The dividend payout ratio of 19% is relatively low and leaves room for future increases.
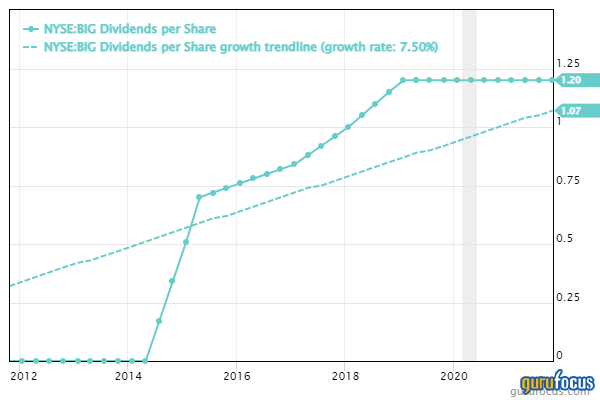
As for the dividend payments, the following chart shows they’ve grown an average of 7.5% per year, which is above even the current inflation rate:
Shares
Big Lots has been even more consistent in reducing its share count over the past decade:

Here’s how the shares are divvied up:
President and CEO Bruce K. Thorn is the biggest individual shareholder with 167,536 shares as of Oct. 15, 2021.
Valuation

The price-earnings ratio and PEG ratio are significantly lower than the industry median, as signified by the deep green bars. The price-book and price-sales ratios are also lower than the industry median, but not so strongly. All these metrics suggest the company is undervalued.
The GF Value Line comes to the same conclusion:

The discounted cash flow calculator finds even more value with a 73.05% margin of safety. However, investors would be wise to put less weight on the DCF since it is based on a predictability rating of only 2.5 stars.

Overall, it seems clear that Big Lots is undervalued. Yet, that assessment is partly driven by what may have been a one-time spike in the fundamentals and the share price.
If it is a stock that has reverted to the mean, then perhaps we should see the share price as fairly valued. Let’s look at a 10-year price chart:

As the trendline shows, the current price is slightly higher than the 10-year average price of $42.73. That works out to a 4% difference and suggests a fair valuation.
It’s also a better valuation than the three big competitors listed above. These are their current scores:
- Big Lots: 9 out of 10.
- Costco: 1 out of 10.
- Dollar General: 2 out of 10.
- Walmart: 2 out of 10.
Gurus
In the third (calendar) quarter of 2021, the gurus traded Big Lots 455 times. They were selling more often than they were buying:

At the end of the quarter, seven of them held positions. The three largest were those of:
- John Hussman (Trades, Portfolio) of Hussman Strategic Advisors, who held 68,200 shares, an increase of 10% during the quarter. Those shares represented 0.21% of Big Lots’ shares and 0.65% of his fund's assets under management.
- Ray Dalio (Trades, Portfolio)'s Bridgewater Associates reduced its stake by 2.6% and finished the quarter with 59,081 shares.
- Robert Olstein (Trades, Portfolio) of Olstein Capital Management, who added 59.46% to finish with 59,000 shares.
Conclusion
The evidence suggests Big Lots' stock reverted to the mean. Of course, the metrics and share price could fall quite a bit more or shoot back up again. However, I think it is more likely the company will keep growing near the rate it has grown on average over the past decade.
It is a well-managed company. First, it is essentially debt-free and profitable. Second, while Costco, Dollar General and Walmart may have outperformed it, it is significantly less expensive. Third, it has a decent dividend, and one that should outpace inflation in coming years.
Value investors who see the company as undervalued and debt-free may wish to study it, especially if they want a defensive stock. Growth investors will want to wait and see to determine whether the share price really will head up again. Finally, income investors will probably look elsewhere for stocks with richer dividends and better predictability scores.