

Sometimes, you’re willing to forgo potentially big gains for a stock that lets you sleep at night, because the share price stays steady. The Cooper Companies Inc. (COO, Financial) delivers that steadiness—and has beaten the S&P 500 ETF Trust (SPY, Financial) (a proxy for the S&P 500) by an average of 3.39% per year over the past 10 years:

About The Cooper Companies
Based in San Ramone, California, the corporation calls itself an “Industry-leader in Vision and Women’s Health”:

Source: The company's Jan. 11 investor presentation.
According to its 10-K for the fiscal year ended Oct. 31, 2021, CooperVision develops, manufactures and markets soft contact lenses in various advanced materials and optics. That includes its MiSight 1-day lens, which it calls the “first and only FDA-approved product indicated to slow the progression of myopia in children with treatment initiated between the ages of 8-12.”
CooperSurgical focuses on the health of women, babies and families, with a “diversified portfolio” of medical devices, fertility diagnostics and contraception.
For fiscal year 2021, the company’s revenue was $2.92 billion:
- CooperVision: $2.15 billion.
- CooperSurgical: $771 million.
In a bid to boost the surgical division, the company announced on Nov. 10 that it planned to acquire Generate Life Sciences, “a privately held leading provider of donor egg and sperm for fertility treatments, fertility cryopreservation services and newborn stem cell storage (cord blood & cord tissue).” The $1.6 billion deal closed on Dec. 17.
Growth
The company sees several drivers of growth for the surgical side, according to an investor presentation dated Jan. 11:
- Increasing maternal age.
- Greater access to treatment.
- Increased patient awareness/comfort.
- Higher worldwide disposable income.
Up to one in eight couples suffer from infertility worldwide.
On the contact lens side, it sees three major drivers of growth:
- New fittings and trade-ups.
- A growing wearer base globally (currently, one-third of the world’s population is myopic--by 2050, the number is expected to grow to one half of the world’s population, 4.7 billion people).
- Higher net pricing.
For fiscal 2022, the company expects revenue to increase, in both segments, by 6% to 8%. It also expects earnings per share to rise to between $13.60 and $14 per share. That would represent an increase of 9.5% to 12.5%.
Competition
The 10-K lists three main competitors for CooperVision: Johnson & Johnson Vision Care Inc. (JNJ, Financial), Alcon Inc. (ALC, Financial) and Bausch Health Companies Inc. (BHC, Financial).
For CooperSurgical, it references Vitrolife (VITR), AbbVie (ABBV, Financial) and Hamilton Thorne (HTL).
Both the operating and net margins are above average for the medical devices and instruments industry, indicating Cooper has one or more competitive advantages.
Risks
Risks named in the 10-K include:
- Changes in the global or regional business, political and economic conditions could harm operating and financial results. Such risks include Covid-19, trade barriers such as tariffs and inflation.
- Tax laws or their interpretation, particularly in the United Kingdom and the United States.
- Foreign currency and interest rate fluctuations could decrease net sales and earnings.
- Variable-rate debts: If rates rise, the company’s financial results could be adversely affected, or it might be limited in its ability to borrow additional funds.
- Cooper has grown and expects to continue growing through acquisitions, so unsuccessful efforts could cause numerous problems.
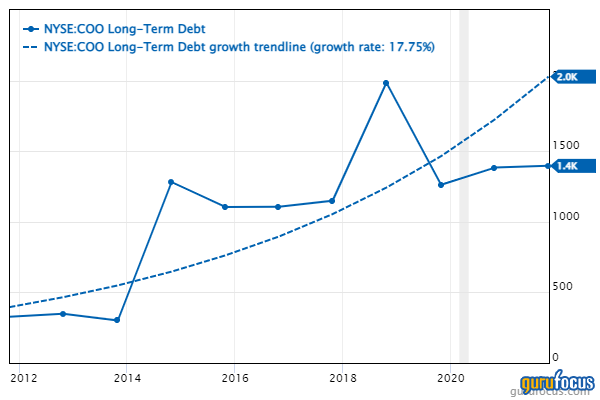
Financial strength
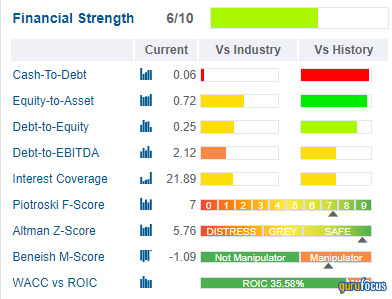
After a couple of sharp rises in the past decade, Coopers slowed the growth of debt in the past three years:
Cooper’s debt has grown over the past decade, but apparently that borrowed capital was wisely allocated. As this chart shows, total assets have grown faster than total liabilities:

Despite the growing debt, interest coverage is comfortable and roughly on par with other companies in the industry.
That also suggests the company’s free cash flow should be strong, and it is, after recovering from the steep downturns in fiscal 2019 and fiscal 2020:

Profitability

Cooper receives a high mark for its profitability, but to some extent, it is biased by a transfer of assets that led to a tax benefit and an extremely high earnings per share—for one year only. The company explained in its 10-K for fiscal 2021 that diluted earnings had increased 1,131% from the previous year:
“As discussed in Note 6 to the consolidated financial statements, the Company completed an intra-group transfer of certain intellectual property and related assets of the CooperVision business to a United Kingdom subsidiary during the year ended October 31, 2021. As a result of the transfer, the Company recognized a deferred tax asset of $1,987.9 million, with a corresponding income tax benefit, based on the fair value of the transferred intangible assets.”
Still, the company has outstanding margins, and the net margin is an industry leader.
Revenue has grown by less than 5% per year over the past three years, but as we saw above, that’s expected to increase to 6% to 8% in fiscal 2022.
Performance
While Cooper beats the S&P 500 on a 10-year basis, it has seen the S&P 500 catch up in fiscal 2021:

GuruFocus displays Cooper's returns:
Annualized returns:
- One year: 5.64%
- Three years: 12.09%
- Five years: 16.01%
- 10 years: 18.26%.
Total annual returns:
- 2022 year to date: -8.05%
- 2021: 15.31%
- 2020: 13.08%
- 2019: 26.24%
- 2018: 16.81%
- 2017: 24.55%
Both sets of returns indicate a company that has slowed in the past two years.
Dividends
This chart of the dividend yield tells us all we need to know:

Cooper has paid an annual dividend of 6 cents per share since 2004.
Shares
Nor have shareholders received any rewards through significant share repurchases:

In its 10-K, the company reported that it bought back 69,600 shares for $24.8 million in fiscal 2021, at an average price of $356.6 per share. The board authorized a repurchase program in 2012, and at the end of fiscal 2021 still had about $334.8 million remaining.
GuruFocus provides this table of ownership information:

The chairman of the board (and previous president and CEO), Robert S. Weiss, owns 63,798 shares, while current President and CEO Albert G. White held 41,430 shares as of Dec. 7.
Valuation

While the overall valuation rating is hardly impressive, the price-earnings ratio is, as indicated by the dark green bar. Indeed, it is better than 91.35% of the 935 companies in the medical devices and instruments industry.
The PEG ratio, calculated by dividing the price-earnings ratio by the five-year Ebitda growth rate, comes near the fair valuation mark of 1.
That’s also the conclusion of the GF Value Line chart:

The discounted cash flow, or DCF, calculator arrives at an undervalued result, and deeply undervalued if we use the default 10-year growth rate. Even cutting the growth rate back to a more conservative 10% provides a very high margin of safety.

Gurus
In recent quarters, the guru sentiment has been evenly divided:

Eleven gurus held Cooper stock at the end of the third calendar quarter, including:
- Al Gore (Trades, Portfolio) of Generation Investment Management; he held the largest stake at 1,599,468 shares. They represented a 3.24% holding in Cooper and 2.75% of the fund’s assets. During the quarter, he cut his holding by 1.29%.
- Ron Baron (Trades, Portfolio) of Baron Funds, who held 240,241 shares after cutting his position by 0.13%.
- Jim Simons (Trades, Portfolio) or his successor(s) at Renaissance Technologies; he added a whopping 489.38% to finish the third quarter with 132,598 shares.
Conclusion
The Cooper Companies offers investors a share price that fluctuates little and provides returns comparable to or better than the S&P 500. In addition, its free cash flow appears to be getting back on track, and it has experienced steady Ebitda growth.
The company is either fairly valued or undervalued, depending on how you weigh the varying metrics. Since hitting a high of $451.45 in September, it has pulled back to near the $400 mark.
Value investors may like the pullback, but stay away because of Cooper’s debt load. Income investors will skip it altogether; a 6-cent dividend on a $400 stock is not attractive. On the other hand, growth investors and investors who don’t want to worry about share prices may find the company attractive when the share price gets out of its current doldrums.