

In light of Apple Inc. (AAPL, Financial) and Netflix Inc. (NFLX, Financial) winning awards at the 94th Academy Awards, GuruFocus’ Stock Comparison Table allows Premium users to compare the companies’ financial strength, profitability, valuation and growth metrics in one table.
Apple’s “CODA” won awards for Best Picture, Best Adapted Screenplay and Best Supporting Actor, while Netflix’s “The Power of the Dog” took the award for Best Director.
Background
Apple and Netflix are among the FAANG stocks, which also include Meta Platforms Inc. (FB, Financial), Amazon.com Inc. (AMZN, Financial) and Google-parent Alphabet Inc. (GOOGL, Financial)(GOOG, Financial).
While Apple primarily focuses on consumer electronics products, the Cupertino, California-based tech giant launched in November 2019 a streaming service platform called Apple TV+ to take on rival streaming platforms, including Netflix.
As such, GuruFocus users can compare financial strength, profitability, valuation and growth metrics for Apple and Netflix using the Stock Comparison Table.
Table 1 illustrates a stock comparison table containing Apple. Users can clear the list of competitors by clicking the “Clear” button.

Table 1
Table 2 illustrates a stock comparison table containing Apple and Netflix. Users can save a table by clicking on the Save button in the “Save” menu.

Table 2
Profitability and growth
Users can then select a predefined view under the “GuruFocus Views” tab or a user-saved view under the “My Views” tab. Users can then add additional fields into the view using the “Add Metrics” button. Table 3 illustrates a sample table containing a few profitability and growth fields.

Table 3
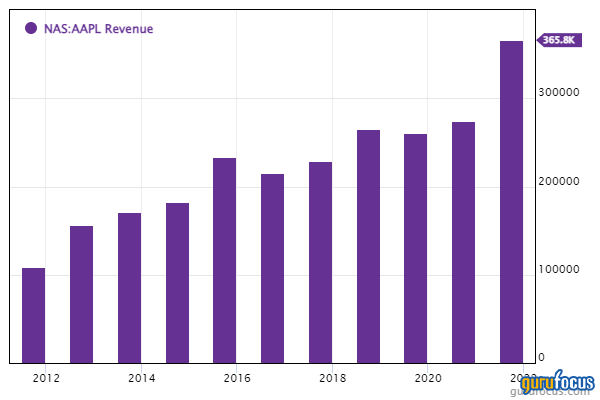
As Table 3 illustrates, Apple has slightly higher profit margins than Netflix does, though Netflix has higher revenue and operating margin growth.

Apple has a GuruFocus profitability rank of 10 based on several positive investing signs, which include a five-star business predictability rank, a high Piotroski F-score of 7 and profit margins and returns that are outperforming more than 97% of global competitors.
Likewise, Netflix has a GuruFocus profitability rank of 9 on the back of a five-star business predictability rank, a Piotroski F-score of 6 and profit margins and returns that outperform over 88% of global competitors.
Financial strength and valuation
Table 4 illustrates a sample financial strength and valuation table for Apple and Netflix.

Table 4
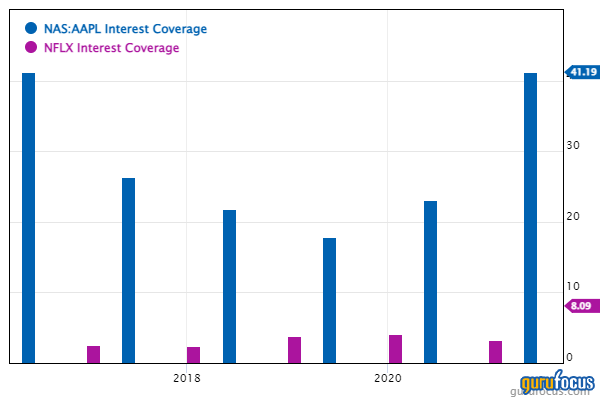
As Table 4 illustrates, Apple has a GuruFocus financial strength rank of 7, while Netflix has a GuruFocus financial strength rank of 6. Apple’s interest coverage of 43.28 outperforms more than 62% of global competitors, while Netflix’s interest coverage of 7.48 underperforms more than 66% of global competitors.
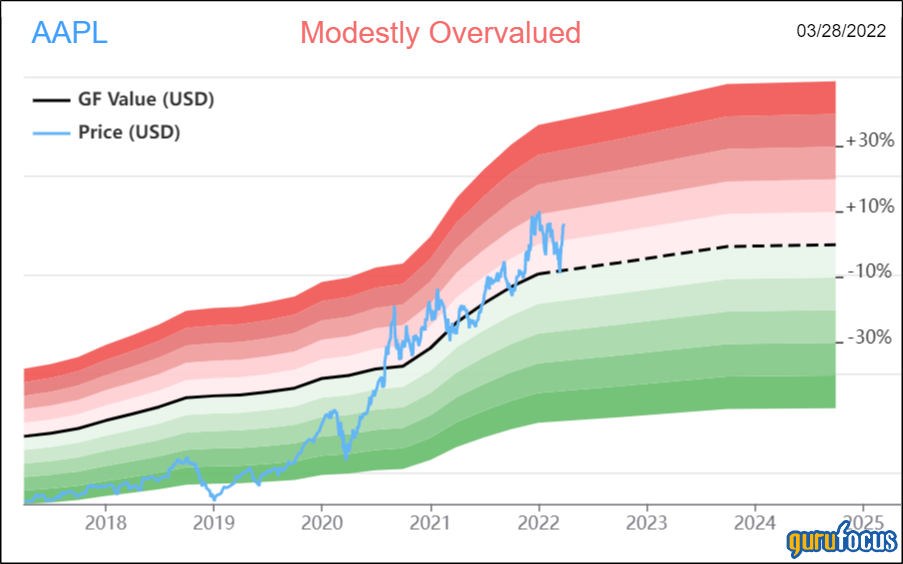
Shares of Apple traded around $175.60 compared to a GF Value of $152.12, showing the stock is modestly overvalued based on Monday’s price-to-GF Value ratio of 1.15.
Likewise, shares of Netflix traded around $378.51 compared to a GF Value of $631.03, showing the stock is significantly undervalued based on Monday’s price-to-GF Value ratio of 0.60.

Conclusions
While the stock comparison table can help users view financial strength, profitability and valuation metrics for several stocks, investors must also consider several other risks and factors before investing in the stocks listed in the table.