

In times of economic turmoil, a tried and trusted strategy is to invest in a utility, preferably one that is regulated. Utilities give investors a sense of stability because of their financial stability, nearly guaranteed revenue and yields and to their relatively consistent dividends.
Evergy Inc. (EVRG, Financial) meets these criteria and also has generated capital gains.
About Evergy
Based in Kansas City, Missouri, this utility generates and sells electricity to roughly 1.7 million customers in Kansas and Missouri. It does this through three subsidiaries, each of which is regulated by one of the two states it serves. In also owns a minority interest in a transmission system operated by Transource Energy LLC.
Its energy sources are coal (38%), wind (28%), natural gas and oil (26%), uranium (7%) and solar/landfill gas/hydroelectric (1%).
With its share price at $60.91 (at the close of trading on June 17), the company had a market cap of $13.96 billion.
Financial strength

The financial strength table suggests a company that is faring poorly, yet that ranking can mislead us. Evergy is a utility and, like most of its peers and competitors, it invests large amounts of capital in assets up front and then collects revenue from those assets for many subsequent years.
Of course, carrying a large amount of debt can cause investors to get nervous when interest rates rise, which is likely to continue through the rest of this year.
At the end of the first quarter of 2022, the balance sheet showed total assets of $28.74 billion. And as long as regulators allow it to earn a reasonable return, the company should not have to worry about interest or principal repayments.
And the yellowish bars for the first four ratios tell us that its metrics are roughly comparable to those of other companies in the regulated utilities industry.
As noted, the states of Missouri and Kansas regulate most of Evergy’s business. Are the regulators providing enough profits to keep investors satisfied?
Profitability
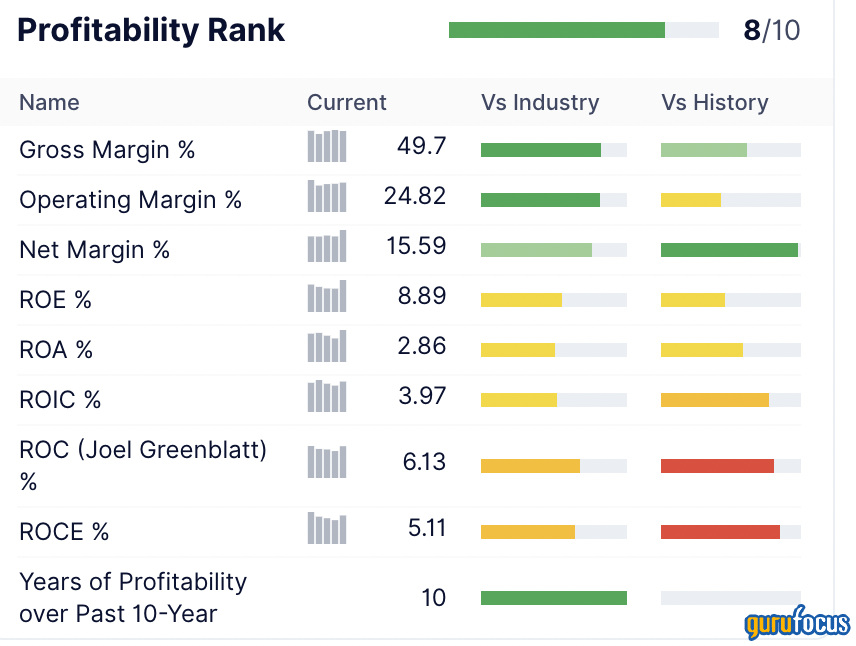
Judging by the margins shown on this table, regulators are keeping investors happy.
Further, the table shows Evergy has been profitable every year for the past 10 years, indicating it apparently has had few problems with regulators over the past decade.
Growth

Growth is not something we look for in utilities, yet Evergy scores highly. A closer look at the table suggests the main reason for this score is the earnings per share without non-recurring items line. A 15.3% growth rate is very good for a utility.
In fact, it is more than double the industry average of 6.3% and higher than 68.07% of other companies in the industry.
Dividends and buybacks

Evergy has quite consistently raised its dividend annually since 2004:

The dividend yield is relatively high, especially compared with the S&P 500 average of 2.02% for 2022, using the SPDR S&P 500 ETF (SPY, Financial) as a proxy.
The dividend growth rate also rates well at an average of 7.9% per year over the past three years. Add the earnings per share growth rate to the dividend growth rate and the future looks promising.
But before you count your gains, look at this chart of shares outstanding over the past decade:

That upward trend means the company has grown its share count over the past decade by an average of over 8% per year. Shareholders have had their equity diluted, offsetting some of that growth.
Valuation
In the following 10-year chart of Evergy’s share price, observe how the share price has struggled since the 2020 (Covid-19) recession began:

It confirms the assumption that utilities are sensitive to economic conditions. In other words, demand for electrical power rises and falls with the broader economy.
From a valuation perspective, the slump over the past two years and the most recent pullback (driven in part by rising inflation) apparently leave the company undervalued.
The GF Value chart, which is based on a broader set of criteria over the past five years, assesses Evergy as fairly valued:

The price-to-earnings ratio, at 17.09, is slightly higher than the industry average of 15.64. Dividing that by the 5-year Ebitda growth rate of 6.70% leaves us with a PEG ratio of 2.55, well above the fair value mark of 1.00.
Because the company has a low predictability rating (for revenue and earnings), we cannot use the discounted cash flow calculator with any confidence.
GuruFocus gives Evergy an overall value ranking of 6 out of 10, which would suggest it is fairly to modestly overvalued.
Performance
GuruFocus compares Evergy with Alliant Energy Corp. (LNT, Financial), the parent of electric and natural gas utilities serving nearly 1.5 million Wisconsin customers, and Avangrid Inc. (AGR, Financial), which operates electrical utilities serving 3 million customers in northeast states and a renewables division.
Here's how their performances compare over the past decade:

Looking specifically at Evergy’s annualized returns, we see:
- Year to date: -12.35%
- One year: -6.73%
- Three years: -0.07%
- Five years: 2.31%
- 10 years: 7.26%
Total annual returns:
- 2018: 7.52%
- 2019: 14.66%
- 2020: -14.72%
- 2021: 23.60%
- 2022: -12.35%
These year-to-year swings help us understand why the company gets a lowly one out of five score for predictability. And that is not the kind of stability we hope to get from a utility.
GF Score
This metric provides one number that sums up the fundamentals. It gives Evergy a relatively high score, despite the shortcomings we have noted:

Gurus
Six gurus held positions in Evergy at the end of the first quarter of 2022. The three largest positions were those of:
- Mario Gabelli (Trades, Portfolio) of GAMCO Investors, who reduced his count by 1.59% and finished the quarter with 565,416 shares. That represented 0.25% of the company’s shares outstanding and 0.35% of GAMCO’s assets under management.
- Steven Cohen (Trades, Portfolio) of Point72 Asset Management; he added 2,030% for a total of 358,800 shares.
- Keeley-Teton Advisors, LLC (Trades, Portfolio), which reduced its holding by 3.27% to arrive at 40,679 shares.
Conclusion
Evergy has several elements that will appeal to income investors. Mainly, it offers an above-average dividend yield along with a fairly robust set of fundamentals.
For many potential investors, the buying decision will likely boil down to the purchase cost. Is the stock undervalued as suggested by the price chart, fairly valued as indicated by the GF Value chart or overvalued as the price-earnings and PEG ratios suggest?
Neither value nor growth investors will find much of interest here.