

Elbit Systems (ESLT, Financial) has delivered robust financial results for the first quarter, with revenue reaching $1.9 billion, a notable increase from $1.55 billion in the same period last year. This marks a 22% growth, driven by heightened global demand for defense solutions amidst ongoing international conflicts. The company has also seen its backlog expand significantly, now exceeding $23 billion, a 14% rise compared to the first quarter of the previous year.
Free cash flow for the quarter amounted to $161 million. Elbit Systems attributes its positive performance to its strategic positioning in capturing emerging opportunities in escalating defense budgets worldwide, especially in Europe. The company continues to invest in enhancing production capabilities and optimizing supply chains to manage its expanding backlog efficiently. The commitment and hard work of its global workforce are acknowledged as key contributors to these successes.
Wall Street Analysts Forecast
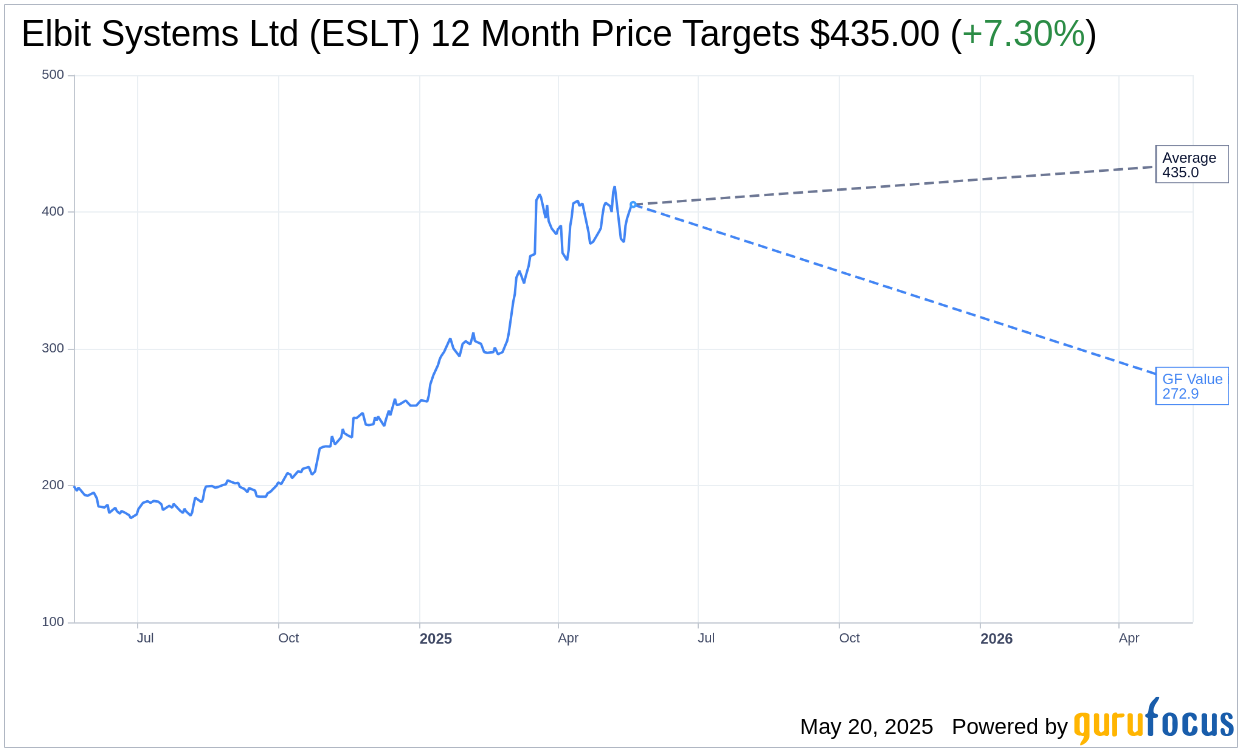
Based on the one-year price targets offered by 1 analysts, the average target price for Elbit Systems Ltd (ESLT, Financial) is $435.00 with a high estimate of $435.00 and a low estimate of $435.00. The average target implies an upside of 7.30% from the current price of $405.40. More detailed estimate data can be found on the Elbit Systems Ltd (ESLT) Forecast page.
Based on the consensus recommendation from 1 brokerage firms, Elbit Systems Ltd's (ESLT, Financial) average brokerage recommendation is currently 3.0, indicating "Hold" status. The rating scale ranges from 1 to 5, where 1 signifies Strong Buy, and 5 denotes Sell.
Based on GuruFocus estimates, the estimated GF Value for Elbit Systems Ltd (ESLT, Financial) in one year is $272.86, suggesting a downside of 32.69% from the current price of $405.4. GF Value is GuruFocus' estimate of the fair value that the stock should be traded at. It is calculated based on the historical multiples the stock has traded at previously, as well as past business growth and the future estimates of the business' performance. More detailed data can be found on the Elbit Systems Ltd (ESLT) Summary page.
ESLT Key Business Developments
Release Date: March 18, 2025
- Revenue: Fourth-quarter 2024 revenue increased by 19% to $1.930 billion; full-year 2024 revenue increased by 14% to $6.828 billion.
- Segment Revenue Growth: Aerospace revenue increased by 27%; C4I and Cyber by 7%; ISTAR and EW by 8%; Land by 29%; Elbit Systems South America by 6%.
- Non-GAAP Gross Margin: Fourth-quarter 2024 at 24.5%; full-year 2024 at 24.5%.
- GAAP Gross Margin: Fourth-quarter 2024 at 24.1%; full-year 2024 at 24%.
- Non-GAAP Operating Income: Fourth-quarter 2024 at $157.5 million or 8.2% of revenues; full-year 2024 at $550 million or 8.1% of revenues.
- GAAP Operating Income: Fourth-quarter 2024 at $141.4 million or 7.3% of revenues; full-year 2024 at $489 million or 7.2% of revenues.
- Net R&D Expenses: $456 million or 6.8% of revenues in 2024.
- Marketing and Selling Expenses: $375 million or 5.5% of revenues in 2024.
- G&A Expenses: $311 million or 4.6% of revenues in 2024.
- Financial Expenses: $151 million in 2024.
- Effective Tax Rate: 11.4% in 2024.
- Non-GAAP Diluted EPS: $2.66 in Q4 2024; $8.76 for full-year 2024.
- GAAP Diluted EPS: $2 in Q4 2024; $7.18 for full-year 2024.
- Backlog of Orders: $22.6 billion as of December 31, 2024.
- Net Cash Flow from Operating Activities: $535 million for the year ended December 31, 2024.
- Free Cash Flow: $320 million delivered in 2024.
- Dividend: $0.60 per share declared by the Board of Directors.
For the complete transcript of the earnings call, please refer to the full earnings call transcript.
Positive Points
- Elbit Systems Ltd (ESLT, Financial) reported a 19% increase in fourth-quarter revenues, reaching $1.930 billion compared to $1.626 billion in the same quarter of 2023.
- The company's backlog of orders reached a record $22.6 billion, with 65% generated from outside Israel, indicating strong international demand.
- Elbit Systems Ltd (ESLT) achieved a non-GAAP diluted EPS of $2.66 in Q4 2024, a significant increase from $1.56 in Q4 2023.
- Free cash flow generation was strong at $320 million for 2024, supported by $535 million in net cash flow from operating activities.
- The company continues to expand its production capacity, with new facilities in Israel and Europe, to meet growing demand for its products and solutions.
Negative Points
- The non-GAAP gross margin for the fourth quarter decreased to 24.5% from 25.3% in Q4 2023, indicating a slight decline in profitability.
- GAAP gross margin for the full year 2024 was 24%, down from 24.8% in 2023, reflecting ongoing margin pressures.
- Financial expenses increased to $151 million in 2024 from $137 million in 2023, primarily due to factoring expenses.
- The effective tax rate rose to 11.4% in 2024 from 10.1% in 2023, impacting net income.
- Marketing and selling expenses increased to $375 million in 2024, up from $359 million in 2023, which could pressure operating margins.