

Investors interested in Apple (AAPL, Financial) can gain valuable insights into the company's performance by utilizing new Key Performance Indicator (KPI) data. This data, essential for making informed investment decisions, is now available through innovative tools that help in evaluating the stock's future potential.
The availability of market-resilient stock information aids investors in identifying undervalued opportunities within the market, enhancing their overall strategy. By subscribing to specialized newsletters, investors can receive tailored insights that help navigate the complexities of stock investments.
Wall Street Analysts Forecast
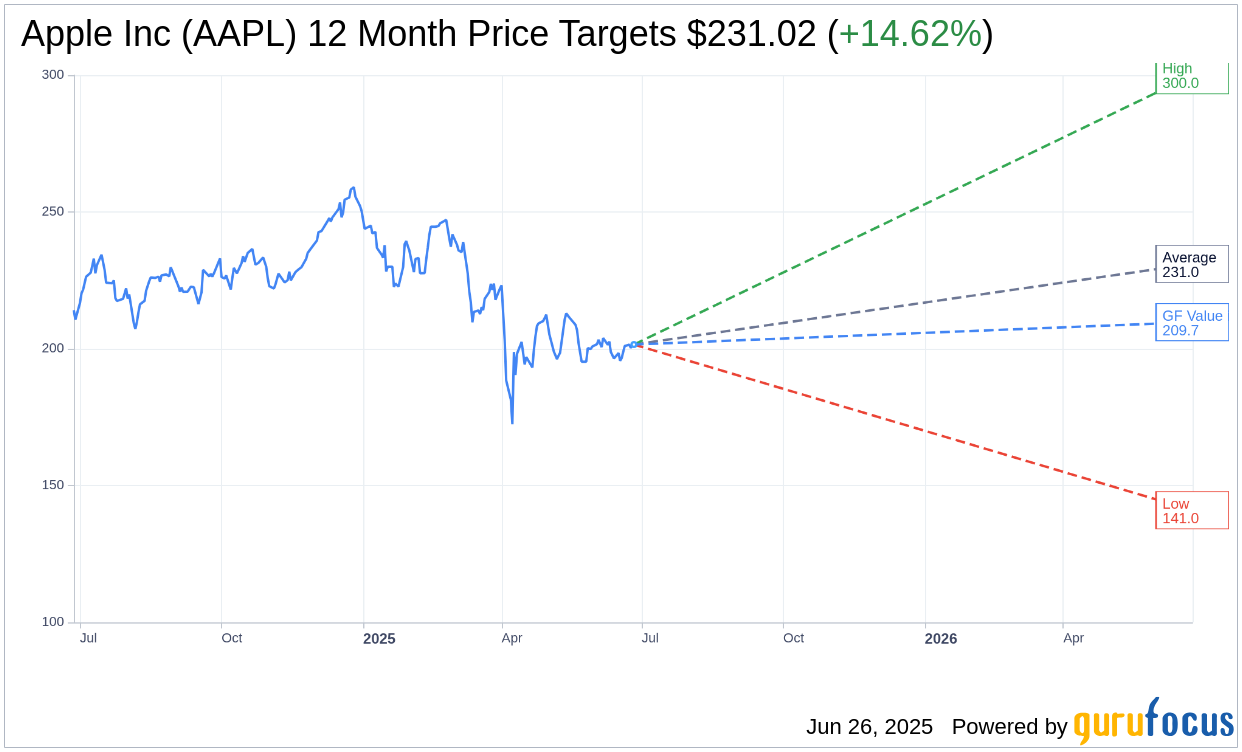
Based on the one-year price targets offered by 41 analysts, the average target price for Apple Inc (AAPL, Financial) is $231.02 with a high estimate of $300.00 and a low estimate of $141.00. The average target implies an upside of 14.62% from the current price of $201.56. More detailed estimate data can be found on the Apple Inc (AAPL) Forecast page.
Based on the consensus recommendation from 50 brokerage firms, Apple Inc's (AAPL, Financial) average brokerage recommendation is currently 2.2, indicating "Outperform" status. The rating scale ranges from 1 to 5, where 1 signifies Strong Buy, and 5 denotes Sell.
Based on GuruFocus estimates, the estimated GF Value for Apple Inc (AAPL, Financial) in one year is $209.73, suggesting a upside of 4.05% from the current price of $201.56. GF Value is GuruFocus' estimate of the fair value that the stock should be traded at. It is calculated based on the historical multiples the stock has traded at previously, as well as past business growth and the future estimates of the business' performance. More detailed data can be found on the Apple Inc (AAPL) Summary page.
AAPL Key Business Developments
Release Date: May 01, 2025
- Revenue: $95.4 billion, up 5% year over year.
- Diluted EPS: $1.65, up 8% year over year.
- iPhone Revenue: $46.8 billion, up 2% year over year.
- Mac Revenue: $7.9 billion, up 7% year over year.
- iPad Revenue: $6.4 billion, up 15% year over year.
- Wearables, Home, and Accessories Revenue: $7.5 billion, down 5% year over year.
- Services Revenue: $26.6 billion, up 12% year over year.
- Gross Margin: 47.1%.
- Operating Expenses: $15.3 billion, up 6% year over year.
- Net Income: $24.8 billion.
- Operating Cash Flow: $24 billion.
- Shareholder Returns: $29 billion returned, including $3.8 billion in dividends and $25 billion in share repurchases.
- Cash and Marketable Securities: $133 billion.
- Net Cash: $35 billion.
For the complete transcript of the earnings call, please refer to the full earnings call transcript.
Positive Points
- Apple Inc (AAPL, Financial) reported $95.4 billion in revenue, up 5% year over year, with a March quarter record for diluted EPS at $1.65.
- Services achieved an all-time revenue record of $26.6 billion, growing 12% compared to the prior year.
- iPhone revenue increased by 2% year over year, driven by the iPhone 16 family, with a strong active installed base.
- Mac revenue grew by 7% year over year, with every geographic segment showing growth and high customer satisfaction.
- Apple Inc (AAPL) announced plans to invest $500 billion in the US over the next four years, expanding facilities and sourcing more components domestically.
Negative Points
- Wearables, Home, and Accessories revenue declined by 5% year over year, facing a difficult comparison against previous product launches.
- The company faces a potential $900 million cost impact from tariffs in the June quarter, with uncertainty about future tariff changes.
- China revenue decreased by 2% year over year, although it was roughly flat when adjusted for foreign exchange headwinds.
- Product gross margins decreased by 340 basis points sequentially, driven by mix, foreign exchange, and seasonal loss of leverage.
- There are ongoing legal challenges, including the Epic case and Google antitrust trial, which could impact Apple Inc (AAPL)'s Services business.