

FBK reported a notable increase in its net interest margin for the second quarter, rising to 3.68% compared to 3.57% from the previous year. The provision for loan losses grew significantly to $5.3 million, up from $2.2 million in the same period last year. The company experienced growth in both loans and customer deposits, maintaining a robust financial stance with strong capital and liquidity levels.
Furthermore, FBK strategically improved its balance sheet by selling lower-yield securities, intending to boost its liquidity and margin in future quarters. The company remains optimistic about its position for the latter half of the year, particularly with the recent completion of its merger with Southern States Bancshares, Inc. on July 1st, which is expected to further strengthen its market presence.
Wall Street Analysts Forecast
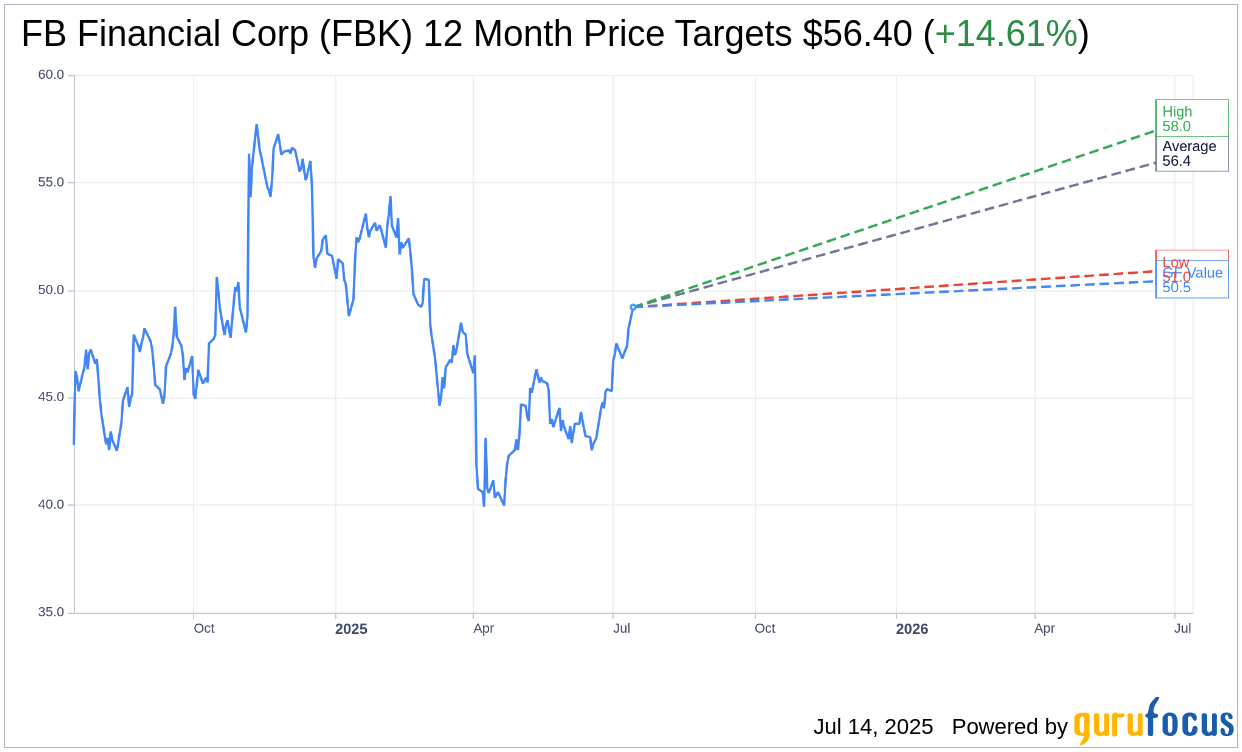
Based on the one-year price targets offered by 5 analysts, the average target price for FB Financial Corp (FBK, Financial) is $56.40 with a high estimate of $58.00 and a low estimate of $51.00. The average target implies an upside of 14.61% from the current price of $49.21. More detailed estimate data can be found on the FB Financial Corp (FBK) Forecast page.
Based on the consensus recommendation from 6 brokerage firms, FB Financial Corp's (FBK, Financial) average brokerage recommendation is currently 1.8, indicating "Outperform" status. The rating scale ranges from 1 to 5, where 1 signifies Strong Buy, and 5 denotes Sell.
Based on GuruFocus estimates, the estimated GF Value for FB Financial Corp (FBK, Financial) in one year is $50.50, suggesting a upside of 2.62% from the current price of $49.21. GF Value is GuruFocus' estimate of the fair value that the stock should be traded at. It is calculated based on the historical multiples the stock has traded at previously, as well as past business growth and the future estimates of the business' performance. More detailed data can be found on the FB Financial Corp (FBK) Summary page.
FBK Key Business Developments
Release Date: April 15, 2025
- EPS: $0.84 reported, $0.85 adjusted.
- Tangible Book Value Growth: 12.8% CAGR since IPO in 2016.
- Pretax Pre-Provision Net Revenue: $51.1 million, $52.2 million adjusted.
- Loan Growth: $169 million increase, 7.14% annualized rate.
- Loans Held for Investment: Approximately $9.8 million at quarter end.
- Adjusted Return on Average Assets: 1.23%.
- Adjusted Return on Average Tangible Common Equity: 12.3%.
- Tangible Common Equity to Tangible Assets Ratio: 10.5%.
- Net Interest Income: $107.6 million.
- Noninterest Income: $23 million.
- Noninterest Expense: $79.5 million reported, $79.1 million adjusted.
- Provision Expense: $2.3 million.
- Net Income: $39.4 million reported, $40.1 million adjusted.
- Net Interest Margin: 3.55% on a tax equivalent basis.
- Cost of Total Interest-Bearing Deposits: Decreased 24 basis points.
- Core Efficiency Ratio: 59.9%.
- Annualized Net Charge-Off Rate: 0.14%.
- Allowance for Credit Loss Balance: $151 million.
- Common Equity Tier 1 Ratio: 12.8% preliminary.
For the complete transcript of the earnings call, please refer to the full earnings call transcript.
Positive Points
- FB Financial Corp (FBK, Financial) reported a solid first quarter with an EPS of $0.84 and adjusted EPS of $0.85.
- The company achieved a compound annual growth rate of 12.8% in tangible book value per share since its IPO in 2016.
- Loan balances grew by $169 million at an annualized rate of 7.14%, primarily in C&I and owner-occupied CRE.
- FB Financial Corp (FBK) maintained a strong capital position with a tangible common equity to tangible assets ratio of 10.5% and a CET1 ratio of 12.8%.
- The planned combination with Southern States Bank is progressing well, with integration efforts underway and a Q3 close anticipated.
Negative Points
- The adjusted return on average tangible common equity of 12.3% is below internal targets due to holding excess capital.
- Net interest income was slightly down by $740,000, impacted by two fewer days in the quarter.
- Noninterest expense increased to $79.2 million, resulting in a higher core efficiency ratio of 59.9% compared to the previous quarter.
- Charge-offs were higher than historical levels, with an annualized net charge-off rate of 0.14%, driven by a specific C&I credit.
- Economic uncertainty and market volatility pose challenges, with potential impacts on clients and communities being closely monitored.