

Introduction
Synchrony Financial (SYF, Financial) is a private label credit card provider that also provides financing for elective healthcare procedures or services (for ex.: dental, cosmetic, veterinary, etc). The company IPO'd on July 31, 2014, via a spin-off from General Electric (GE, Financial). The IPO raised $2.88B and was the biggest U.S. initial offering of the year at the time. GE didn't sell shares in the IPO and retained 85% ownership in the company, but it plans on selling off the remainder of its position sometime later this year - it's also important to note that GE won't be offering its shareholders a discount on SYF shares. Due to good management and economic tailwinds, SYF has beaten consensus earnings estimates in both of its quarterly reports, by 9.37% and 8.47%, respectively. As a result of this positive performance, the SYF share price has gained 38.65% in the 8.5 months since IPO.
In this article, we'll be looking at why now is a good time to pick up a long position in SYF while the price continues to rise. Based on traditional value metrics that have been empirically shown to predict stock returns, SYF is undervalued relative to the market. Additionally, SYF has a solid growth profile and the "smart money" is moderately bullish on the stock. Again, the metrics used to highlight this have been empirically shown to predict returns, and are thus extremely important to analyze. As we go through the report, we'll provide links to the academic papers that underpin our analysis, so investors can see for themselves why each metric is important. Investors looking to dig deeper into academic research can check out our post, which outlines major investors/academics and their research.
Valuation Breakdown
We'll start with an analysis of SYF's valuation profile, looking at five valuation metrics each with a strong predictive ability. This is important to look at as Nobel Laureate Eugene Fama showed that "value stocks have higher average returns than growth stocks." SYF's valuation profile is shown below:
(click to enlarge)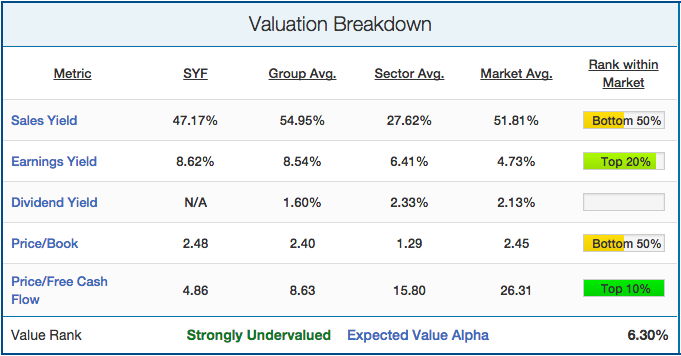 Source : Quantified Alpha
Two big observations can be made from SYF's value profile:
1. Strong earnings yield (inverse of P/E), and
2. Strong price/free cash flow.
The stock hasn't yet released any dividends and is essentially neutral in both a sales yield and price-to-book ratio perspective. However, its earnings yield of 8.62% puts it in the 87th percentile of the market, trading at a P/E of 11.6. Where SYF becomes even more attractive from a value perspective is that it trades at only 4.86 times free cash flow. This is nearly half of the consumer finance average of 8.63, and less than a fifth of the market average of 26.31 - placing it in the 96th percentile of the market on a free cash flow basis.
Growth Breakdown
There are a variety of different growth metrics that have been shown to predict stock returns. Most important among them is price momentum. Winning stocks keep winning (based on 6-month price performance), and losing stocks keep losing. As outlined in James O'Shaughnessy's book What Works on Wall Street, EPS growth and return on equity/assets were also shown to have predictive ability, albeit to a lesser extent. Synchrony Financial's growth breakdown is shown below:
(click to enlarge)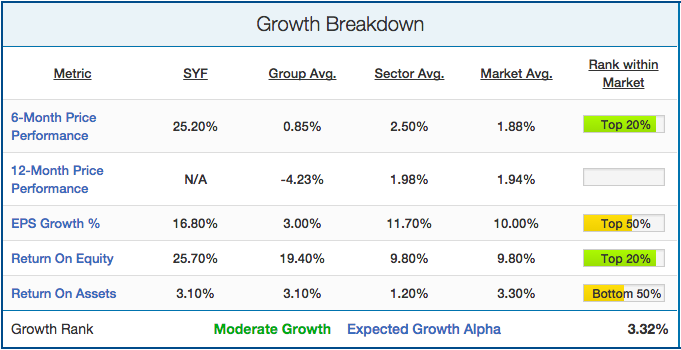
Source: Quantified Alpha
The key take-away from SYF's growth breakdown is its momentum. It's well established that on average, stocks with strong 6-month price momentum tend to outperform the market over the ensuing 12 months. With over 25% gains in the last six months, now is a good time to take a position while the stock has momentum. To put that momentum into perspective, over the same time period the consumer finance average was 0.85%, the financials average was 2.50%, and the market average was 1.88% (market defined as NASDAQ and NYSE). This growth puts SYF's 6-month price performance in the top 15% of the entire market. While the EPS growth was impressive by group and sector standards, it was less impressive on a market-wide scale. Its ROE of 25.70% is impressive by any measure, placing it in the top 10% of its sector and top 15% of the market as a whole. Its ROA of 3.10% is right in line with the consumer finance average. Finally, although it's somewhat obvious, SYF doesn't have a 12-month price performance as the stock has only been trading publicly for the last 8.5 months.
Smart Money Breakdown
In addition to value and momentum, we will also analyze how the "smart money" on the Street is playing Scotiabank. "Smart money" stakeholders are short sellers, company insiders, and institutions. Each of these stakeholders tends to be much more sophisticated than the average investor due to their inherent advantages. Company insiders know the company inside out, while institutions and short sellers spend millions of dollars on research. We have found loads of academic research showing that short sellers, company insiders, and institutions all predict stock returns. BNS' "smart money" breakdown is shown below:
(click to enlarge)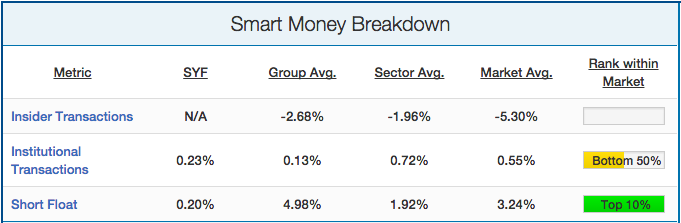
There is currently no information available regarding insider transactions at SYF, and it's hard to glean anything noteworthy from their mediocre institutional transactions. The key take-away here is the extremely small short-float. Though it's intuitive as to why the short float would be low for a stock with such strong momentum, it's important to note as it shows that short-sellers aren't betting against the stock. At only 0.20%, SYF has one of the lowest short floats in the entire market. Now would be a good time to take a position, as the smart money doesn't anticipate a price-drop anytime soon.
Qualitative Analysis and Conclusion
Though our research is quantitatively based, it's also important to consider unique business environments to give the story a perspective. In this case, we feel that there are a number of economic trends that act as catalysts for SYF. Firstly, the drop in oil and gas prices means that consumers have more money to spend on other items. In December 2014, Goldman Sachs economists estimated that the drop in gasoline prices act as a "$75 billion consumer stimulus." Combine the lower gas prices with improving consumer sentiment and lower unemployment, and it's a good sign for SYF investors who depend on the demand for credit cards and elective healthcare procedures. Credit standards, though loosening industry-wide, are still solid, and as long as the economy continues to grow, so too should SYF. Since SYF borrows money, the biggest risk is a change in the cost of funds through increases in the interest rate. However, even with impending interest rate hikes, it appears that the company will still have access to low cost capital.
Due to its undervaluation on a free cash flow and earnings basis, its impressive momentum, and the fact that it has such a low short float, we are extremely bullish and rate SYF a "Strong Outperform" over the next 12 months.