GuruFocus’ Interactive Chart allows users to create customized charts and save them as chart templates. Users can also set a chart as the default chart and add charts to their stock summary dashboard.
The Interactive Chart allows users to visualize trends in a company’shistorical financial data in chart form using lines or bars. Key built-in charts include the Peter Lynch Chart, price-sales valuation bands chart, income statement chart, balance sheet chart and much more.
Access
To access the Interactive Chart from the stock summary page, click on the “Interactive Chart” button in the row of buttons starting with Summary and 30-year Financials.

You will then see a sample Interactive Chart screen.

The Interactive Chart includes several key features as the numbers in the screen shot illustrate:
- Interactive Chart Series Menu
- Data type: Annual, Quarterly or TTM
- Chart Options
- Add other tickers to the chart
- Add economic indicators to the chart
- Change the date range for the chart
- Define a customized date range for the chart
- Chart legend options
- Save chart template
- Add chart to stock summary dashboard
- Download and embed chart
- Reset chart
Interactive Chart Series Menu
The interactive chart series are grouped into several sections, including most popular, valuation & quality, income statement, balance sheet, cash flow statement, gurus / insiders, economic data, technical data and customized fields.
You can search for a specific chart series by entering the desired search term in the “Search Series” field. The screen shot below illustrates this using the keyword “operating.”

The chart below gives an example chart illustrating Apple Inc.’s (AAPL, Financial) operating margin.
Changing the data type
The Interactive Chart allows you to graph annual data, quarterly data and trailing-12-month data. The following charts illustrate this using Apple’s revenue data.
Apple Revenue Annual Data
Apple Revenue Quarterly Data
Apple Revenue TTM Data
Chart options
The Chart Options menu allows you to select different types of chart options, including percent changes, drawdown from peak, percent year-over-year changes, logarithmic scale, bar charts, trendlines and much more.

The chart below illustrates Apple’s operating margin data as a bar chart.
Add other tickers to the chart
You can add other tickers to the chart by adding them using the “Ticker” field. The following chart illustrates a sample revenue chart for American Airlines Group Inc. (AAL, Financial) and other airline stocks for the past 10 years.
Add economic indicators to the chart
You can add economic indicators to the chart by clicking on the Eco button. The Interactive Chart supports selecting from more than 5,000 economic indicators and adding them as chart series.

The chart below illustrates an example that includes the share price of oil stocks like Chevron (CVX, Financial) and Exxon Mobil (XOM, Financial) and the price of crude oil over the past 20 years.
Change the date range for the chart
You can change the date range for the chart either by clicking on one of the date range buttons or entering a custom date range.
The date range buttons include options to view data over the past five days, past month, past three months, past six months, year to date, past year, past 1.5 years, past three years, and so on, all the way to the maximum data range.
You can also set a customized date range or use the date slider at the bottom of the chart. The first customized date range cell gives the starting date while the second customized date range cell gives the ending date.

Changing the chart legend options
Click on the gear symbol next to a series in the legend section to open the Customize Series pop-up window.

The Customize Series pop-up window allows you to change the color of each series, separate the series into different Y-axes, change the series type from line to bar or area, and change the dash style from solid to dots or dashes.

Save chart template
Click on the “Template (Save)” button to save the chart settings as a template.

After you save a template, you can then set the template as the default by placing a check mark next to the desired template.

Add charts to dashboard
Click on the “Add to Dashboard” button to add a chart to your dashboard.
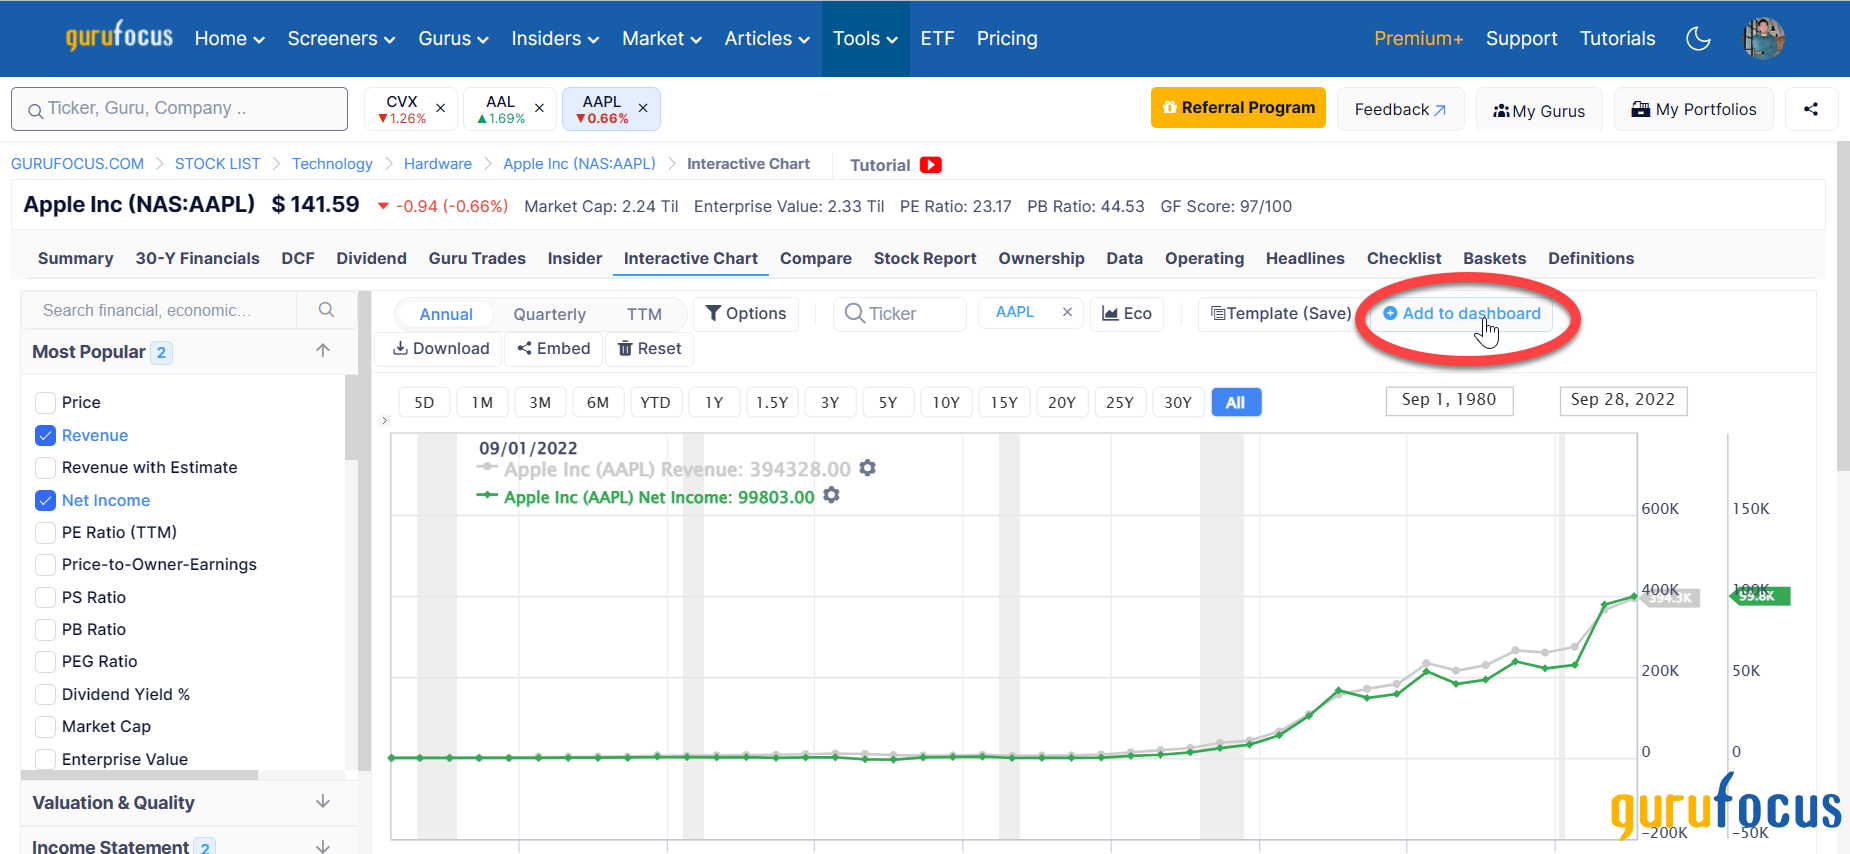
You can add the dashboard either to your stock summary page dashboard or homepage dashboard.

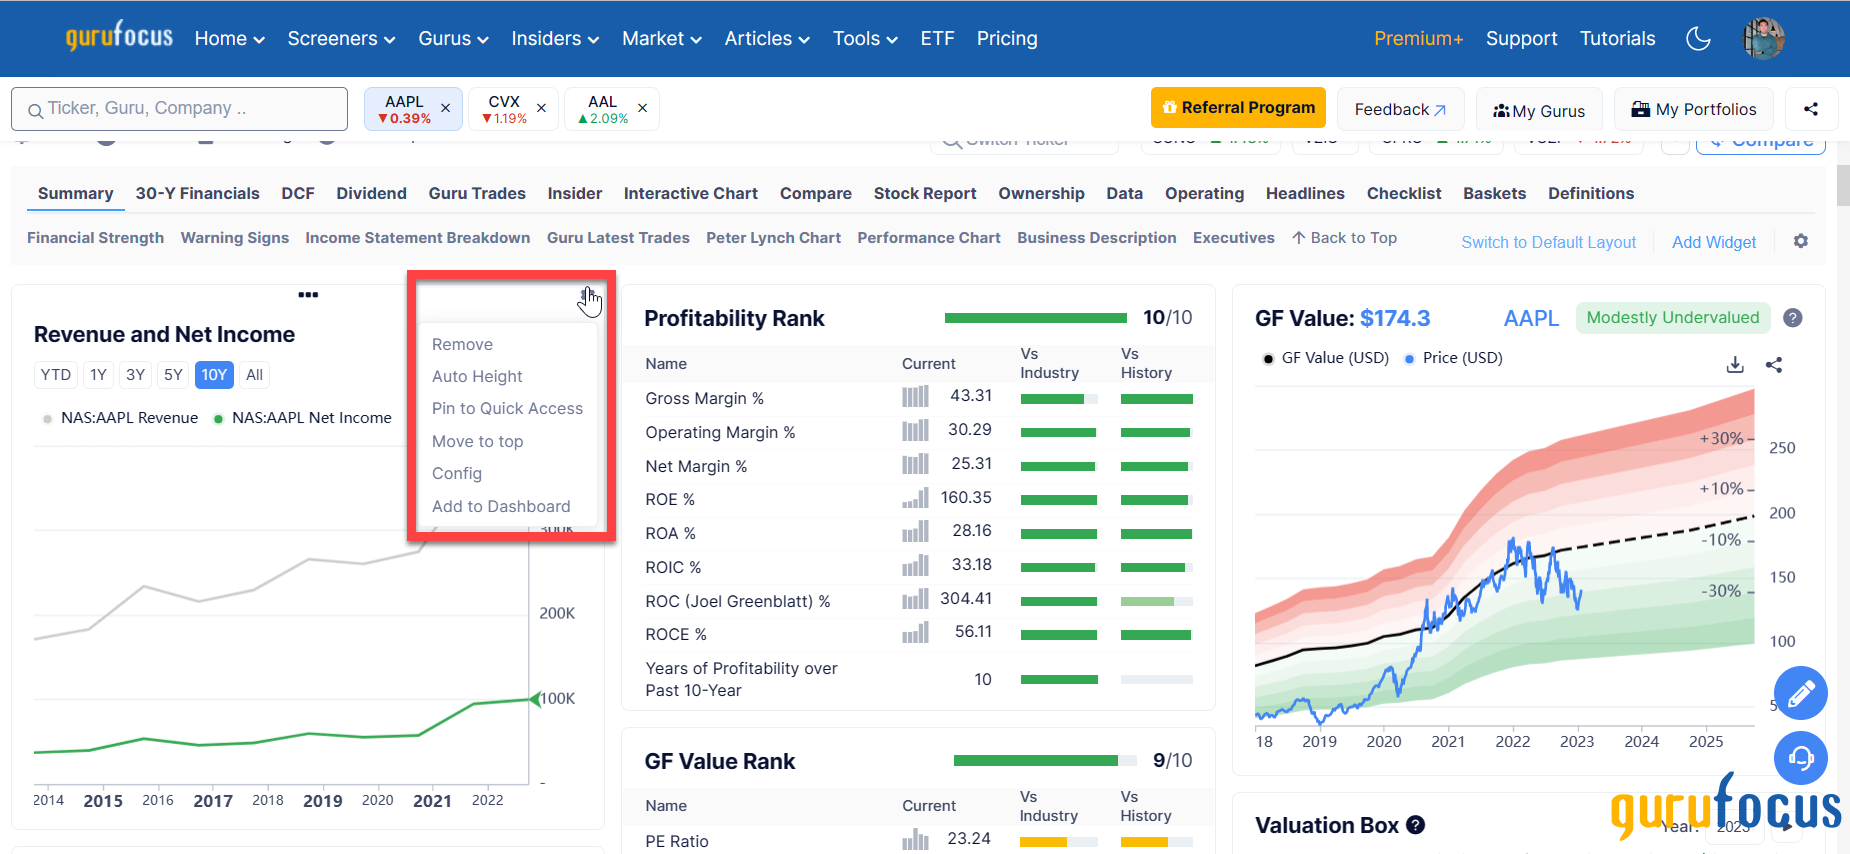
You can also add or change the interactive charts on your stock summary page dashboard. Click on the settings button and then, “Config.”
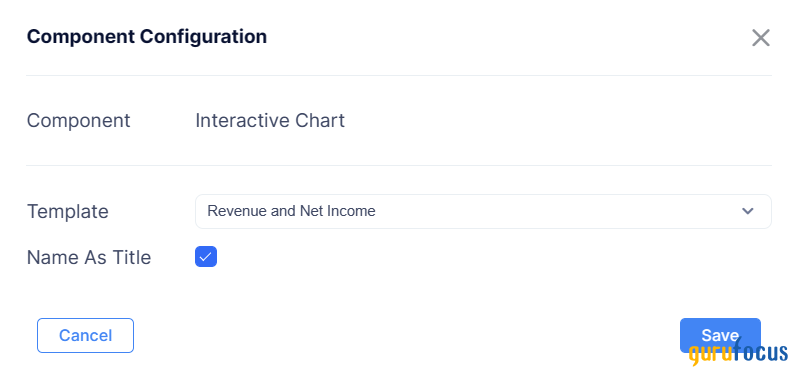
The Component Configuration pop-up wizard allows you to change the chart to a different chart.
You can also add additional charts to the stock summary dashboard and homepage dashboard by clicking on “Add Widgets” and then, click on “+ Add” (or “+ Add Another”) next to “Interactive Chart.”

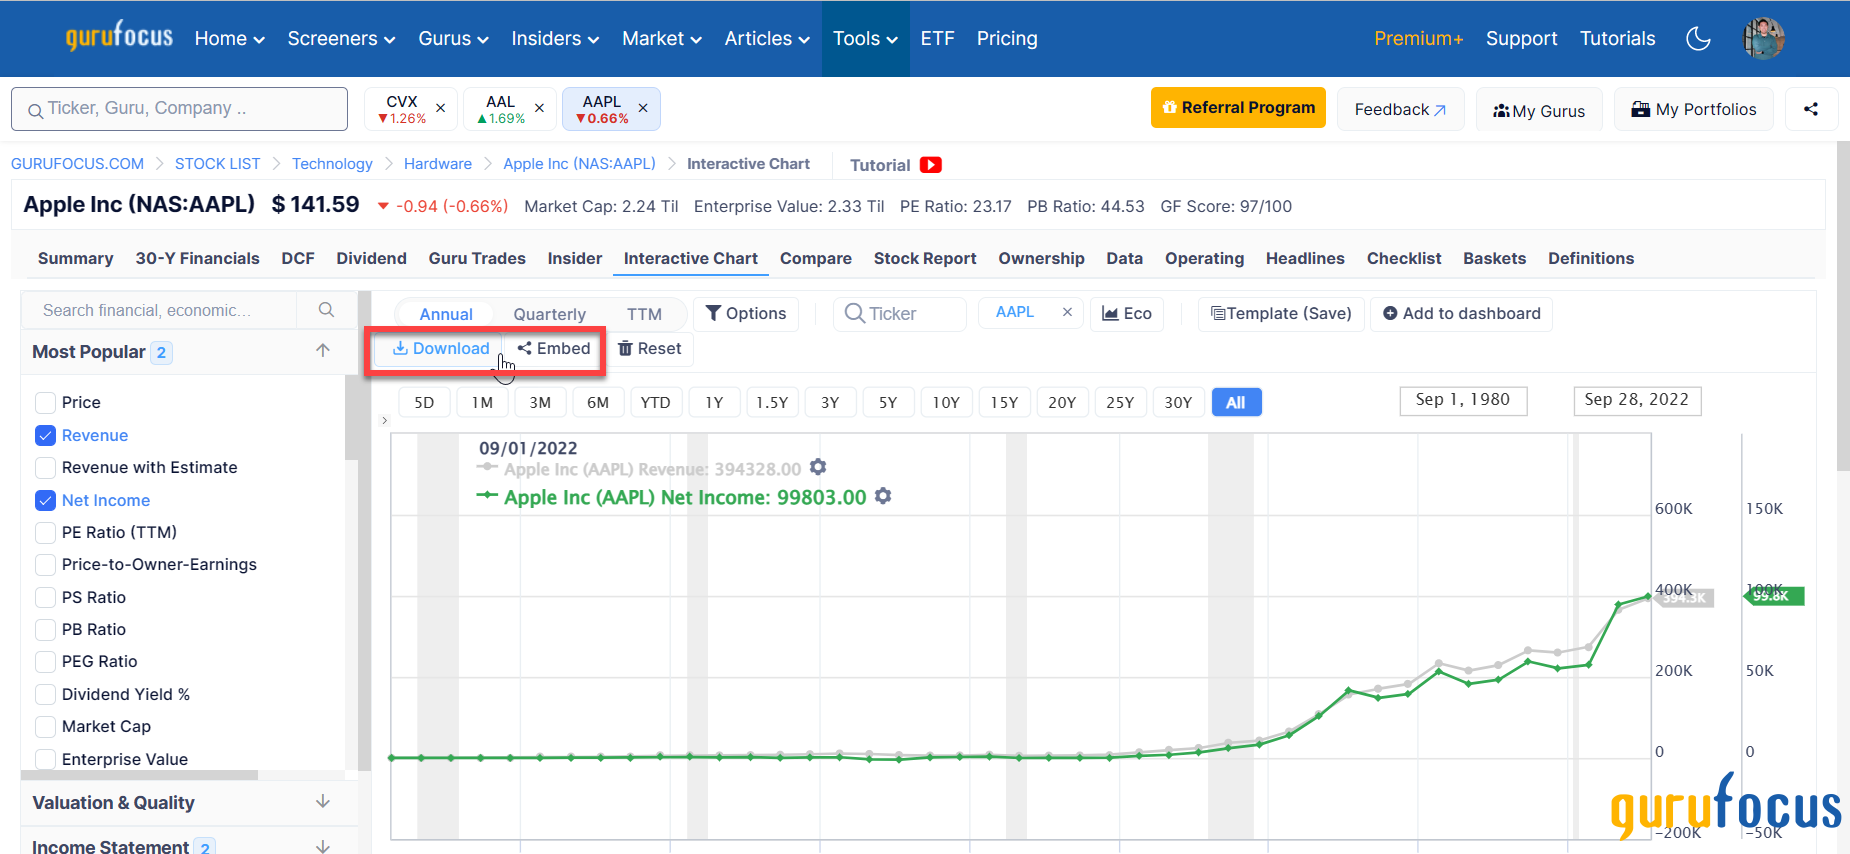
Download and embed chart
The Download and Embed Chart items allow you to download the chart as an image or Excel spreadsheet data, embed the chart in your article, or share the chart on Twitter, Facebook or LinkedIn.
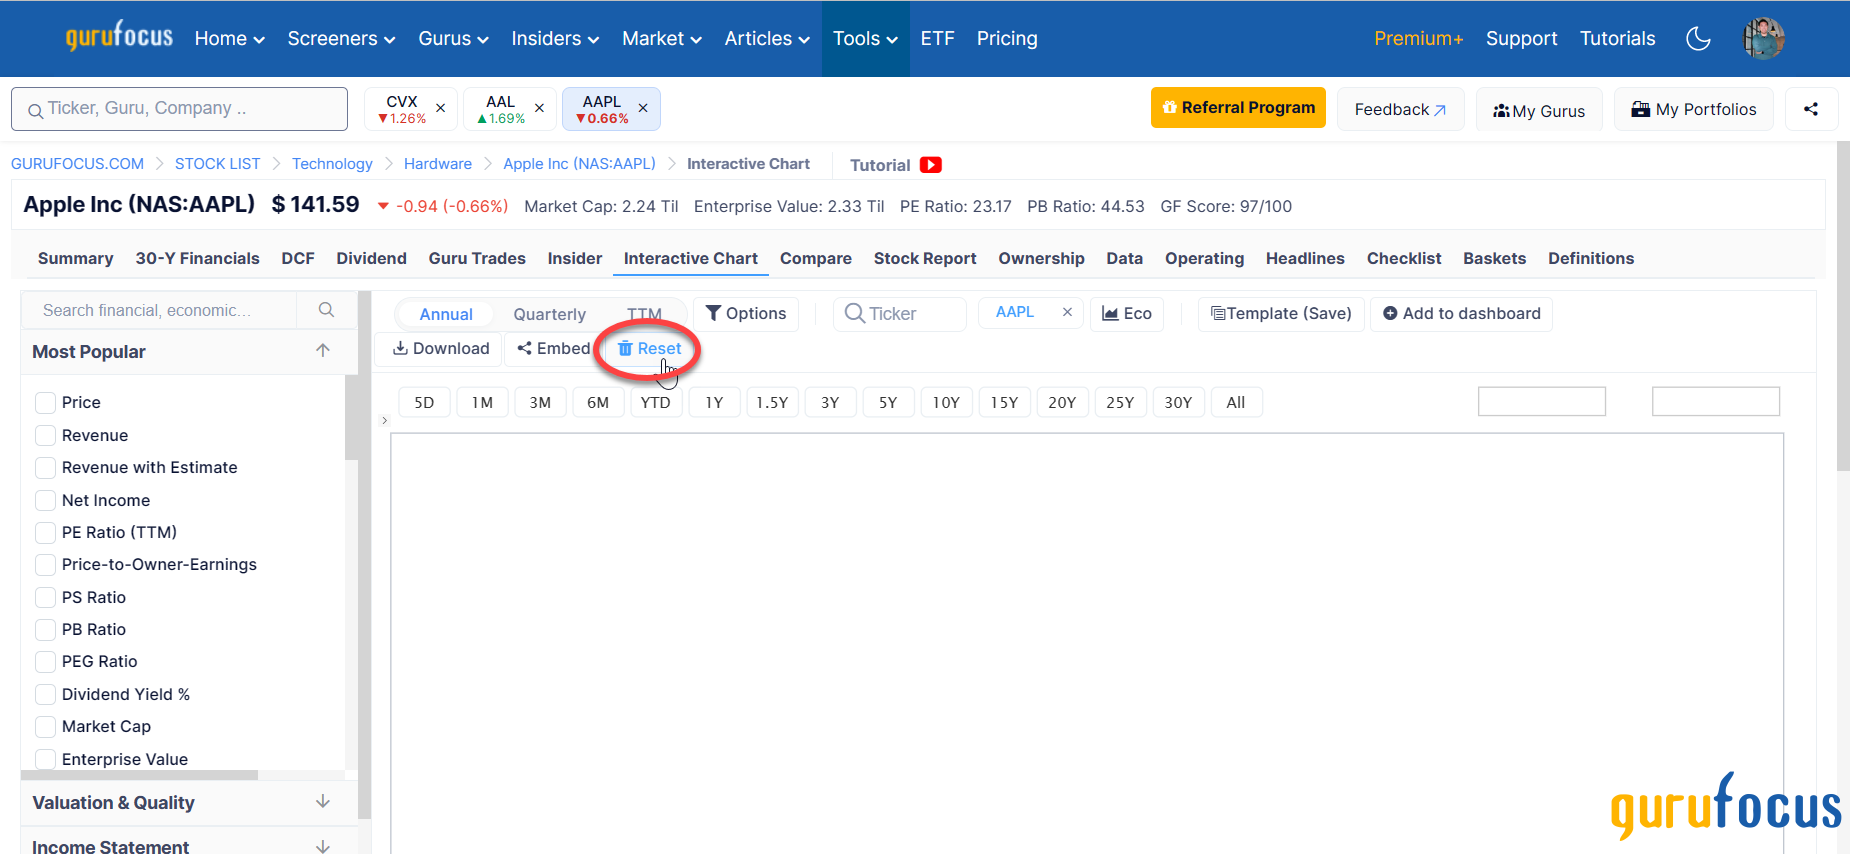
Reset chart
Click on the “Reset Chart” button to erase the chart and go back to a blank chart.
