

I want to share a recent note from Morgan Stanley. The note discusses the rise in front end rates and what it means for the relative attractiveness of other assets. It’s largely to blame for the repricing of risks we’re seeing in markets right now. And it’s going to be a continuing factor in the year ahead.
The important concept to understand here is “risk premia” and the premia spread between different asset classes. Here’s a short primer I wrote on the idea a while back.
The gist of it is investors make allocation decisions on expected returns relative to expected risks. At the base of this, the anchor, is the cash rate. Three-month T-bills are generally thought of as the “risk-free” rate you get for holding cash.
From cash, you move further out in duration (thus assuming more risk) into longer-dated government bonds (still seen as risk-free as far as credit, but with duration and inflation risks). From Treasuries you go to investment-grade bonds, then high yield, then equities and so on -- this is just a broad generalization, but you get the point.
As you move further away from cash you assume greater risk and therefore expect more of a return to compensate.
Pretty simple, right?
Okay, well the cash rate, the three-month bills, mostly move off of the Fed funds rate. This is the rate set by the FOMC. But since it has three-month duration and is a market settled rate, it will fluctuate around rate expectations and Treasury supply relative to the demand for short-term paper.
Since this is the anchor rate. The rate that all other asset classes and potential investments are measured against. It matters a lot about where it goes.
If investors could get, say, 3% risk-free interest for just holding cash and the expected return for equities is low, because of high valuations and it being later in the cycle, then that 3% risk-free looks pretty dang good relative to stocks. So that might drive money to flow out of stocks and into short-dated T-bills.
This action, of risk-premia spreads between assets fluctuating and keying off one another, plays out all along the risk curve. Investors, broadly speaking, try to put their money where they think they’ll receive the best risk-adjusted returns.
And this brings us to the important point that Morgan Stanley talks about in its recent note. The cash rate has recently gone up a bit. It’s now at attractive values relative to higher-risk assets (like overvalued stocks) for the first time in a long time. Here’s what they wrote.
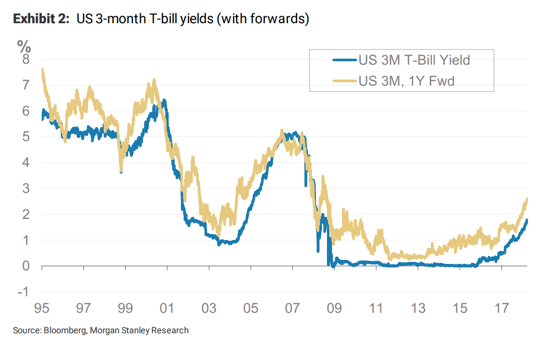
"For 70 months from January 2009 through October 2015, the yield on U.S. three-month Treasury bills averaged 0.07%. As recently as September 2015, the yield was negative, given a lack of supply relative to demand. One doesn’t need a Ph.D. to appreciate the consequences – such low yields gave little incentive to hold cash, and made almost any USD-denominated asset look better by comparison.

But things change. The Federal Reserve has continued to hike interest rates. A swelling US budget deficit has meant more borrowing, much of it concentrated in the front end. In 1Q 18, our interest rate strategists note that there was ~ US $350 billion of commercial paper and T-bill issuance, compared to a 10-year average of just US $80 billion. Meanwhile, the same tax legislation that spurred this borrowing incentivised companies to repatriate cash held overseas, potentially reducing demand for high-quality paper. And foreign banks have ramped up borrowing in short-dated commercial paper, perhaps due to very attractive currency-hedged yields.
The result has been higher short-term rates. 2-year Treasury notes, at 2.28%, offer the highest yield since October 2008. And 3-month bills, which attracted negative yields just 2.5 years ago, now sit near 1.70%.There’s more. The steep curve between bills and notes implies that bill yields will continue to climb. If you believe the forwards, 3-month bills will sit at 2.5% in 12 months (if you don’t believe the forwards, we’re sure our rates business is more than happy to help)."
In a world where assets have been valued off of ZIRP and even NIRP for the better part of the last decade, a projected 2.5% cash rate only a year out from now is a big deal.
This is the primary reason you see rising volatility in the late stages of a bull market. Valuations are stretched, which means their expected future returns are low, and the anchor rate is becoming more attractive on a relative basis. The spread between risk-free assets, like cash, and risky assets like stocks, is thin or non-existent.
So why would anybody choose to hold a risky asset with a lower return when they could just hold cash for the same payout? They don’t, of course. And it’s the aggregate realization of this that leads to a turning of the cycle and a cascade of sell orders as investors dump trash for cash.
Morgan Stanley writes again in the report, using their expected market return model, that the optimal allocation to short-end Treasuries is now at extremely high levels.
Short-term rates act as the ‘anchor’ for the capital allocation line. This ‘anchor’ is dragging upwards, implying higher allocations to short-end bonds for most investors, regardless of vol targets. In fact, on our calculations, the optimal weight to 2-year USTs is now at 12-year highs.

This is the driving force behind volatility in the equity markets. Large portfolio managers are rebalancing their books off this new anchor. And this will continue to be the case as this old-in-the-tooth cycle progresses.
The good news, and the Morgan Stanley rate strategists agree, is that rates won’t continue to move up in a straight line. It looks like the front-end will come down in the new quarter as bill issuance slows. This should, temporarily at least, relieve some of the pressure on equities and stifle volatility.