

The Estee Lauder Companies Inc (EL, Financial) recently reported a daily loss of 1.72%, contributing to a 3-month decline of 6.28%. Despite these figures, the Earnings Per Share (EPS) stands at 1.78. This raises a pivotal question: is The Estee Lauder significantly undervalued? This article delves into a detailed valuation analysis to explore this query, encouraging readers to consider the intrinsic value of The Estee Lauder as we proceed.
Company Overview
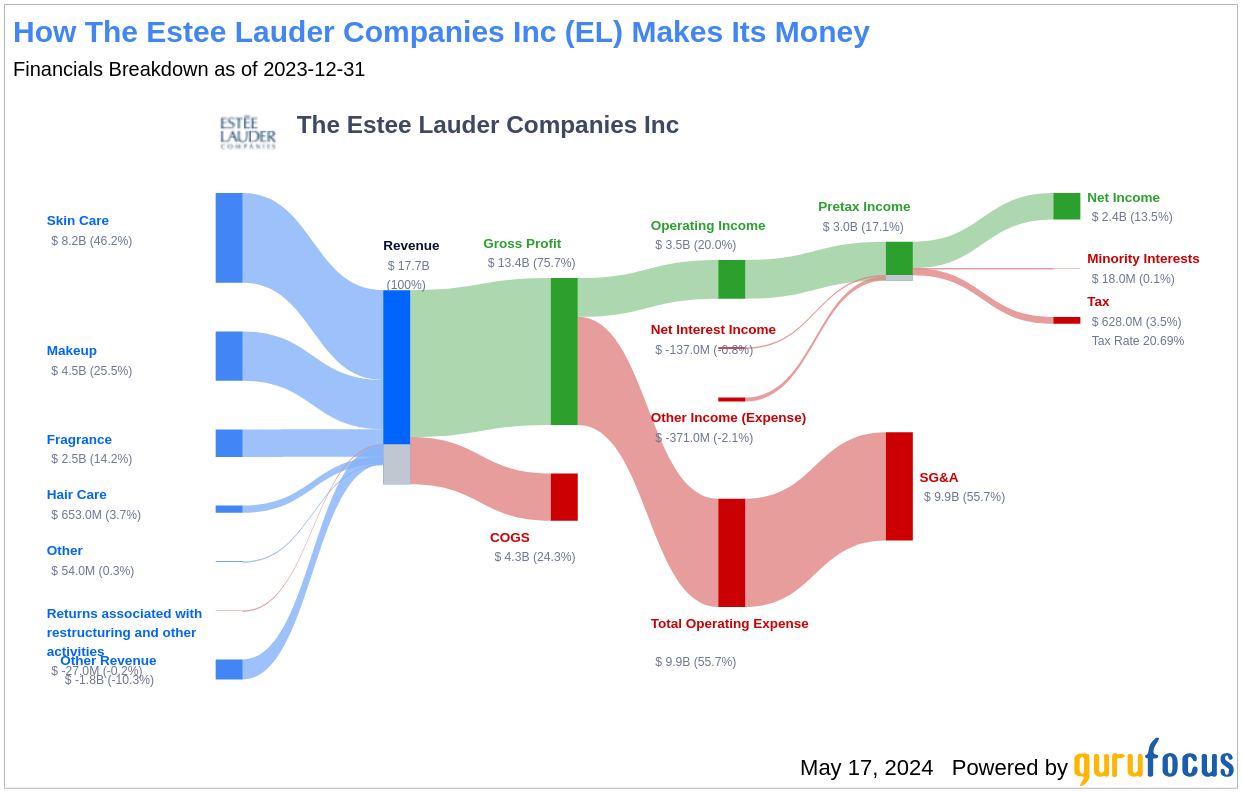
The Estee Lauder Companies Inc, a leader in the global prestige beauty market, operates across various segments including skincare, makeup, fragrance, and hair care. Notable brands under its umbrella include Estee Lauder, Clinique, and M.A.C, among others. The company boasts a broad international presence, with significant revenues generated from the Americas, Europe, the Middle East, Africa, and the Asia-Pacific regions. Despite its current stock price of $135.86, the GF Value estimates its fair value at $221.04, suggesting that the stock might be significantly undervalued.
Understanding GF Value
The GF Value is a proprietary measure reflecting the true intrinsic value of a stock, calculated based on historical trading multiples, a GuruFocus adjustment factor, and future business performance estimates. This metric suggests that The Estee Lauder's stock is currently priced well below its fair value, indicating a potential undervaluation. Historically, stocks priced below their GF Value have shown a higher likelihood of achieving positive future returns.
At a market cap of $48.70 billion, The Estee Lauder presents a compelling case for investors seeking value in an otherwise turbulent market. The significant discrepancy between its market price and the estimated fair value suggests a potential for considerable gains.
Financial Strength and Debt Analysis
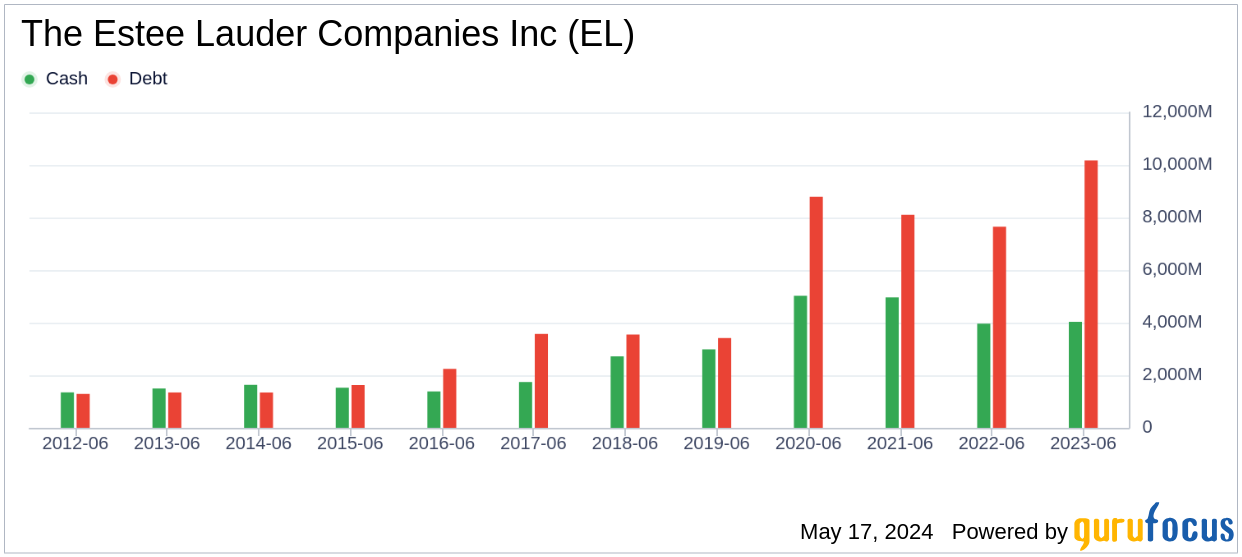
Investors must consider a company's financial robustness before investing. The Estee Lauder's cash-to-debt ratio of 0.38, although not outstanding, is adequate, placing it better than over half of its industry peers. This indicates a fair balance sheet, crucial for sustaining operations and funding future growth.
Profitability and Growth Prospects
The Estee Lauder has consistently demonstrated profitability, with a solid operating margin that surpasses many within its industry. This financial health is complemented by a reasonable growth trajectory, with a 3-year average annual revenue growth of 4.2%. Such figures are promising for potential investors, indicating both stability and potential for future expansion.
Evaluating Investment Returns: ROIC vs WACC
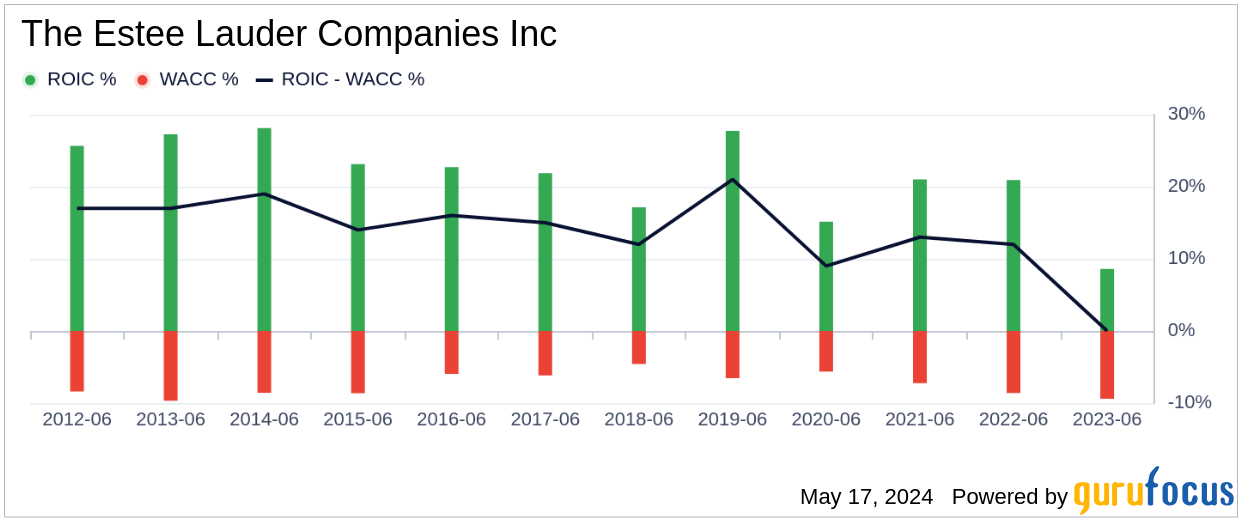
A critical measure of investment attractiveness is the comparison between the Return on Invested Capital (ROIC) and the Weighted Average Cost of Capital (WACC). For The Estee Lauder, the ROIC stands at 5.15, unfortunately below the WACC of 9.16, suggesting that the company is currently generating lower returns on investment than the cost of its capital. This aspect might be a concern for potential investors.
Conclusion
While The Estee Lauder Companies Inc (EL, Financial) appears significantly undervalued based on the GF Value, and its financial condition and profitability are strong, the comparison of its ROIC and WACC suggests areas for improvement. Prospective investors should weigh these factors carefully. For a deeper insight into The Estee Lauder's financials, visit the 30-Year Financials here.
To discover other high-quality companies that may deliver above-average returns, consider exploring the GuruFocus High Quality Low Capex Screener.
This article, generated by GuruFocus, is designed to provide general insights and is not tailored financial advice. Our commentary is rooted in historical data and analyst projections, utilizing an impartial methodology, and is not intended to serve as specific investment guidance. It does not formulate a recommendation to purchase or divest any stock and does not consider individual investment objectives or financial circumstances. Our objective is to deliver long-term, fundamental data-driven analysis. Be aware that our analysis might not incorporate the most recent, price-sensitive company announcements or qualitative information. GuruFocus holds no position in the stocks mentioned herein.