Crude oil has been trading within the range of $75-$80 for the fourth consecutive week with investors now focusing on a slowing and rising inventories in the United States, one of the top two oil consumers in the world.
However, the latest data indications from these two areas are not at all encouraging, and I will discuss some of them in the following sections.
Rising Inventories
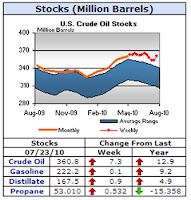
The latest EIA inventory report for the week ending July 23 showed a build of 7.3 million barrels in crude when the market expectation was for it to decline. The crude stocks level is now above the 5-year average while crude products inventories including gasoline and distillate also increased (See graph from the EIA)

Even More Troubling …
The even more troubling data; however, is that the inventory build has continued despite the following:

However, the latest data indications from these two areas are not at all encouraging, and I will discuss some of them in the following sections.
Rising Inventories
The latest EIA inventory report for the week ending July 23 showed a build of 7.3 million barrels in crude when the market expectation was for it to decline. The crude stocks level is now above the 5-year average while crude products inventories including gasoline and distillate also increased (See graph from the EIA)

Even More Troubling …
The even more troubling data; however, is that the inventory build has continued despite the following:
- A refinery utilization of 90.6%, close to the three-year high of 91.5% hit the week before.
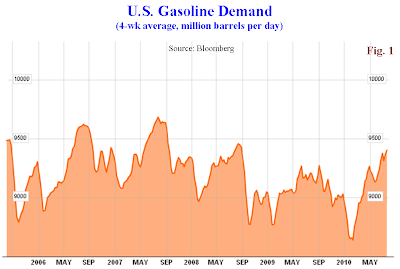
- A recovering 4-week average gasoline demand of 9.632 million b/d, just about 282.000 b/d lower than the all time high of 9.681 million b/d in July 2007 (Fig. 1).

50% OPEC Quota Compliance
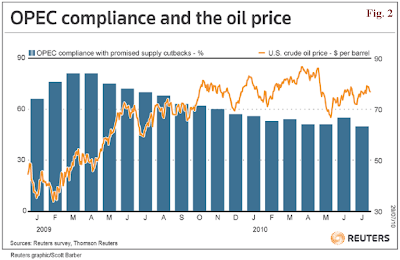
Most of the build may be attributed to imports, which hit the highest level since August 2006. A Reuters survey shows OPEC quota compliance rate dipped just below 50% in July (mostly due to a big export jump from Nigeria), which is also reflected in the Gulf Coast region inventory numbers.
Although the extra OPEC production does not appear to have negatively impacted the price of oil yet, it is one of the major contributing factors in the rising stocks (Fig. 2).

GDP Blues
The U.S. economy grew 2.4% in Q2, less than the consensus forecast of 2.5%, while Q1 GDP was revised up to 3.7% (from 2.7%). But excluding the business inventories rebuilding and adjusting, the true Q2 GDP growth would be less than 2%.
Of course, one quarter of less than 3% growth post-crisis does not look too bad on its own. Nevertheless, considering the U.S. GDP went from 5% (revised down) in Q4 2009, to 3.7% in Q1 and 2.4% in Q2, a worrisome downward trend emerges--the economy is supposed to be getting stronger, instead of this fast deceleration seen in the past three quarters.
Labor Market & Consumer Blues
Consumer spending drives about 70% of the U.S. economy, and the stubbornly soft labor market does not bode well with consumer spending.
The national unemployment rate is hovering close to 10%. With that, workers have no pricing power, constantly stressed over job security, and thus becoming thrifty. This is reflected in the rising consumer savings rate—6.2% in Q2—and the meager 1.6% year-over-year wage and salary increase in Q2 for all workers within the private industry.
On the other hand, companies, faced with high uncertainty in the economy and government policy, are reluctant to hire full time, and rely primarily on “streamlining” and holding down headcount to boost profits.
Now, according to a Bloomberg survey, many economists are expecting unemployment to rise in July with the continuing cooling in the manufacturing and services sectors. This trend will likely keep a lid on household spending in the near to medium term.
Housing Blues
No economies can stage a meaningful comeback without housing’s participation. The latest housing numbers are sending quite the opposite message.
In June, new-home sales were 330,000 units, the second lowest on record, while new Fannie and Freddie foreclosures increased sharply--up 21% in June from May.
With the expiration of first time buyer credit, and 25% of the nation's mortgages underwater, further fall in home values and more delinquencies/defaults could significantly increase the risk of a double-dip in the real estate sector, with the second half of 2010 being the most critical period.
Credit Blues
The level of lending is an important factor in economic recovery as consumers and small business rely on heavily on credit lines to fund major spending.
However, billions of TARP infusion and guaranteed profits from Fed’s almost free money have failed to incentivize banks to increase lending. Banks, instead, are hoarding cash to shore up their capitals for more future bad loans and/or seeking higher returns through equities and commodities vs. lending.
A WSJ analysis of 19 biggest TARP recipient banks published in April concluded that
China has been the main driver of the commodity price since the financial crisis. While Beijing says China’s full-year expansion in 2010 is still expected to be as much as 9.5%, recent data indicate China economy is slowing down mainly due to Beijing clamping down on property markets.
One indicator with more significant crude oil demand implication is that China’s manufacturing (PMI) grew at the slowest pace in 17 months in July.
A Synchronized Global Slowdown
These macroeconomic indications discussed here suggest we could see a synchronized global slowdown in the second half with developed nations mired with debt, and emerging countries cooling off to prevent bubbles.
At the same time, the United States is undergoing a longer than expected deflationary cycle insufficient for meaningful job creation and true demand growth. This also increases the odds of another recession in the U.S.
With the U.S. summer driving season basically over for this year, a slowdown in China, and unless there are new strong indications that U.S. economy has truly turned the corner, crude oil is expected to be under increasing pressure through the rest of the year.
Nevertheless, as the world's reliance on fossil fuel will remain at 46% by 2050 (IEA projection), any price drop should provide investors with a good level to get into long positions.
By Dian L. Chu,
Economic Forecasts & Opinions
The U.S. economy grew 2.4% in Q2, less than the consensus forecast of 2.5%, while Q1 GDP was revised up to 3.7% (from 2.7%). But excluding the business inventories rebuilding and adjusting, the true Q2 GDP growth would be less than 2%.
Of course, one quarter of less than 3% growth post-crisis does not look too bad on its own. Nevertheless, considering the U.S. GDP went from 5% (revised down) in Q4 2009, to 3.7% in Q1 and 2.4% in Q2, a worrisome downward trend emerges--the economy is supposed to be getting stronger, instead of this fast deceleration seen in the past three quarters.
Labor Market & Consumer Blues
Consumer spending drives about 70% of the U.S. economy, and the stubbornly soft labor market does not bode well with consumer spending.
The national unemployment rate is hovering close to 10%. With that, workers have no pricing power, constantly stressed over job security, and thus becoming thrifty. This is reflected in the rising consumer savings rate—6.2% in Q2—and the meager 1.6% year-over-year wage and salary increase in Q2 for all workers within the private industry.
On the other hand, companies, faced with high uncertainty in the economy and government policy, are reluctant to hire full time, and rely primarily on “streamlining” and holding down headcount to boost profits.
Now, according to a Bloomberg survey, many economists are expecting unemployment to rise in July with the continuing cooling in the manufacturing and services sectors. This trend will likely keep a lid on household spending in the near to medium term.
Housing Blues
No economies can stage a meaningful comeback without housing’s participation. The latest housing numbers are sending quite the opposite message.
In June, new-home sales were 330,000 units, the second lowest on record, while new Fannie and Freddie foreclosures increased sharply--up 21% in June from May.
With the expiration of first time buyer credit, and 25% of the nation's mortgages underwater, further fall in home values and more delinquencies/defaults could significantly increase the risk of a double-dip in the real estate sector, with the second half of 2010 being the most critical period.
Credit Blues
The level of lending is an important factor in economic recovery as consumers and small business rely on heavily on credit lines to fund major spending.
However, billions of TARP infusion and guaranteed profits from Fed’s almost free money have failed to incentivize banks to increase lending. Banks, instead, are hoarding cash to shore up their capitals for more future bad loans and/or seeking higher returns through equities and commodities vs. lending.
A WSJ analysis of 19 biggest TARP recipient banks published in April concluded that
“Excluding mortgage refinancings, consumer lending dropped by about one-third between October and February. Commercial lending slumped by about 40% over that period, the data indicates.”China Blues
China has been the main driver of the commodity price since the financial crisis. While Beijing says China’s full-year expansion in 2010 is still expected to be as much as 9.5%, recent data indicate China economy is slowing down mainly due to Beijing clamping down on property markets.
One indicator with more significant crude oil demand implication is that China’s manufacturing (PMI) grew at the slowest pace in 17 months in July.
A Synchronized Global Slowdown
These macroeconomic indications discussed here suggest we could see a synchronized global slowdown in the second half with developed nations mired with debt, and emerging countries cooling off to prevent bubbles.
At the same time, the United States is undergoing a longer than expected deflationary cycle insufficient for meaningful job creation and true demand growth. This also increases the odds of another recession in the U.S.
With the U.S. summer driving season basically over for this year, a slowdown in China, and unless there are new strong indications that U.S. economy has truly turned the corner, crude oil is expected to be under increasing pressure through the rest of the year.
Nevertheless, as the world's reliance on fossil fuel will remain at 46% by 2050 (IEA projection), any price drop should provide investors with a good level to get into long positions.
By Dian L. Chu,
Economic Forecasts & Opinions