
Moderate to high dividend yield has long been the investor’s prime attraction for investing in electric utilities. The fact that electric utilities provide essential services is a plus and a negative at the same time. The plus is, a perceived at least, recession resistance that implies stability. The negative is heavy regulation that stifles growth potential.
Add it all up and electric utility investments are considered to provide good stable dividend income but muted growth potential. To some extent this makes electric utilities analogous to bonds. Bonds offer safety and yield, but no growth. Electric utilities are considered safe equities, but not as safe as bonds. Therefore, they offer yield like bonds, but with a modicum of growth to compensate investors for the higher risk.
Historically, because they are a regulated industry, electric utilities have generated earnings growth of approximately 1% to 5% per annum. This is significantly less than the mostly double-digit earnings growth of blue-chip dividend paying stalwarts like; Johnson & Johnson (JNJ), Clorox (CLX), Colgate-Palmolive (CL) and Procter & Gamble (PG), just to name a few. To compensate for their lack of growth, electric utilities typically have offered higher payout ratios and therefore more current yield.
Earnings growth of only 1% to 5%, and therefore a dividend growth of only 1% to 5% places electric utilities into the low growth category of stocks. The thrust of this series of articles relates to how to value low, moderate and/or high-growth stocks in order to know when to make sound and prudent buy/ sell decisions and why. In Part 1 we mentioned that earnings growth rates are where values are ultimately derived. We also mentioned that not all companies are valued the same.
When evaluating low growth stocks, such as electric utilities, we are once again drawn to comparisons and analogies with bonds or fixed income in order to calculate a proper or prudent multiple of earnings to pay for the low growth utilities. Bonds, even with no growth, are capitalized at a multiple of the interest they pay.
For example, a bond paying 8% (high by today's standards, but normal historically) trades at 12.5 times interest (100 divided by eight equals 12.5) or a price to interest ratio of 12.5. As an aside, today's 30 year treasury bond yielding 4% (3.99% actual), trades at an unusually high 25 times interest. Given the above, it only stands to reason that an equity with more perceived risk, even low growth equities, are also worth a multiple of their income stream. Finding the right multiple in order to make a prudent investment decision is a primary objective of this series.
In the intelligent investor, Ben Graham, along with partner David Dodd, described a formula to value stocks, and revised it in 1974. To learn more you can Google: Ben Graham’s formula for valuing a stock. Through research and trial and error, we concluded that Ben’s formula works extremely well for valuing low growth (1% to 5%) stocks like electric utilities. Therefore, we developed a version of our F.A.S.T. Graph™ tool to value companies growing earnings between 1% to 5% per year, based on the Graham Dodd Formula (GDF).
This Graham and Dodd version of our graphs are marked in orange letters GDF (Graham Dodd Formula) to the right of the picture followed by a number that reflects the formula derived PE ratio indicating fair value. Therefore, when our software calculates an earnings growth rate of 5% or less for any company, it will automatically prepare a GDF version of our research tool’s graph. The earnings growth rate associated with each company will be posted in green ink just above the orange letters and numbers.
When viewing the graphs, be aware that the orange line represents the proper valuation at which to buy a stock at based on a calculated PE ratio or multiple of earnings. Simply stated, this implies only buying when the black price line is touching, or better yet, below the orange valuation line. Most importantly, be aware that expected capital appreciation will equate to the earnings growth rate potential of the business.
So to be clear, the orange valuation line depicts fair value, and the earnings growth rate represents capital appreciation potential. In other words, if you purchase a stock, when it touches the orange valuation line you can expect a return from capital appreciation that correlates to or is equal to the earnings growth rate adjusted for any valuation discrepancies. The historical F.A.S.T. Graphs™ provide a preponderance of compelling evidence to validate these statements.
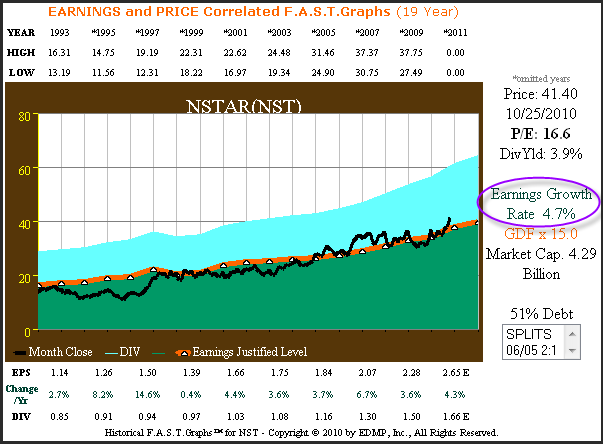
The following F.A.S.T. Graphs™ on NSTAR (NST), the largest Massachusetts-based, investor-owned electric and gas utility, with revenues of approximately $3 billion and assets totaling approximately $8 billion, provides a quintessential example of a GDF F.A.S.T. Graph™. Notice how closely the black stock price line tracks the orange earnings justified PE of 15 valuation line. This visually illustrates that any investor considering NSTAR (NST) would be wise to only invest when the PE ratio is 15 or less. The light blue shaded area indicates the dividends that are paid out of the green shaded area or earnings.
NSTAR 19 year price and earnings correlated
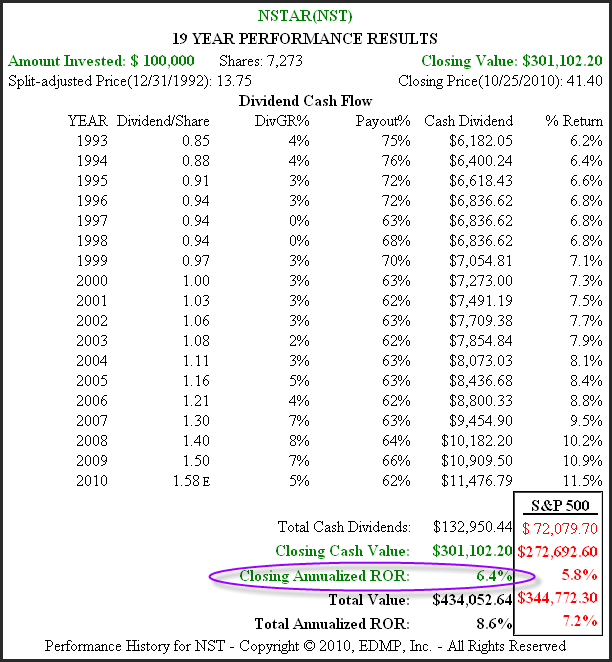
In Part 1 of this series we waxed on about how a company's value is derived from the amount of cash flow (earnings) that they are capable of generating for their stakeholders (stockholders). We also pointed out that faster growing companies are worth more than slower growing companies. From the calculated performance graph on NSTAR (NST) below, you'll see how important and valid these statements are.
From the price and earnings correlated graph above you will notice that NSTAR’s (NST) stock price is currently above the orange earnings justified valuation line and therefore slightly overvalued. Otherwise, you also note that shareholders’ closing annualized rate of return (capital appreciation) of 6.3% (purple circle) equates very closely to the earnings growth rate of 4.7% (purple circle). Ending overvaluation explains the closing annualized rate of return being slightly more than earnings growth. From the dividend cash flow table note how the dividend growth rate correlated to the historical earnings growth rate. Finally, note how the payout ratio has consistently exceeded 60%.
NSTAR 19 year calculated performance
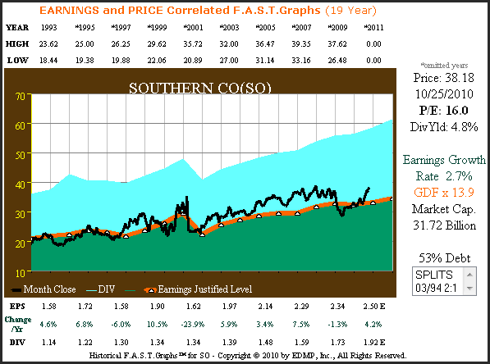
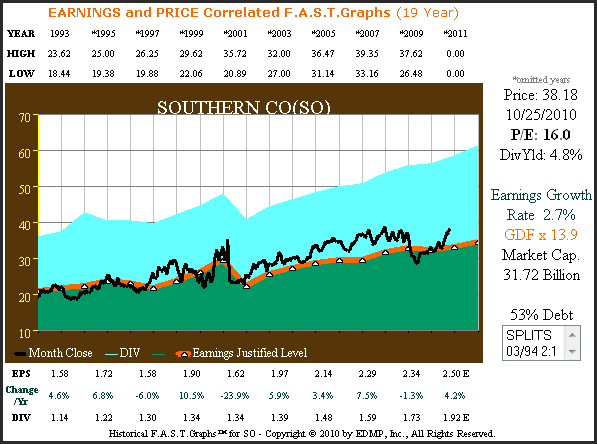
Our next example features The Southern Company (SO) which owns all of the outstanding common stock of Alabama Power, Georgia Power, Gulf Power, and Mississippi Power, each of which is an operating public utility company. In this example you'll find a much lower historical earnings growth rate which calculates a GDF fair value PE ratio of 13.9 for the Southern Company (SO). Once again you will see that price tracks earnings very closely and you will discover a closing valuation PE ratio of 16 which is above the 13.9 fair value PE. The light blue shaded area indicates the dividends that are paid out of the green shaded area or earnings.
Southern Company 19 year price correlated to earnings
Southern Company 19 year performance
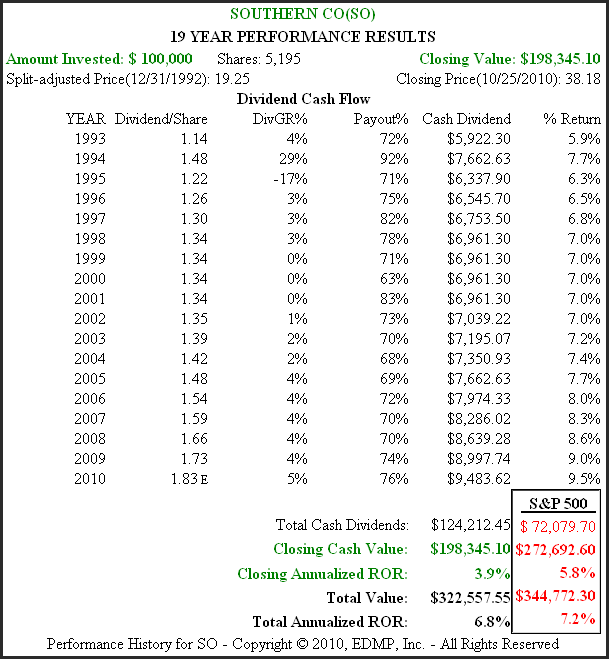
From the calculated performance graph associated with the Southern Company’s (SO) 19 year price correlated to earnings graph, you once again see the importance and significance of earnings regarding closing annualized rate of return (capital appreciation) and the generation of dividends to include the growth of dividends.
A study of a cross-section of utility stocks, by the numbers (F.A.S.T. Graphs™)
The following links take you to a cross-section of utility stocks in various parts of the country. We've also included a link covering a miscellaneous grouping of gas, water, oil and gas storage and transportation. The first two examples, NSTAR (NST) and Southern Company (SO), were quintessential examples of price and earnings correlated F.A.S.T. Graphs™. Most of the companies that you review in these links will provide similar examples. However, there are exceptions to every rule.
Throughout these links you will find examples of utility stocks with very low rates of earnings growth of 1% or even less. With these extreme examples it will appear at first glance that the F.A.S.T. Graph™ correlation of earnings to price doesn't hold. Since earnings growth is so low in these examples we've included a normal price earnings ratio (blue line with asterisks). When viewing these extreme examples the normal PE ratio becomes more relevant as the fair value indicator. After clicking on the link go to the drop down arrow (top left) to advance to the next company.
Summary
As most readers are aware, common stock investing encompasses two important return components that together comprise total return. The first component is capital appreciation, or growth of principal. The second component is income, which will come from dividends if the company pays one. Of course, when there is no dividend, the investor is relying solely on growth of capital. On the other hand, when investor buys a company that does pay a dividend, they are enjoying both a return of and a return on their original capital investment. (Note that for clarity regarding each return component, we do not reinvest dividends they are assumed taken).
In all cases, total return will ultimately be a function of the income stream generated through earnings growth. As discussed in Part 1 of this series, the velocity of earnings growth will determine the ultimate size of the income stream that investor will benefit from. The bigger the income stream, the more assets the market will have to capitalize and the more cash the company will have from which to pay dividends. Therefore, the potential for investors to receive a higher return is greater when earnings growth is higher.
When investing in low growth dividend paying utility stocks, the importance of dividends is paramount. When earnings growth is low, any interruption of any kind can greatly affect the capital appreciation component. With low growth dividend paying utility stocks, the rational investor understands that total return expectations will be less than they could expect from higher growth companies.
Investors have traditionally looked to electric utility stocks for stable, albeit low, growth and high dividend yields. Although they are usually monopolies in the areas they operate in, they are also highly regulated in most states. Considered boring by many, utility stocks have traditionally appealed to retirees and other income seeking investors. A thorough review of the F.A.S.T. Graphs™ on the 26 utility companies featured in this article, validate investor confidence in the aggregate. However, a thorough review of these 26 utility stocks also reveals exceptions to the generally held view that utilities are stable.
Potential investors need to be conscious of the reality that electric utilities are heavily regulated and capital intensive. Furthermore, recent legislation regarding alternative energy mandates has the potential to radically change the future business prospects of this industry. Although there is a lot to be learned from the past, it's important to remember that we can only invest in the future. Therefore, a comprehensive analysis of this industry's future prospects is imperative.
Conclusions
We hope this article provided the reader a more comprehensive and enlightened understanding of investing in low growth dividend paying utility stocks. As covered in this article, utility stocks provide a classic example of dividend paying stocks with low growth. Consequently, investors need to be very careful regarding the valuation they are willing to pay before they buy them. When growth is 5% or lower, like it is for most utility stocks, there is little or no margin of safety if things should go wrong. Investors need to remember a famous Warren Buffett admonition: "Price is what you pay, but value is what you get."
The next article in our series will cover dividend paying blue-chip stalwarts with moderate growth, which we define as above 5% but less than 15%. Although we will use a different iteration of our F.A.S.T. Graphs™ in order to ascertain fair value, the principles behind the correlation of long-term stock prices and earnings will continue to be validated. One of the important distinctions that will be illustrated with these faster growing companies is a higher total return.
Dividends will continue to be of great importance, but as you will see, capital appreciation will have a much greater importance than it does when growth is lower. When it's all said and done, as long as the principles of sound valuation are honored and respected, these faster growing businesses will generate higher total returns. Starting dividend yields will be lower, but the dividends will grow much faster. On the other hand, the total dividends paid overtime will be slightly lower, but as you will discover, in many cases only modestly so.
Disclosure: Long: scg,pg,clx,jnj,cl
The opinions in this document are for informational and educational purposes only and should not be construed as a recommendation to buy or sell the stocks mentioned or to solicit transactions or clients. Past performance of the companies discussed may not continue and the companies may not achieve the earnings growth as predicted. The information in this document is believed to be accurate, but under no circumstances should a person act upon the information contained within. We do not recommend that anyone act upon any investment information without first consulting an investment advisor as to the suitability of such investments for his specific situation.