
As 2011 begins, the growing legion of investor's seeking retirement income, are faced with the same conundrum they faced in 2010. Interest rates remain at near all-time lows which severely limit attractive investment options to meet their income needs. After being traumatized by the great recession of 2008, safety and risk aversion are of the highest priority. But alas, fixed income instruments (bonds, CDs, etc.) the traditionally safest investment vehicles offer scant yields and therefore abnormally high risk profiles at today's rates.
In contrast, the situation for high-quality dividend paying common stocks has rarely been as attractive as it is today. Current valuations of many best-of-breed, blue-chip large-cap stalwarts are historically low. With valuations abnormally low, the current entry-level dividend yields for many of these high-quality companies is higher than would normally be expected.
Sensible investors can put together a diversified portfolio of these blue chips with beginning dividend yields approaching what they could earn from a 10 year treasury bond. Better yet, these portfolios can be expected to increase their dividend yield every year as they historically have.
A potential side effect of these low valuations and higher than normal yields, is the opportunity for higher than normal total returns at lower than traditional levels of exposure to risk. We attribute this notion of lower risk levels for equities based on the principle of valuation. In the not-too-distant past, equities were trading at valuations that were high based on historical standards. Two very bad things happen to investors when valuations are excessive. Not only is the potential for future return greatly diminished, but also the risk taken to achieve these lesser results is greater.
Lower returns achieved at higher levels of risk, is not the appropriate formula to assist investors in achieving their financial goals. Meanwhile, the opportunity to generate higher than normal returns at lower than normal levels of risk is rare, but very attractive when available.
Unfortunately, human nature often makes it very difficult for people to take advantage of rare opportunities that occur. People will all too often take their cues from what has happened rather than evaluate what will happen. Since the 1990s, interest rates have generally declined. Therefore, the prices of already issued bondshave been strong. Therefore, people have been comfortable owning bonds since the 1990s.
The opposite has been true for common stocks since the 1990s. Because valuations were excessively high, common stock prices had been in a general decline from the 1990s into the recession of 2008. Consequently, because people that owned common stocks mostly lost money since the 1990s, their attitude toward stocks is negative and jaundiced. The irony in all of this is that now that stocks are finally reasonably priced, investors are avoiding them like the plague. Instead of investing in quality stocks on sale, they are choosing to invest in bonds in droves when bond prices are at record highs.
Low yields like we see today, indicate overvaluation in the price of bonds. When rates move back to normal, as we believe they inevitably must, the prices of bonds issued at these low rates will surely fall. Potentially, if interest rates go back to normal levels, long bond values could be cut in half.
10 Quality Dividend Stocks for Total Return
In consideration of what was written above, we screened our universe of quality dividend companies with a bias towards safety first, yield second and growth last. Our primary focus was on operating performance, i.e. above-averageand consistent historical earnings growth and growing dividends that followed suit. Our minimum yield requirement was 2%, which is greater than the average current yield on the S&P 500 of 1.8%. The blended yield of our 10 selections equally weighted is 2.87%.
We also sought double-digit consensus forecast earnings growth, however, we did accept forecast earnings per share growth of 9% or above on five of our highest quality selections. In these five cases we applied a quality premium in the spirit of safety first. In the same vein of safety first, financials were excluded.
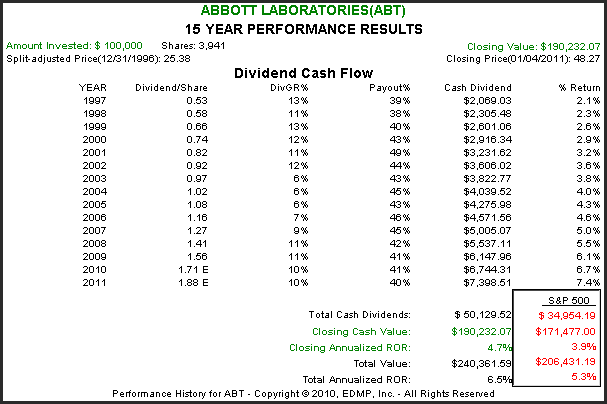
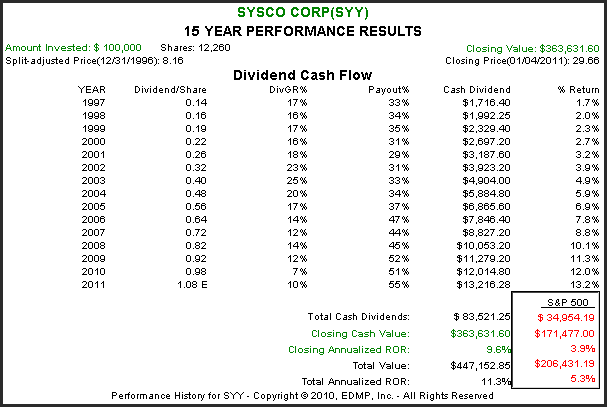
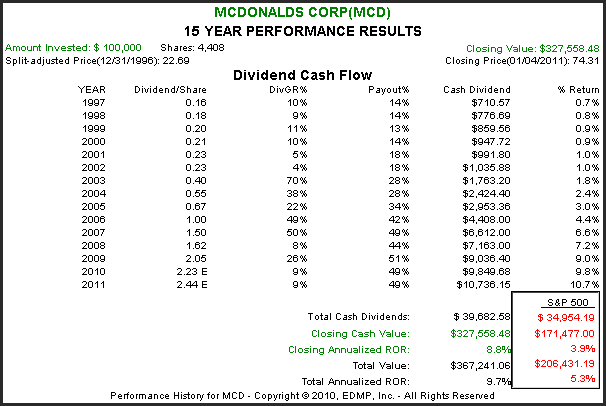
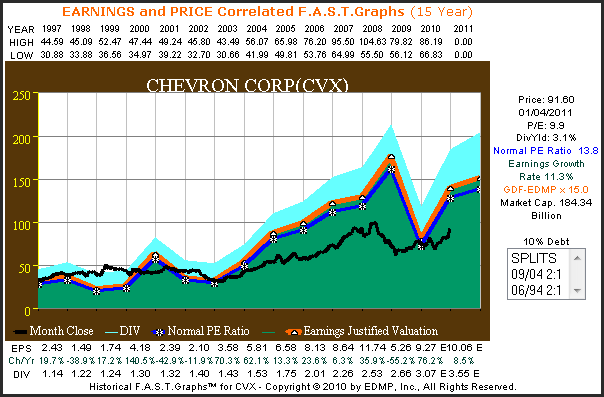
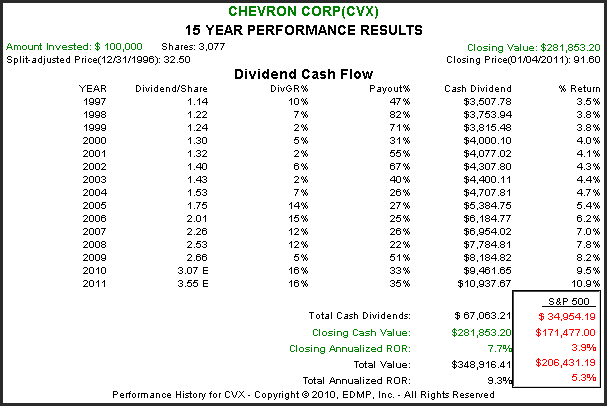
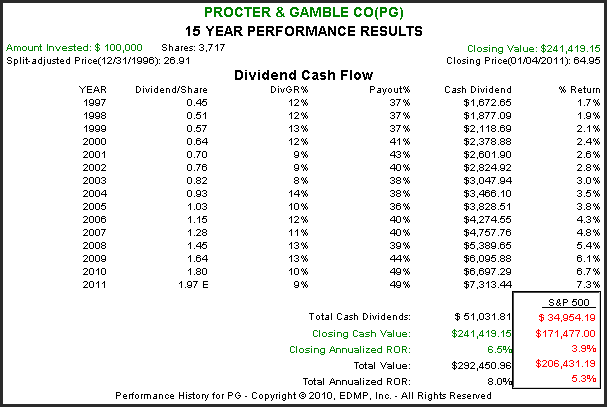
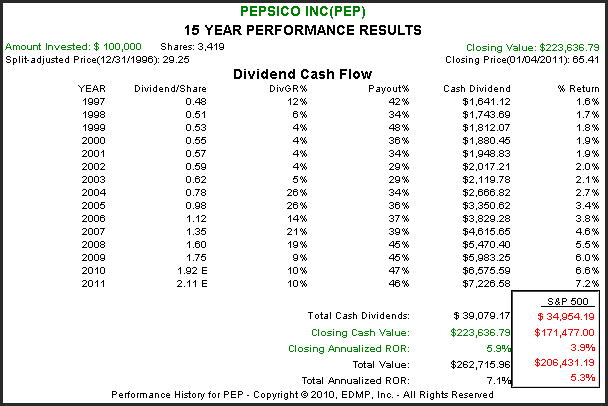
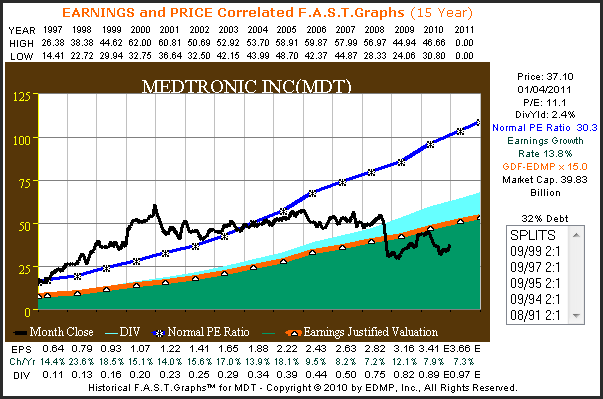
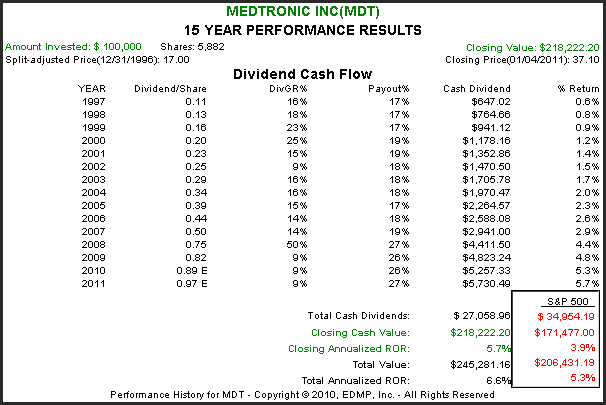
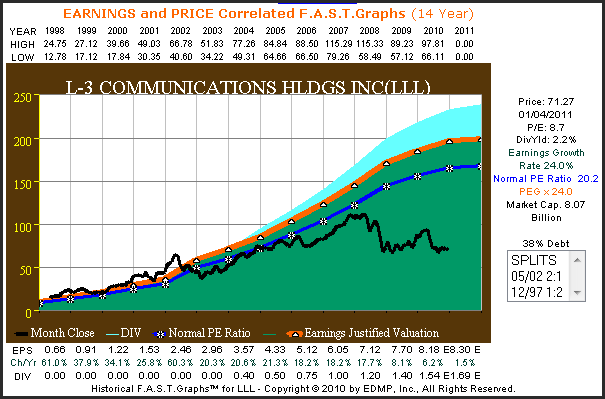
The following presentation of these 10 high-quality dividend paying common stocks with an above-average growth component is offered through the lens of our F.A.S.T. Graphs™ research tool. On each selection we will present a 15 year price and earnings correlated historical graph (note that the graphs have 14 years of history and one year forecasting), followed by the historical performance associated with each graph to include a table of dividends paid.
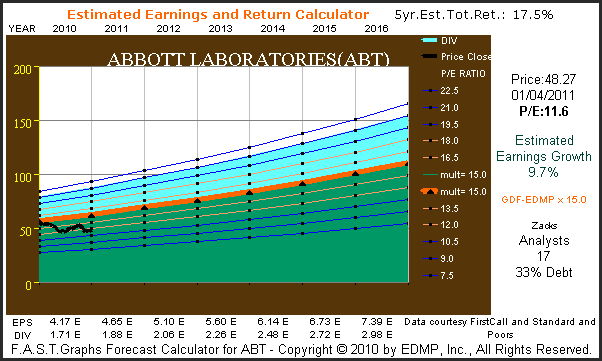
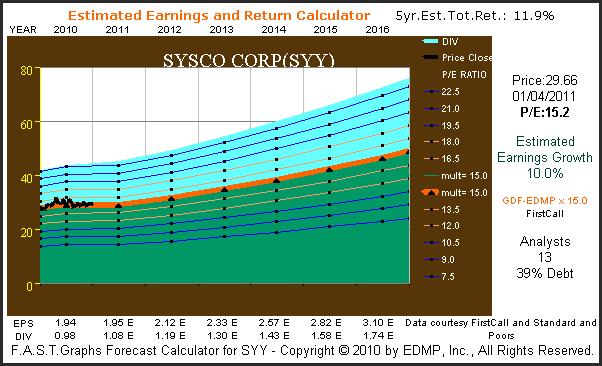
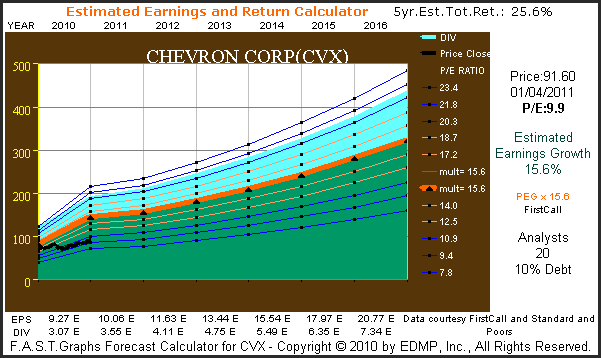
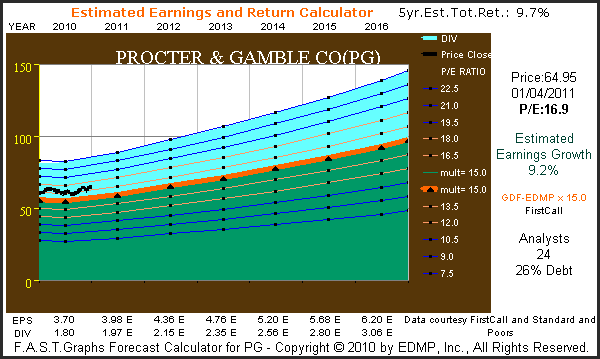
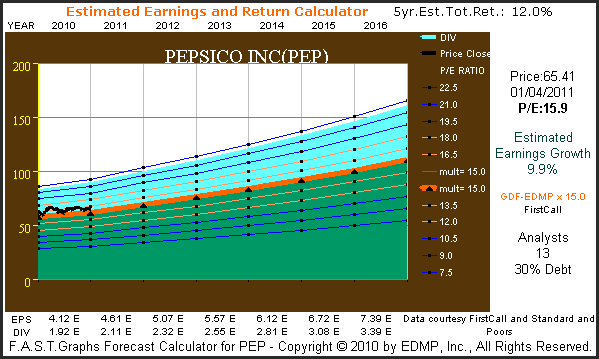
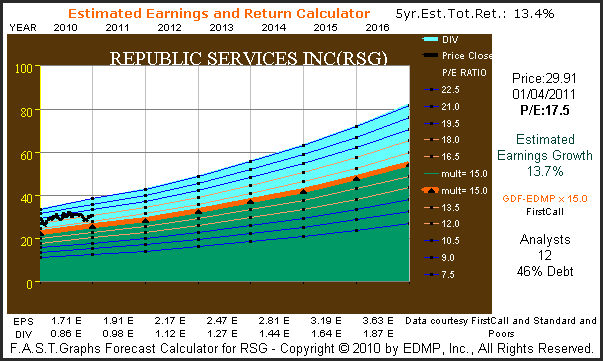
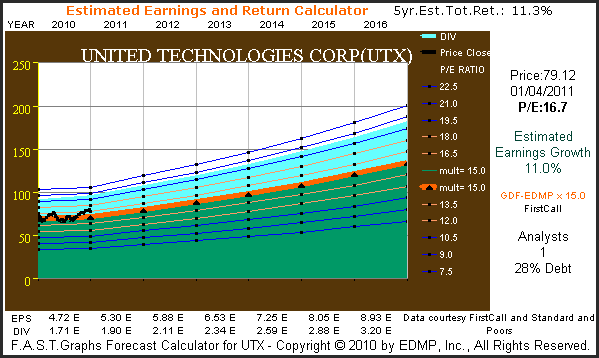
Next, we will provide a forecast calculator based on the consensus five-year earnings growth estimates reported to either FirstCall or Zacks. At the top right of each forecast graph will be a calculated five-year estimated total return, which includes potential dividends, based on each company meeting their growth expectations and the market capitalizing those future earnings at appropriate values.
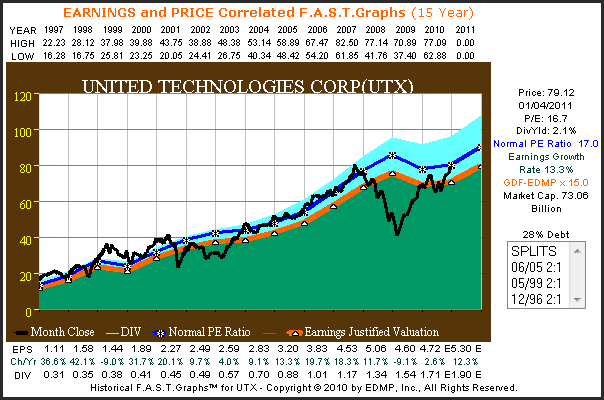
For those readers unfamiliar with our F.A.S.T. Graphs™ research tool we offer the following explanation of each component of the graphs. The orange line with white triangles plots earnings per share multiplied by an appropriate formula for valuing a company's earnings. We refer to this orange line as the earnings justified valuation line. The black line represents monthly closing stock prices. The blue line represents a calculated historical normal PE ratio that the market has applied to each company and is offered for historical perspective. The green shaded area represents cumulative earnings over the time period covered, and the light blue shaded area illustrates dividends paid out of those earnings.
We believe the most important benefits these F.A.S.T. Graphs™ provide are the ability to evaluate how well a company has historically performed on an operating basis, and to see how the stock market has historically rewarded that performance. But most importantly, these powerful fundamentals-based tools provide a clear perspective of valuation.
Consequently, as you review the historical graphs, pay special attention to how overvalued many of these companies have historically been compared to how reasonably valued they are today. We believe that valuation matters a lot, and is one of the key components of risk that is often ignored by price conscious investors.
The following F.A.S.T. Graphs™ are listed from highest dividend yield to lowest dividend yield.
Abbott Laboratories (ABT, Financial) 3.6% Dividend Yield
Earnings and Price Correlated F.A.S.T. Graphs™

Performance Results
Estimated Earnings and Return Calculator

Performance Results
Estimated Earnings and Return Calculator

Performance Results
Estimated Earnings and Return Calculator

Performance Results
Estimated Earnings and Return Calculator
Procter & Gamble Co (PG, Financial) 3.0% Dividend Yield
Earnings and Price Correlated F.A.S.T. Graphs™

Performance Results
Estimated Earnings and Return Calculator

Performance Results
Estimated Earnings and Return Calculator
Republic Services Inc (RSG, Financial) 2.7% Dividend Yield
Earnings and Price Correlated F.A.S.T. Graphs™

Performance Results

Estimated Earnings and Return Calculator
Performance Results
Estimated Earnings and Return Calculator

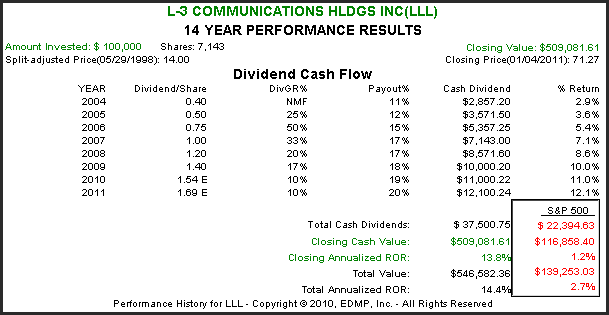
L-3 Communications (LLL, Financial) 2.2% Dividend Yield
Earnings and Price Correlated F.A.S.T. Graphs™
Performance Results
Estimated Earnings and Return Calculator

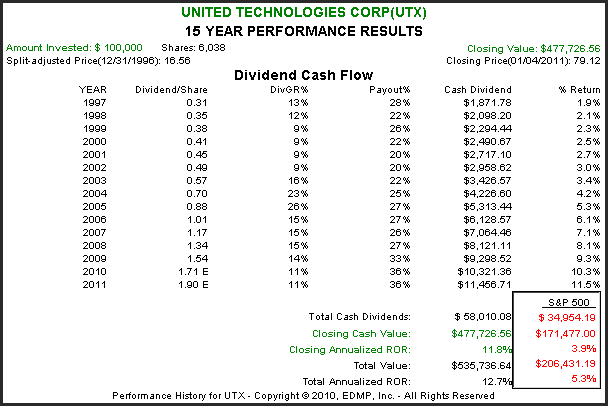
United Technologies Corp (UTX, Financial) 2.1% Dividend Yield
Earnings and Price Correlated F.A.S.T. Graphs™
Performance Results
Estimated Earnings and Return Calculator
Conclusions
The above selections were offered in order to provide readers an opportunity to evaluate a diversified portfolio of high-quality dividend paying companies that are trading at sensible valuations. The objective behind this group of holdings was to provide a high quality dividend income stream with the potential to increase over time. Additionally, the opportunity to earn double-digit capital appreciation was given a high priority.
However, the most important attribute that we feel this group of companies offer is a low risk profile relative to equities in general. On the other hand, if the forecast earnings objectives were to be achieved, this portfolio would have the potential to generate very attractive long-term total returns. And of course, what is offered here is only a starting point for a more comprehensive and recommended research effort on behalf of each investor.
The opinions in this document are for informational and educational purposes only and should not be construed as a recommendation to buy or sell the stocks mentioned or to solicit transactions or clients. Past performance of the companies discussed may not continue and the companies may not achieve the earnings growth as predicted. The information in this document is believed to be accurate, but under no circumstances should a person act upon the information contained within. We do not recommend that anyone act upon any investment information without first consulting an investment advisor as to the suitability of such investments for his specific situation.