
Background: BP is one of the world’s leading international oil and gas companies. It suffered mightily in 2010 due to the Gulf of Mexico oil spill. At that time a few brave souls spoke about the value in BP. Whitney Tilson was one of them and his presentation can be found here.
More than a year has now passed and a lot of uncertainty and unknowns have gone away. However, the price of the stock has not moved as dramatically as one would have expected (given how dramatically it moved after the incident). This brings us to today’s value idea.
Earnings
Company operates in two main segments:
• Exploration and Production
• Refining and Marketing
Other business including low carbon footprint are placed under Other Business and Corporate. BP makes it very easy to look at their financials as they provide a s/s. The first stop is to look at the earnings over the last five years.
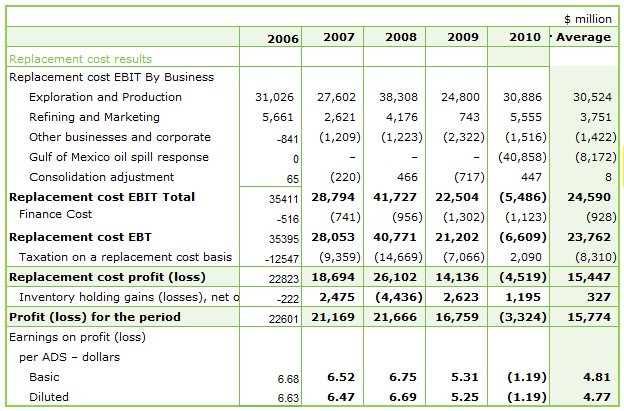
A few key highlights:
• Exploration & Production is a very profitable business and produces on average $30 billion operating profit annually.
• Refining and Marketing is more volatile business but has been solidly profitable to the tune of $3.75 billion operating profit annually.
• Gulf of Mexico has a big impact on the company and they took a charge to the tune of $41 billion.
• Even after the big charge, company has on average over the last five years provided net profit of $15.75 billion annually. This translates to $4.77/ADS.
The above five years are great representative years for the company because they accounts for the big changes in oil prices as well as one of the worst operational disasters in BP history. So these numbers are likely to be conservative as we look into the future.The next stop is to understand how the company has used the above earnings.
Cash Flow
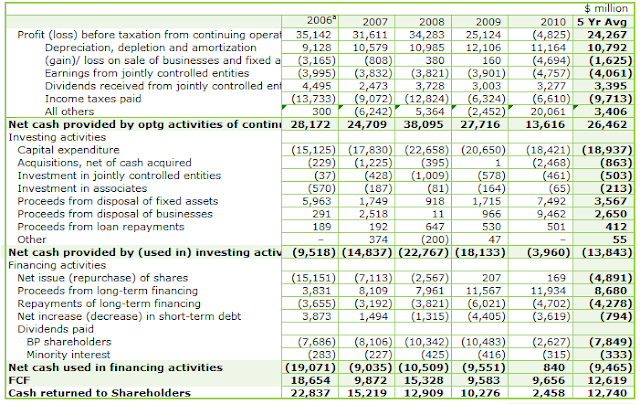
A few key highlights:
• Cash Flow from Operations has been a very significant $26.5 billion annually. At a very high level this corresponds to 15.5 billion of Net Profit (seen earlier) and approximately $11 billion of Depreciation charges.
• On average, capex is 19 billion annually. This is funded through depreciation charges of $11 billion $; $5 billion $ of disposals (see above and net proceeds from disposals vs. investments), and the remaining from the other operating cash flow.
• BP has been buying around $5 billion $ worth of shares annually and a big portion of that has been funded by taking on additional debt.
• Between share repurchases and dividends, BP has returned $12.75 billion $ of value annually. At today’s market value of $126 billion, that is an annual return of around 10%, which is quite significant. This period includes 2010, when the dividend was cut and the company went through significant crisis.
Overall, cash flow analysis gives us the comfort that a company has been regularly paying the shareholders back. A 10% yield including share buy backs is pretty impressive.
Valuation
Let us look at the valuation in a few different ways:
• P/E
• EV/EBITDA
• P/FCF
• EV/Reserves
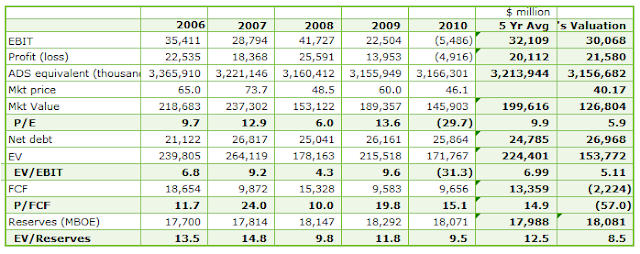
A few interesting observations from the above:
• Today’s valuation of BP is as cheap as it has been over the last five years. This includes year-end 2010 where the price of $46.1 was higher than the current price of $40.2.
• P/E metric: It was closest around end 2008 when it fell to 6. At that time, the world economy was seriously at risk of falling into a deep recession (which it did).
• EV/EBIT metric: It was cheaper in 2008. However, that was because the oil prices went close to 150. Currently, we are in the 80-90 range which seems more sustainable.
• It is interesting to note that FCF was –VE in the first half of this year. However, this may be a reflection of the under investment in 2010 rather than a new trend.
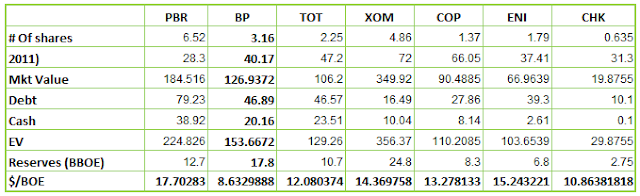
• EV/BOE is a very interesting metric. BP has been the cheapest on this metric that it has ever been. I assume that the reserves are the same as they were at the end of 2010.
Not only is EV/BOE the cheapest it has been for BP over the last 5.5 years, it is also the cheapest compared to most of its other competitors. The reserve information has been drawn from a Petrobras (PBR, Financial) presentation that I recently went through. It is obvious that BP at 8.63 is half that of PBR. The next cheapest is Chesapeake (CHK, Financial) which has a highly natural gas oriented portfolio.
Conclusion
• BP is a very stable and solid business that has been able to consistently earn huge amount of profits even under bad economic conditions.
• On all the key valuation metrics, BP is extremely cheap. It is very interesting to see it trade at less than 6 times earnings.
• BP has re-instated its dividend of 42 cents per quarter or around 4% which allows investor to get paid while they wait for the market to unlock value.
• BP is the cheapest of the big oil companies when you compare the valuation by $/BOE. This is very interesting because BP has a significant liquid portfolio which earns a much higher return.
With the gulf coast open for business and the company available cheaply, it is time to consider a slice of the petroleum pie.
Disclosure: I own BP stock and am looking to add more at the current price.
Disclaimer: All views expressed in this article are the author’s own views. They don’t represent the views of any company or organization that the author may be affiliated with. This is not a recommendation to buy or sell a stock. You need to do your own diligence before buying or selling a stock.
More than a year has now passed and a lot of uncertainty and unknowns have gone away. However, the price of the stock has not moved as dramatically as one would have expected (given how dramatically it moved after the incident). This brings us to today’s value idea.
Earnings
Company operates in two main segments:
• Exploration and Production
• Refining and Marketing
Other business including low carbon footprint are placed under Other Business and Corporate. BP makes it very easy to look at their financials as they provide a s/s. The first stop is to look at the earnings over the last five years.

A few key highlights:
• Exploration & Production is a very profitable business and produces on average $30 billion operating profit annually.
• Refining and Marketing is more volatile business but has been solidly profitable to the tune of $3.75 billion operating profit annually.
• Gulf of Mexico has a big impact on the company and they took a charge to the tune of $41 billion.
• Even after the big charge, company has on average over the last five years provided net profit of $15.75 billion annually. This translates to $4.77/ADS.
The above five years are great representative years for the company because they accounts for the big changes in oil prices as well as one of the worst operational disasters in BP history. So these numbers are likely to be conservative as we look into the future.The next stop is to understand how the company has used the above earnings.
Cash Flow

A few key highlights:
• Cash Flow from Operations has been a very significant $26.5 billion annually. At a very high level this corresponds to 15.5 billion of Net Profit (seen earlier) and approximately $11 billion of Depreciation charges.
• On average, capex is 19 billion annually. This is funded through depreciation charges of $11 billion $; $5 billion $ of disposals (see above and net proceeds from disposals vs. investments), and the remaining from the other operating cash flow.
• BP has been buying around $5 billion $ worth of shares annually and a big portion of that has been funded by taking on additional debt.
• Between share repurchases and dividends, BP has returned $12.75 billion $ of value annually. At today’s market value of $126 billion, that is an annual return of around 10%, which is quite significant. This period includes 2010, when the dividend was cut and the company went through significant crisis.
Overall, cash flow analysis gives us the comfort that a company has been regularly paying the shareholders back. A 10% yield including share buy backs is pretty impressive.
Valuation
Let us look at the valuation in a few different ways:
• P/E
• EV/EBITDA
• P/FCF
• EV/Reserves

A few interesting observations from the above:
• Today’s valuation of BP is as cheap as it has been over the last five years. This includes year-end 2010 where the price of $46.1 was higher than the current price of $40.2.
• P/E metric: It was closest around end 2008 when it fell to 6. At that time, the world economy was seriously at risk of falling into a deep recession (which it did).
• EV/EBIT metric: It was cheaper in 2008. However, that was because the oil prices went close to 150. Currently, we are in the 80-90 range which seems more sustainable.
• It is interesting to note that FCF was –VE in the first half of this year. However, this may be a reflection of the under investment in 2010 rather than a new trend.
• EV/BOE is a very interesting metric. BP has been the cheapest on this metric that it has ever been. I assume that the reserves are the same as they were at the end of 2010.
Not only is EV/BOE the cheapest it has been for BP over the last 5.5 years, it is also the cheapest compared to most of its other competitors. The reserve information has been drawn from a Petrobras (PBR, Financial) presentation that I recently went through. It is obvious that BP at 8.63 is half that of PBR. The next cheapest is Chesapeake (CHK, Financial) which has a highly natural gas oriented portfolio.

Conclusion
• BP is a very stable and solid business that has been able to consistently earn huge amount of profits even under bad economic conditions.
• On all the key valuation metrics, BP is extremely cheap. It is very interesting to see it trade at less than 6 times earnings.
• BP has re-instated its dividend of 42 cents per quarter or around 4% which allows investor to get paid while they wait for the market to unlock value.
• BP is the cheapest of the big oil companies when you compare the valuation by $/BOE. This is very interesting because BP has a significant liquid portfolio which earns a much higher return.
With the gulf coast open for business and the company available cheaply, it is time to consider a slice of the petroleum pie.
Disclosure: I own BP stock and am looking to add more at the current price.
Disclaimer: All views expressed in this article are the author’s own views. They don’t represent the views of any company or organization that the author may be affiliated with. This is not a recommendation to buy or sell a stock. You need to do your own diligence before buying or selling a stock.