
Below is a hedging update as of Friday's close. Before that, a quick housekeeping note. A few readers have asked in the comments of previous posts when we're adding the optimal collar capability to Portfolio Armor. The short answer is that we plan to add that and optimal calls to hedge short positions later this quarter, but if you'd like more details on what we've got planned, see this post, which also includes a coupon code for the site.
Hedging Update
The VIX S&P 500 Volatility Index fell fractionaliy Friday, closing at 36.30. That makes more than two months of closes above 30. Not surprisingly, since then, equities and equity ETFs have been expensive to hedge. Treasury ETFs are still relatively inexpensive to hedge though, again, unsurprising, given the run Treasuries have had.
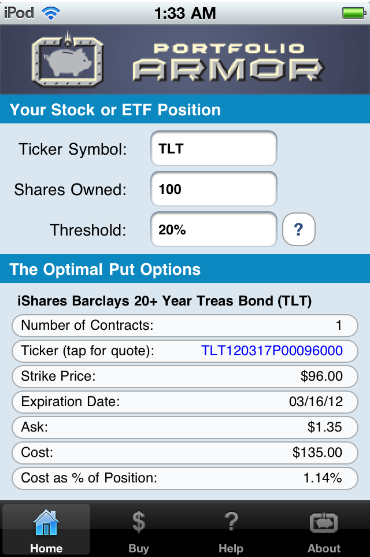
The table below shows the costs, as of Friday's close, of hedging a basket of stocks and ETFs against greater-than-20% declines over the next several months, using optimal puts. First, a reminder about what optimal puts are, and why I've used 20% as a decline threshold; then, a screen capture showing the current optimal puts to hedge one of the Treasury ETFs listed below, iShares Barclays 20yr+ T-Bond (TLT).
About Optimal Puts
Optimal puts are the ones that will give you the level of protection you want at the lowest possible cost. Portfolio Armor (available on the web and as an Apple iOS app), uses an algorithm developed by a finance Ph.D to sort through and analyze all of the available puts for your stocks and ETFs, scanning for the optimal ones.
Decline Thresholds
In this context, "threshold" refers to the maximum decline you are willing to risk in the value of your position in a security. You can enter any percentage you like for a decline threshold when scanning for optimal puts (the higher the percentage though, the greater the chance you will find optimal puts for your position). I have used 20% thresholds for each of the securities below. Essentially, 20% is a large enough threshold that it reduces the cost of hedging, but not so large that it precludes a recovery.
The Optimal Puts for TLT
Below is a screen shot showing the optimal put option contracts to buy to hedge 100 shares of IEF against a greater-than-20% drop between now and March, 16, 2012.
One note about the cost of these optimal puts: to be conservative, Portfolio Armor calculated the cost based on their ask price. In practice, an investor can often purchase puts for a lower price, i.e., some price between the bid and the ask.
Why There Were No Optimal Puts for BAC
In some cases, the cost of protection may be greater than the loss you are looking to hedge against. That was the case with Bank of America (BAC, Financial). On Friday, the cost of protecting against a greater-than-20% decline in BAC shares over the next several months was itself greater than 20%. Because of that, Portfolio Armor indicated that no optimal contracts were found for it.
Hedging costs as of Friday's close
*Based on optimal puts expiring in March, 2012
**Based on optimal puts expiring in April, 2012
Hedging Update
The VIX S&P 500 Volatility Index fell fractionaliy Friday, closing at 36.30. That makes more than two months of closes above 30. Not surprisingly, since then, equities and equity ETFs have been expensive to hedge. Treasury ETFs are still relatively inexpensive to hedge though, again, unsurprising, given the run Treasuries have had.
The table below shows the costs, as of Friday's close, of hedging a basket of stocks and ETFs against greater-than-20% declines over the next several months, using optimal puts. First, a reminder about what optimal puts are, and why I've used 20% as a decline threshold; then, a screen capture showing the current optimal puts to hedge one of the Treasury ETFs listed below, iShares Barclays 20yr+ T-Bond (TLT).
About Optimal Puts
Optimal puts are the ones that will give you the level of protection you want at the lowest possible cost. Portfolio Armor (available on the web and as an Apple iOS app), uses an algorithm developed by a finance Ph.D to sort through and analyze all of the available puts for your stocks and ETFs, scanning for the optimal ones.
Decline Thresholds
In this context, "threshold" refers to the maximum decline you are willing to risk in the value of your position in a security. You can enter any percentage you like for a decline threshold when scanning for optimal puts (the higher the percentage though, the greater the chance you will find optimal puts for your position). I have used 20% thresholds for each of the securities below. Essentially, 20% is a large enough threshold that it reduces the cost of hedging, but not so large that it precludes a recovery.
The Optimal Puts for TLT
Below is a screen shot showing the optimal put option contracts to buy to hedge 100 shares of IEF against a greater-than-20% drop between now and March, 16, 2012.
One note about the cost of these optimal puts: to be conservative, Portfolio Armor calculated the cost based on their ask price. In practice, an investor can often purchase puts for a lower price, i.e., some price between the bid and the ask.
Why There Were No Optimal Puts for BAC
In some cases, the cost of protection may be greater than the loss you are looking to hedge against. That was the case with Bank of America (BAC, Financial). On Friday, the cost of protecting against a greater-than-20% decline in BAC shares over the next several months was itself greater than 20%. Because of that, Portfolio Armor indicated that no optimal contracts were found for it.
Hedging costs as of Friday's close
| Symbol | Name | Cost of Protection (as % of Position value) |
| Widely-Traded Stocks | ||
| INTC | Intel | 6.64%** |
| CSCO | Cisco Systems | 6.96%** |
| MSFT | Microsoft | 5.33%** |
| AAPL | Apple, Inc. | 7.00%** |
| BAC | Bank of America | No Optimal Contracts |
| F | Ford | 10.4%* |
| GE | GE | 7.48%* |
| PFE | Pfizer | 4.12%* |
| WFC | Wells Fargo | 12.0%** |
| T | AT&T | 3.48%** |
| Major Index ETFs | ||
| QQQ | PowerShares QQQ Trust | 4.09%* |
| SPY | SPDR S&P 500 | 3.66%* |
| DIA | SPDR Dow Jones Industrial Avg | 3.60%* |
| Precious Metals ETFs | ||
| GLD | SPDR Gold Trust | 2.45%* |
| SLV | iShares Silver Trust | 11.8%** |
| SGOL | ETFS Physical Swiss Gold Shrs | 2.71%* |
| SIVR | ETFS Physical Silver Shares | 10.4%* |
| Treasury Bond and Note ETFs | ||
| TLT | iShares Barclays 20yr+ T-Bond | 1.14%* |
| IEF | iShares Lehman 7-10 yr T-Note | 0.48%* |
**Based on optimal puts expiring in April, 2012