Many investors are puzzled by the underperformance of small cap value since May of this year. They ask: "Is it worth being in an asset class that can't do well in bad times?"
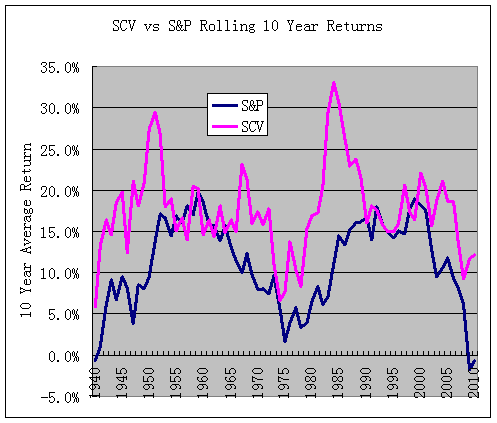
To answer their question, I did a 10-year rolling return comparison between the Fama/French Small Cap Value (SCV) and the S&P 500 index using data from 1931 to 2010. The first 10-year period is 1931 to 1940, the second is 1932 to 1941, and the last is 2001 to 2010. Here is the rolling return chart I got.

Here are the summary statistics:
If you just look at the chart and the statistics, what is there not to like about small cap value? It outperformed the S&P 500 nine out of every ten 10-year periods, usually by a huge margin, and even when it didn't, it didn't by a tiny bit.
But alas, small cap value is not for the faint of heart. In a bear market, it usually falls quicker and harder than large cap.
Think about it, the market is ultimately fair; those investors who can endure more pain in a down market will reap the reward of higher long-term returns.
Michael Zhuang
Personal CFO, Family Wealth Guardian, Investment expert
Serving Doctors and Entrepreneurs
Web:MzCap.com
To answer their question, I did a 10-year rolling return comparison between the Fama/French Small Cap Value (SCV) and the S&P 500 index using data from 1931 to 2010. The first 10-year period is 1931 to 1940, the second is 1932 to 1941, and the last is 2001 to 2010. Here is the rolling return chart I got.

Here are the summary statistics:
| Small Cap Value | S&P 500 | |
| Best 10-year annualized return | 33.1% (1975 - 1984) | 19.7% (1950 - 1959) |
| Worst 10-year annualized return | 5.9% (1931 - 1940) | -1.8% (2000 - 2009) |
| Frequency of outperformance | 63 out of 70 ten-year periods | 7 out of 70 ten-year periods |
If you just look at the chart and the statistics, what is there not to like about small cap value? It outperformed the S&P 500 nine out of every ten 10-year periods, usually by a huge margin, and even when it didn't, it didn't by a tiny bit.
But alas, small cap value is not for the faint of heart. In a bear market, it usually falls quicker and harder than large cap.
Think about it, the market is ultimately fair; those investors who can endure more pain in a down market will reap the reward of higher long-term returns.
Michael Zhuang
Personal CFO, Family Wealth Guardian, Investment expert
Serving Doctors and Entrepreneurs
Web:MzCap.com
