
Illinois Tool Works, Inc. is a decentralized and diverse collection of manufacturing businesses that has been in business for nearly 100 years and has paid consecutively growing dividends for more than four straight decades.
-Revenue Growth: 4.8%
-Earnings Growth: 5.8%
-Dividend Growth: 13% (slowing)
-Current Dividend Yield: 3.01%
-Balance Sheet Strength: Strong
Overall, with a P/E of 12, a strong balance sheet, and good growth and dividend history, I consider ITW to be a reasonable buy at the current price of a bit under $48. However, I do not consider it to have a substantial economic moat, it is rather cyclical, and the dividend growth has slowed considerably over the last few years. I believe it would do well as a cyclical choice in a dividend growth portfolio to get sector diversification. The charts below use the trailing twelve month period as a proxy for “2011”³.
In 2010, revenue came from the following business segments:
Transportation: $2.53 billion
Industrial Packaging: $2.28 billion
Power Systems and Electronics: $1.94 billion
Food Equipment: $1.87 billion
Construction Products: $1.76 billion
Polymers and Fluids: $1.36 billion
Decorative Surfaces: $1.01 billion
All Other: $3.22 billion
Geographically, 48% of revenue comes from North America, 32% comes for Europe, the Middle East, and Africa, and 20% comes from Asia Pacific and Other.
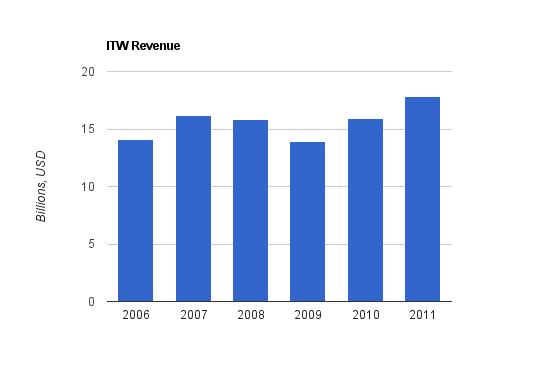
Revenue growth over this period was cyclical, but averaged over 4.8% annually, on average. The 2011 figure is not issued yet, so a proxy of the trailing twelve month period was used in its place.
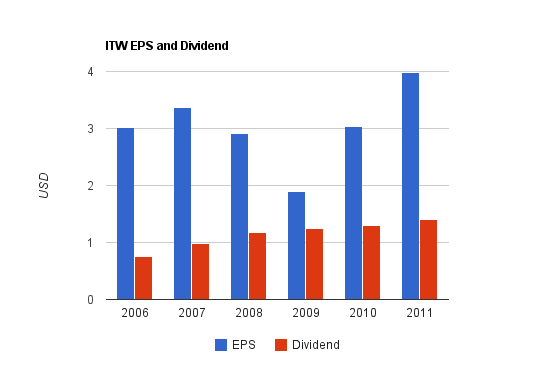
Earnings were highly cyclical, dipping substantial during the recession. Over this period, EPS grew by an annualized rate of 5.8%.
Cash flow growth was negative during this period.
Price to FCF: 13.8
Price to Book: 2.3
Return on Equity: 19%
The dividend grew by 13% annually over this period. Most of the dividend growth was before the recession. Throughout the recession, ITW held its dividend constant at $0.31 per quarter for eight consecutive quarters. However, the calendar spacing of these dividends means that ITW didn’t actually miss a year of dividend growth, even though practically, they basically did. The company increased its quarterly dividend by a bit under 10% in mid-2010, and only increased it by a bit under 6% in mid-2011.
ITW performs significant share repurchases. For example, over the last 12 months, ITW spent slightly more capital on net share repurchases than it did on dividends. A total of 72% of net income, or 85% of operating cash flow, was spent on a combination of dividends and net share repurchases over this period. During peak years, capital spent on net share repurchases can exceed three times the capital spent on dividends. They’re buying the most shares, therefore, when prices are highest. Share repurchases are fine in moderation, but I think it would be better for ITW to pay out an annual special dividend to give back some excess capital to shareholders in the form of more dividends. Let the investors decide whether or not to reinvest their capital at those peak prices.
The advantage of this decentralized acquisition-oriented business model is that risk is spread out and decentralized among numerous industries, brands, and business cultures. In addition, acquisitions, if performed smartly, can provide a regular amount of new revenue and operating income. It can be a consistent growth driver.
The disadvantage of this model is that the company does not harness substantial economies of scale, because it still mainly operates as a collection of small companies. In addition, an acquisition approach limits the rate of return that can be achieved, because acquisitions are generally more expensive than organic growth. Plus, consistent acquisitions cause goodwill to accumulate on the balance sheet.
ITW has been managed well, and over the last 25 years and longer, the company has substantially grown revenue, operating income, EPS, and the dividend, and maintains a robust balance sheet. Over the last ten years, the company has developed substantial international revenue streams. In 2000, 66% of revenue came from North America, 26% came from Europe, the Middle East, and Africa, and 8% came from Asia Pacific and Other. Ten years later, in 2010, those figures respectively were 48%, 32%, and 20%.
The company attributes much of its success to the 80/20 rule. That is, 80% of a company’s total sales are derived from sales to 20% of the total customers. In other words, the products being sold to key customers are what needs to be focused on. ITW’s decentralized business model allows each small business unit to apply this rule rather effectively.
How ITW Spends its Cash
I discussed the dividends, share repurchases, and acquisitions. For further quantitative discussion, here’s a sum of how ITW has spent its operating cash flow over the last five years (2006 through 2010, as a sum). This doesn’t list every area of expense or receipt; just the major ones in order to understand their priorities from a high level:
Operating Cash Flow: $10.481 billion
Spent on Investments in Property, Plant, Equipment: $1.542 billion
Spent on Net Acquisitions: $4.065 billion
Spent on Dividends: $2.756 billion
Spent on Net Share Repurchases: $3.477 billion
(Other sources of cash flow and expenditures of cash flow are smaller, and excluded)
So as can be seen, rather little is spent on capital expenditures, and the bulk of growth comes from making acquisitions. In addition, a significant amount of cash is given back to shareholders in the form of dividends and share repurchases. The dividends per share grow each year. The net share repurchases (meaning share’s repurchased minus shares issued) are more erratic and larger overall, and unfortunately the largest share repurchases occur during business peaks (which is the opposite of ideal). For example, more than $1.6 billion was spent on net share repurchases in 2007, and during 2007 the shares were at an all-time stock price high. Share repurchases over the last 10 years have reduced total shares outstanding from 603 million to 498 million, so it is indeed valuable for shareholders, but not in an optimized way.
Overall, I believe the company manages capital fairly well for shareholders, although there are areas for improvement. The bulk of growth comes from acquisitions, a little bit is spent on capital investment, and the rest is given back to shareholders by paying dividends and reducing the number of shares outstanding.
Full Disclosure: I have no position in ITW at the time of this writing.
-Revenue Growth: 4.8%
-Earnings Growth: 5.8%
-Dividend Growth: 13% (slowing)
-Current Dividend Yield: 3.01%
-Balance Sheet Strength: Strong
Overall, with a P/E of 12, a strong balance sheet, and good growth and dividend history, I consider ITW to be a reasonable buy at the current price of a bit under $48. However, I do not consider it to have a substantial economic moat, it is rather cyclical, and the dividend growth has slowed considerably over the last few years. I believe it would do well as a cyclical choice in a dividend growth portfolio to get sector diversification. The charts below use the trailing twelve month period as a proxy for “2011”³.
Overview
Illinois Tool Works, Inc. (NYSE: ITW), was founded nearly 100 years ago, has over 60,000 employees, thousands of patents, and operates as a decentralized and diverse collection of manufacturing and industrial businesses. The company’s focus is on intelligent acquisitions, where it can add to its collection of businesses that each operate as fairly small, streamlined businesses but share the corporate structure of ITW and therefore have risk protection.In 2010, revenue came from the following business segments:
Transportation: $2.53 billion
Industrial Packaging: $2.28 billion
Power Systems and Electronics: $1.94 billion
Food Equipment: $1.87 billion
Construction Products: $1.76 billion
Polymers and Fluids: $1.36 billion
Decorative Surfaces: $1.01 billion
All Other: $3.22 billion
Geographically, 48% of revenue comes from North America, 32% comes for Europe, the Middle East, and Africa, and 20% comes from Asia Pacific and Other.
Revenue, Earnings, Cash Flow, and Metrics
ITW is rather cyclical, but has grown solidly over the decades. It was deeply impacted by, but remained profitable during, and has rebounded from, this large recession and financial crisis.Revenue Growth
| Year | Revenue |
|---|---|
| TTM | $17.84 billion |
| 2010 | $15.87 billion |
| 2009 | $13.88 billion |
| 2008 | $15.87 billion |
| 2007 | $16.17 billion |
| 2006 | $14.06 billion |
Earnings Growth
| Year | EPS |
|---|---|
| TTM | $3.99 |
| 2010 | $3.03 |
| 2009 | $1.89 |
| 2008 | $2.91 |
| 2007 | $3.36 |
| 2006 | $3.01 |
Operating Cash Flow Growth
| Year | Cash Flow |
|---|---|
| TTM | $1.67 billion |
| 2010 | $1.56 billion |
| 2009 | $2.15 billion |
| 2008 | $2.22 billion |
| 2007 | $2.48 billion |
| 2006 | $2.07 billion |
Metrics
Price to Earnings: 12.1Price to FCF: 13.8
Price to Book: 2.3
Return on Equity: 19%
Dividends
ITW has increased its dividend every year for more than four decades. The current dividend yield is approximately 3%, and the payout ratio is rather low, at around 35%. A rather cyclical company needs to keep its payout ratio on the lower end if it expects to increase the dividend through recessions. Additional capital in good years can be sent to shareholders through either a special dividend or share repurchases, and ITW chooses the latter.Dividend Growth
| Year | Dividend |
|---|---|
| 2011 | $1.40 |
| 2010 | $1.30 |
| 2009 | $1.24 |
| 2008 | $1.18 |
| 2007 | $0.98 |
| 2006 | $0.75 |
ITW performs significant share repurchases. For example, over the last 12 months, ITW spent slightly more capital on net share repurchases than it did on dividends. A total of 72% of net income, or 85% of operating cash flow, was spent on a combination of dividends and net share repurchases over this period. During peak years, capital spent on net share repurchases can exceed three times the capital spent on dividends. They’re buying the most shares, therefore, when prices are highest. Share repurchases are fine in moderation, but I think it would be better for ITW to pay out an annual special dividend to give back some excess capital to shareholders in the form of more dividends. Let the investors decide whether or not to reinvest their capital at those peak prices.
Balance Sheet
Total debt/equity is under 0.5, which is rather strong. The total debt is equal to 2.2x current net income. The interest coverage ratio is nearly 15, which again, is quite strong. Despite being a company that makes significant acquisitions, goodwill only accounts for approximately 50% of shareholder equity. I’d rate ITW’s balance sheet as surprisingly strong.Investing Thesis
ITW has a business model that is unusual for most companies of a similar size ($23 billion market cap), but not uncommon among large manufacturers. The company is highly decentralized and most growth is due to acquisitions. The company operates as basically a common pool of smaller companies.The advantage of this decentralized acquisition-oriented business model is that risk is spread out and decentralized among numerous industries, brands, and business cultures. In addition, acquisitions, if performed smartly, can provide a regular amount of new revenue and operating income. It can be a consistent growth driver.
The disadvantage of this model is that the company does not harness substantial economies of scale, because it still mainly operates as a collection of small companies. In addition, an acquisition approach limits the rate of return that can be achieved, because acquisitions are generally more expensive than organic growth. Plus, consistent acquisitions cause goodwill to accumulate on the balance sheet.
ITW has been managed well, and over the last 25 years and longer, the company has substantially grown revenue, operating income, EPS, and the dividend, and maintains a robust balance sheet. Over the last ten years, the company has developed substantial international revenue streams. In 2000, 66% of revenue came from North America, 26% came from Europe, the Middle East, and Africa, and 8% came from Asia Pacific and Other. Ten years later, in 2010, those figures respectively were 48%, 32%, and 20%.
The company attributes much of its success to the 80/20 rule. That is, 80% of a company’s total sales are derived from sales to 20% of the total customers. In other words, the products being sold to key customers are what needs to be focused on. ITW’s decentralized business model allows each small business unit to apply this rule rather effectively.
How ITW Spends its Cash
I discussed the dividends, share repurchases, and acquisitions. For further quantitative discussion, here’s a sum of how ITW has spent its operating cash flow over the last five years (2006 through 2010, as a sum). This doesn’t list every area of expense or receipt; just the major ones in order to understand their priorities from a high level:
Operating Cash Flow: $10.481 billion
Spent on Investments in Property, Plant, Equipment: $1.542 billion
Spent on Net Acquisitions: $4.065 billion
Spent on Dividends: $2.756 billion
Spent on Net Share Repurchases: $3.477 billion
(Other sources of cash flow and expenditures of cash flow are smaller, and excluded)
So as can be seen, rather little is spent on capital expenditures, and the bulk of growth comes from making acquisitions. In addition, a significant amount of cash is given back to shareholders in the form of dividends and share repurchases. The dividends per share grow each year. The net share repurchases (meaning share’s repurchased minus shares issued) are more erratic and larger overall, and unfortunately the largest share repurchases occur during business peaks (which is the opposite of ideal). For example, more than $1.6 billion was spent on net share repurchases in 2007, and during 2007 the shares were at an all-time stock price high. Share repurchases over the last 10 years have reduced total shares outstanding from 603 million to 498 million, so it is indeed valuable for shareholders, but not in an optimized way.
Overall, I believe the company manages capital fairly well for shareholders, although there are areas for improvement. The bulk of growth comes from acquisitions, a little bit is spent on capital investment, and the rest is given back to shareholders by paying dividends and reducing the number of shares outstanding.
Risks
As the EPS table shows over the last six years, ITW is rather cyclical. It’s not a particularly defensive set of businesses; they’ve got exposure to cars, housing, manufacturing, etc. The company did manage to stay profitable throughout the worst recession in recent US history, albeit at a significant earnings reduction. There is global economic risk, from the US, from Europe, and elsewhere. The company faces currency risk as well due to its global exposure. ITW can benefit disproportionally from a continued recovery, but can also be hit hard by continued economic weakness.Conclusion and Valuation
In conclusion, with an earnings multiple of 12 (which can vary substantially due to the cyclical nature of the business), reasonably shareholder-friendly management, and a strong balance sheet, I’d feel comfortable owning ITW at these prices. The decentralized business model with pooled capital and reliance on acquisitions reduces systemic corporate risk but makes it hard to establish any kind of economic advantage, or moat. So there’s nothing in particular that really solidifies and protects their position over the very long term, although their history is indeed impressive. The company has had strong and robust growth over decades, and remained profitable through the worst recession in recent history. I do think it’s a decent buy for those investors who are interested, and I would consider this to be a solid candidate for a cyclical company in an otherwise large-moat dividend portfolio. I’d stick to buying ITW stock at valuations that offer a dividend yield of 3% or above.Full Disclosure: I have no position in ITW at the time of this writing.