As of last week, the combination of evidence we observe continues to be associated with strong recession risk and the likelihood of a "whipsaw trap" in the stock market. We'll respond to new data as it changes, but I expect that the primary window of interest here is about 6-8 weeks. In the event that economic data can produce fairly upbeat readings over that horizon, and the S&P 500 can remain at or about present levels, our estimate of oncoming recession risk would back off fairly quickly. Presently, that outcome would be outside of the norm based on the leading economic measures we track, as well as the overvalued, overbought, overbullish condition of the stock market.
I want to emphasize again that I am neither a cheerleader for recession, nor a table-pounder for recession. It's just that given the data that we presently observe, an oncoming recession remains the most probable outcome. When unseen states of the world have to be inferred from imperfect and noisy observable data, there are a few choices when the evidence isn't 100%. You can either choose a side and pound the table, or you can become comfortable dwelling in uncertainty, and take a position in proportion to the evidence, and the extent to which each possible outcome would affect you.
....
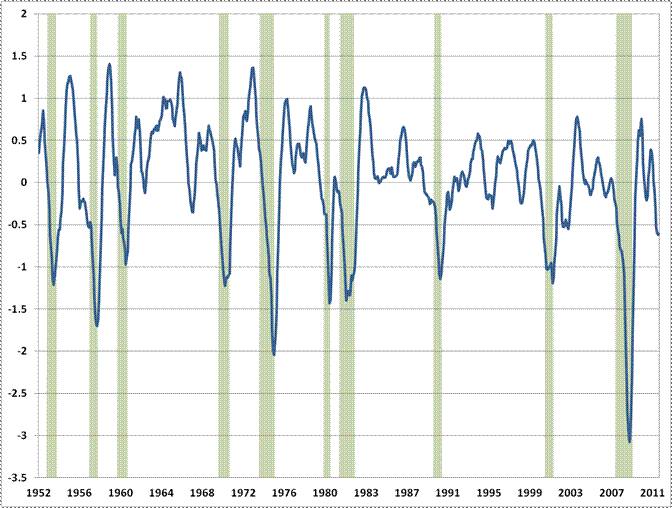
Recession evidence is best measured by capturing a syndrome of conditions that reflects broad deterioration in both real activity and financial indicators. What's perplexing to me is that the recession concerns we're seeing are evident even in composites of very widely tracked economically-sensitive indicators. For example, the chart below is simply the average of standardized values (mean zero, unit variance) of the following variables: 6 month change in S&P 500, 6 month change in nonfarm payrolls, 12 month change in nonfarm payrolls, 6 month change in average weekly hours worked, ISM Purchasing Managers Index, ISM New Orders Index, OECD Leading Indicator - total world, OECD Leading Indicator - US, ECRI Weekly Leading Index growth, Chicago Fed National Activity Index - 3 month average, credit spreads (Baa vs 10-year Treasury), Industrial commodity prices - 12 month and 6 month change, and New building permits 6 month change.
The current average is at levels that have always and only been associated with recession (and at about the same level where most recessions have started), though there was a brief dip nearly approaching these levels in 2002, just after the 2000-2001 recession.

While we prefer to construct discriminator variables (similar to our Recession Warning Composite , which helps to capture interactions and minimize "outlier" effects), we should be reluctant to casually dismiss the downturn we observe in a whole range of economic measures here.
Read the complete commentary.
I want to emphasize again that I am neither a cheerleader for recession, nor a table-pounder for recession. It's just that given the data that we presently observe, an oncoming recession remains the most probable outcome. When unseen states of the world have to be inferred from imperfect and noisy observable data, there are a few choices when the evidence isn't 100%. You can either choose a side and pound the table, or you can become comfortable dwelling in uncertainty, and take a position in proportion to the evidence, and the extent to which each possible outcome would affect you.
....
Recession evidence is best measured by capturing a syndrome of conditions that reflects broad deterioration in both real activity and financial indicators. What's perplexing to me is that the recession concerns we're seeing are evident even in composites of very widely tracked economically-sensitive indicators. For example, the chart below is simply the average of standardized values (mean zero, unit variance) of the following variables: 6 month change in S&P 500, 6 month change in nonfarm payrolls, 12 month change in nonfarm payrolls, 6 month change in average weekly hours worked, ISM Purchasing Managers Index, ISM New Orders Index, OECD Leading Indicator - total world, OECD Leading Indicator - US, ECRI Weekly Leading Index growth, Chicago Fed National Activity Index - 3 month average, credit spreads (Baa vs 10-year Treasury), Industrial commodity prices - 12 month and 6 month change, and New building permits 6 month change.
The current average is at levels that have always and only been associated with recession (and at about the same level where most recessions have started), though there was a brief dip nearly approaching these levels in 2002, just after the 2000-2001 recession.

While we prefer to construct discriminator variables (similar to our Recession Warning Composite , which helps to capture interactions and minimize "outlier" effects), we should be reluctant to casually dismiss the downturn we observe in a whole range of economic measures here.
Read the complete commentary.