

The Russia-Ukraine crisis is heating up as Russia claims to have captured the first major city, Kherson. Simulataneously, Russian President Vladmir Putin has put nuclear weapons on alert. Thus, investors may be wondering why we've not seen a catastrophic crash of the stock market.
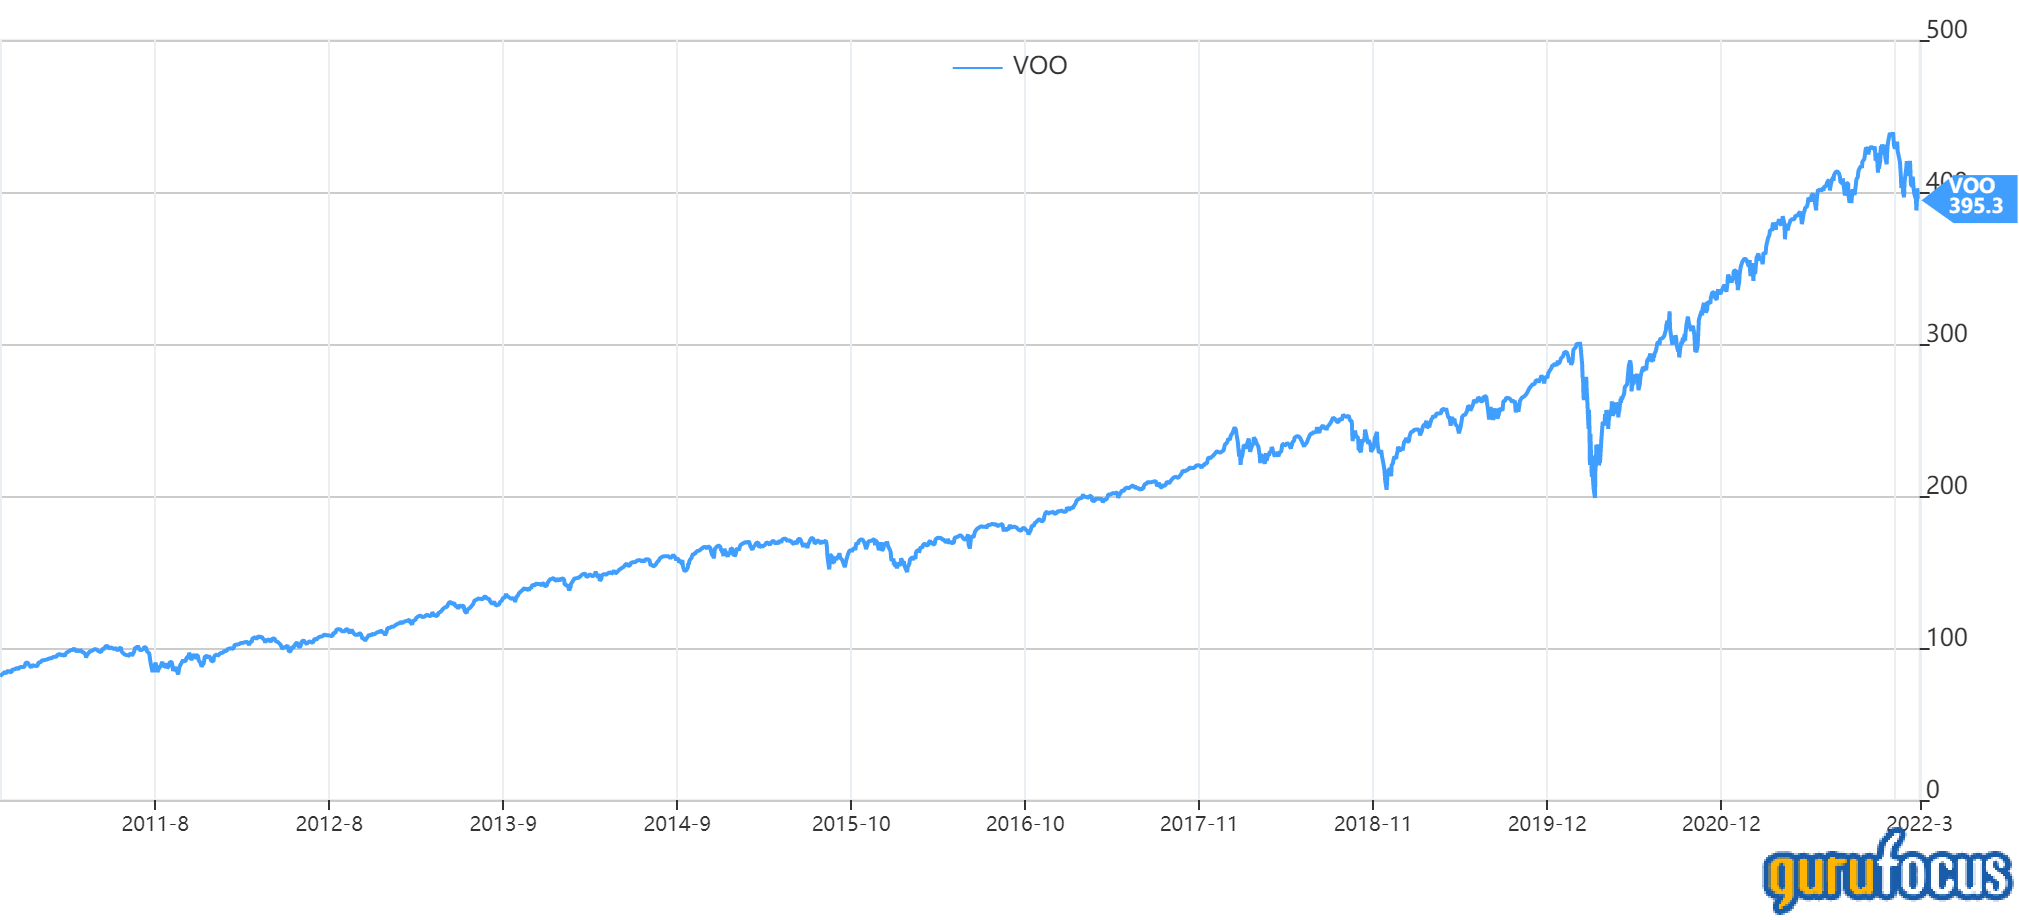
Yes, the MOEX Russia Index has sunk 40% and the central bank has decided to close the Russian market for a few days due to the volatility. However, the S&P 500 only decreased by 5% and has now bounced back, leaving the market down just 2.17%. The price of West Texas Intermediate (WTI) crude oil is up 6% over the past five days and is approaching $100 per barrel.
In this article, I am going to dive into the historical relationship between stock prices and wars, and why equity markets may appear to move "irrationally" even during times of conflict.
Historic stock performance during times of war
The table below shows the S&P 500's performance around periods of certain geopolitical and military events. The average S&P 500 performance after war-charged events has been surprisingly positive; one month up 1.3%, then three months later up 2.1%, six months later up 5.5% and 12 months later up 8.6% on average.
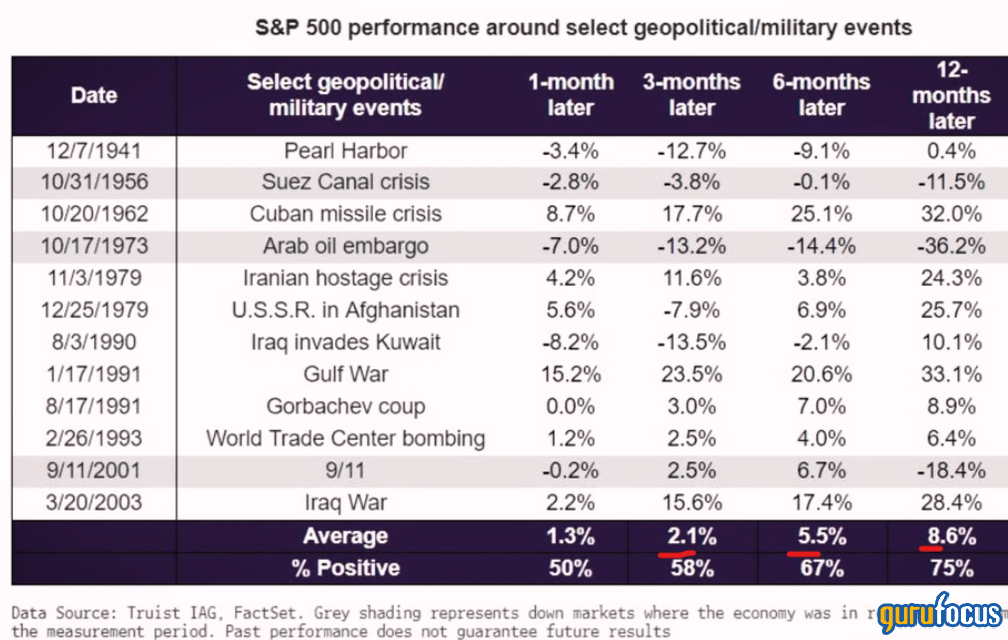
Source: Truist IAG, FactSet
After the Pearl Harbor attacks in 1941, which signaled the U.S.'s entry into World War II, we can see some interesting data. Just one month later, the S&P 500 was only down 3.4%, then after it decreased further for a total decline of 12.7%. But by the following year, it was back to the same levels. Perhaps this was driven by wartime spending, stimulus and booming manufacturing to meet military demand. It's important to note that almost none of this war was fought on U.S. soil.
One of the worst crashes was the Arab Oil Embargo, which caused a 7% one-month decline, and by the end of the year the stock market was down a catastrophic 36%. However, that situation was different to the current European energy crisis due to sanctions on Russian energy, because although both involve oil, Europe doesn't "need" Russian oil and gas the same way it used to. Yes, a reduction in supply will cause ripple effects around the world, but the extent is not as great, as the gap between essential energy demand and luxury energy demand has widened dramatically. Moreover, the U.S. is now the largest supplier of oil to Europe and has even been supplying liquefied natural gas (LNG) to Europe.
So when will we get the war-related crash?
The historic data which tracks the S&P 500 Index fund around military events shows a positive increase one year later. Thus, based on this alone, the logical conclusion would be to not panic sell.
However, diving beneath the surface-level data, a review of the historic S&P 500 shows an 80% stock market crash in 1929 (the Great Depression). Thus, by the time World War 2 started (1939) and even Pearl Harbor (1941), the stock market was already at a low valuation, which may explain why the net returns over the period were close to 0%. This was called the "Lost Decade," but really it was a lost 20 years, up until 1951, when the stock market boomed again.
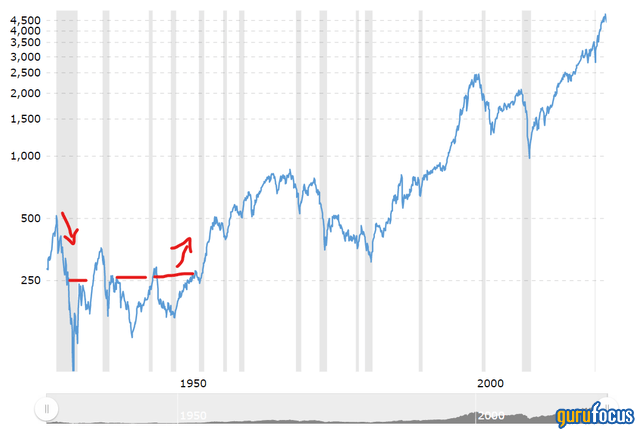
From the trend of the S&P 500 between 1900 and 1950, it appears that during times of global conflict, while the stock market as a whole may not have any particularly notable downwards slides directly attributable to news headlines of conflict, there is high volatility, and trying to time the market would be even more impossible than usual.
One popular strategy during this time was to "buy at the point of maximum pessimism." In 1939, famous contrarian investor Sir John Templeton once bought 100 shares each in 104 companies that were selling at $1 per share or less. Including 34 that were in bankruptcy, only four turned out to actually go to zero. His $10,000 bet (equivalent to $200,000 in today's money) gained four times by the end of the war to $40,000 ($800,000 in today's money).
Now, although executing an "invest when there is blood on the streets" strategy seems like it gets great returns, it also requires nerves of steel and the optionality of not requiring access to the funds for at least 10 to 20 years just to be safe.
Either way, from historical data, I expect the stock market to recover, even if it may move sideways for a while. However, due to expected volatility, I will be building a 20%+ cash position ready to deploy into new opportunities, should there be a major crash.