
History has revealed that the best-performing stocks during the previous decades have been those that shelled out ever-increasing cash to shareholders in the form of dividends. Unfortunately for the individual investor, most dividend analysis that we've seen out there is backward-looking — meaning it rests on what the company has done in the past: how long it has raised its dividend, etc. We’re looking to change this view.
Although analyzing historical trends is important, we think assessing what may happen in the future is even more important. That is why we created a forward-looking assessment of dividend safety through our innovative, predictive dividend-cut indicator, the Valuentum Dividend Cushion™. We use our future forecasts for free cash flow and expected dividends and consider the company's net cash position to make sure that each company is able to pay out such dividend obligations to you — long into the future. In this article, let's evaluate the investment merits of Williams Co (WMB, Financial), as well as its dividend. We expect double-digit dividend growth in its dividend for some time to come.
Our full report on Williams Co. and hundreds of other companies can be found here.
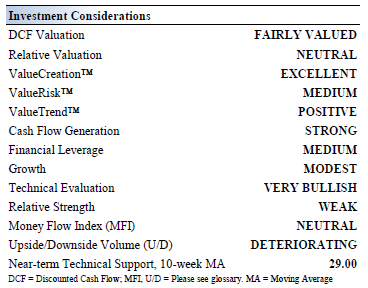
Investment Considerations
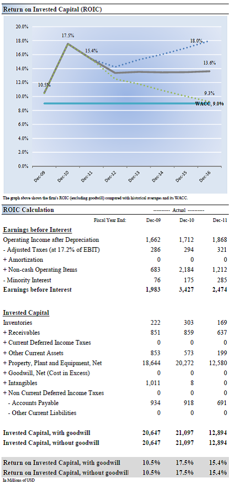
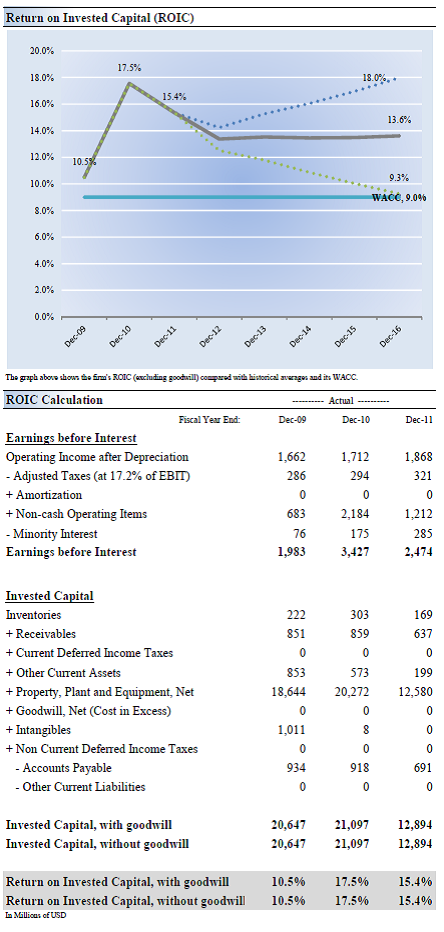
Return on Invested Capital
Williams Co.’s Dividend

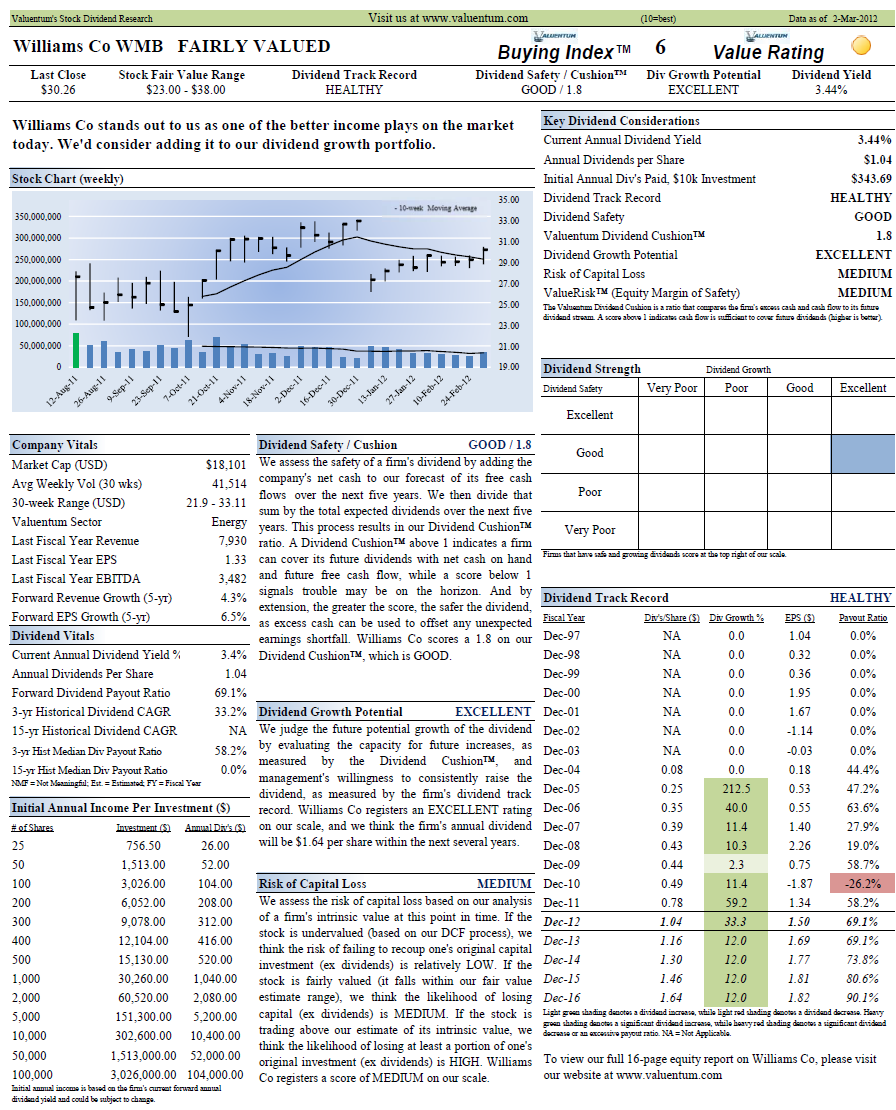
Williams Co.'s dividend yield is above average, offering a 3.44% annual payout at recent price levels — for inclusion in our dividend portfolio we look for yields above 3%.
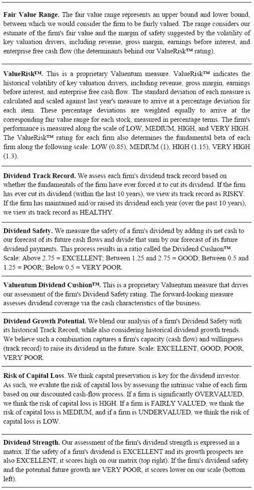
We think the safety of Williams Co.'s dividend is good (please see our definitions at the bottom of this article). We measure the safety of the dividend in a unique but very straightforward fashion. As many know, earnings can fluctuate in any given year, so using the payout ratio in any given year has some limitations. Plus, companies can often encounter unforeseen charges (read hiccups in operations), which makes earnings an even less-than-predictable measure of the safety of the dividend in any given year. We know that companies won't cut the dividend just because earnings have declined or they had a restructuring charge that put them in the red for the quarter (year). As such, we think that assessing the cash flows of a business allows us to determine whether it has the capacity to continue paying these cash outlays well into the future.
That has led us to develop the forward-looking Valuentum Dividend Cushion™. The measure is a ratio that sums the existing cash a company has on hand plus its expected future free cash flows over the next five years and divides that sum by future expected dividends over the same time period. For oil and gas pipeline firms, we make a few slight adjustments due to their business structures, but the concept is the same. Basically, if the score is above 1, the company has the capacity to pay out its expected future dividends. As income investors, however, we'd like to see a score much larger than 1 for a couple reasons: 1) the higher the ratio, the more "cushion" the company has against unexpected earnings shortfalls, and 2) the higher the ratio, the greater capacity a dividend-payer has in boosting the dividend in the future.
For Williams Co., this score is 1.8, offering both a "cushion" and revealing some excess capacity for future dividend growth. The beauty of the Dividend Cushion is that it can be compared apples-to-apples across companies. For example, Wal-Mart (WMT) scores a 1.4 on this measure. Also, for firms that have a score below 1 or that have a negative score, the risk of a dividend cut in the future is certainly elevated. In fact, the Valuentum Dividend Cushion caught all dividend cuts in our non-financial coverage universe, except for one, which subsequently raised its dividend above pre-cut levels (meaning it shouldn't have cut it in the first place). We use our dividend cushion as a key decision component in choosing companies for addition to the portfolio of our Dividend Growth Newsletter.
Now on to the potential growth of Williams Co.'s dividend. As we mentioned above, we think the larger the "cushion" the larger capacity it has to raise the dividend. However, such dividend growth analysis is not complete until after considering management's willingness to increase the dividend. As such, we evaluate the company's historical dividend track record. If there have been no dividend cuts in 10 years, the company has a nice growth rate, and a nice dividend cushion, its future potential dividend growth would be excellent, which is the case for Williams Co.
However, we don't just stop there. By employing a matrix (in the image above), one can see above that Williams Co. has a very solid dividend — the cross section of its good safety and excellent future potential growth scores. And because capital preservation is also an important consideration, we assess the risk associated with the potential for capital loss (offering investors a complete picture). In Williams Co.'s case, we think the shares are fairly valued, so the risk of capital loss is medium. If we thought the shares were undervalued we’d rate the risk of capital loss as low.
All things considered, Williams Co. stands out to us as one of the better income plays on the market today. We’d consider adding it to our dividend growth portfolio. The glossary below shows how we rate a company's dividend in each key area:
Although analyzing historical trends is important, we think assessing what may happen in the future is even more important. That is why we created a forward-looking assessment of dividend safety through our innovative, predictive dividend-cut indicator, the Valuentum Dividend Cushion™. We use our future forecasts for free cash flow and expected dividends and consider the company's net cash position to make sure that each company is able to pay out such dividend obligations to you — long into the future. In this article, let's evaluate the investment merits of Williams Co (WMB, Financial), as well as its dividend. We expect double-digit dividend growth in its dividend for some time to come.
Our full report on Williams Co. and hundreds of other companies can be found here.
Investment Considerations
Return on Invested Capital
Williams Co.’s Dividend
Williams Co.'s dividend yield is above average, offering a 3.44% annual payout at recent price levels — for inclusion in our dividend portfolio we look for yields above 3%.
We think the safety of Williams Co.'s dividend is good (please see our definitions at the bottom of this article). We measure the safety of the dividend in a unique but very straightforward fashion. As many know, earnings can fluctuate in any given year, so using the payout ratio in any given year has some limitations. Plus, companies can often encounter unforeseen charges (read hiccups in operations), which makes earnings an even less-than-predictable measure of the safety of the dividend in any given year. We know that companies won't cut the dividend just because earnings have declined or they had a restructuring charge that put them in the red for the quarter (year). As such, we think that assessing the cash flows of a business allows us to determine whether it has the capacity to continue paying these cash outlays well into the future.
That has led us to develop the forward-looking Valuentum Dividend Cushion™. The measure is a ratio that sums the existing cash a company has on hand plus its expected future free cash flows over the next five years and divides that sum by future expected dividends over the same time period. For oil and gas pipeline firms, we make a few slight adjustments due to their business structures, but the concept is the same. Basically, if the score is above 1, the company has the capacity to pay out its expected future dividends. As income investors, however, we'd like to see a score much larger than 1 for a couple reasons: 1) the higher the ratio, the more "cushion" the company has against unexpected earnings shortfalls, and 2) the higher the ratio, the greater capacity a dividend-payer has in boosting the dividend in the future.
For Williams Co., this score is 1.8, offering both a "cushion" and revealing some excess capacity for future dividend growth. The beauty of the Dividend Cushion is that it can be compared apples-to-apples across companies. For example, Wal-Mart (WMT) scores a 1.4 on this measure. Also, for firms that have a score below 1 or that have a negative score, the risk of a dividend cut in the future is certainly elevated. In fact, the Valuentum Dividend Cushion caught all dividend cuts in our non-financial coverage universe, except for one, which subsequently raised its dividend above pre-cut levels (meaning it shouldn't have cut it in the first place). We use our dividend cushion as a key decision component in choosing companies for addition to the portfolio of our Dividend Growth Newsletter.
Now on to the potential growth of Williams Co.'s dividend. As we mentioned above, we think the larger the "cushion" the larger capacity it has to raise the dividend. However, such dividend growth analysis is not complete until after considering management's willingness to increase the dividend. As such, we evaluate the company's historical dividend track record. If there have been no dividend cuts in 10 years, the company has a nice growth rate, and a nice dividend cushion, its future potential dividend growth would be excellent, which is the case for Williams Co.
However, we don't just stop there. By employing a matrix (in the image above), one can see above that Williams Co. has a very solid dividend — the cross section of its good safety and excellent future potential growth scores. And because capital preservation is also an important consideration, we assess the risk associated with the potential for capital loss (offering investors a complete picture). In Williams Co.'s case, we think the shares are fairly valued, so the risk of capital loss is medium. If we thought the shares were undervalued we’d rate the risk of capital loss as low.
All things considered, Williams Co. stands out to us as one of the better income plays on the market today. We’d consider adding it to our dividend growth portfolio. The glossary below shows how we rate a company's dividend in each key area: