
History: Jos. A Bank Clothiers Inc. (JOSB, Financial)’s roots go back to the late 1800s, when a Lithuanian immigrant, Charles Bank, opened a small tailor shop in Baltimore. By the turn of the 19th century, the company had moved into manufacturing and wholesaling pants after Charles’ grandson, Joseph, joined the company. Joseph later expanded the company by marrying the daughter of a competing firm’s family, combining both operations, and manufacturing and selling suits on the east coast. After initially selling to other retailers, the company began its own retail operations and was subsequently purchased by the Quaker Oats Company in 1981. Four short years later, after doubling the number of stores to over 20, Quaker Oats spun off JOSB. In 1994 the company went public under the ticker “JOSB,” and in 1998 it sold its manufacturing division, and outsourced all manufacturing to focus on retail. Today, the company has 556 retail stores.
Operations
Jos. A. Bank Clothiers Inc. (JOSB) is a designer and retailer of its own brand of men’s tailored and casual clothing, along with its recent expansion in to the suit rental business. The company targets male professionals with classic style clothing and accessories; its stores and web page (www.josbank.com) sell tuxedos, suits, shirts, vests, ties, coats, pants, sportswear, golf wear, belts, socks, underwear and shoes. All items except for shoes (which account for 3% of sales) are branded as Jos. A. Bank. In fiscal year (FY) 2011 suits accounted for roughly 30% of JOSB’s overall sales and 25% of online sales. The company has categorized its products into three pricing tiers; the Executive collection, the Signature collection, and the Gold collection, from lowest to highest priced, respectively.
This business model provides the company with quite a bit of stability, because the focus on simple and classic styles eliminates the risks and costs associated with constantly having to design new products to be “in fashion.” A perfect example of this took place in 2011, where due to unusual warm weather conditions, the company’s cold weather line did not sell well causing these items to remain in inventory. However, because the company does not expect its style offerings to change much in the near future, it does not have to liquidate these items and can sell them at full price next year. Even with this fashion stability, about 35% of the company’s sales and 50% of net income occur in the fourth quarter of each year due to the increased holiday spending and high promotional activity by the company during this period.
The company generates revenues through two divisions; its 556 retail stores (516 company operated full-line stores, 25 Outlet and Factory Stores and 15 franchised stores) and direct marketing efforts (internet and call center catalog). The company has recently expanded its online offerings by adding big and tall sizes, as well as international shipping to better serve customers that need products and suits while they are abroad. The physical stores average about 4,600 sq. ft. with about 80% dedicated to sales activities, and the other 20% dedicated to storage and on-site tailoring. The breakdown of sales for fiscal year 2011 is presented in the diagram below, with the majority of direct marketing sales (undisclosed) coming from the internet:

The Finances
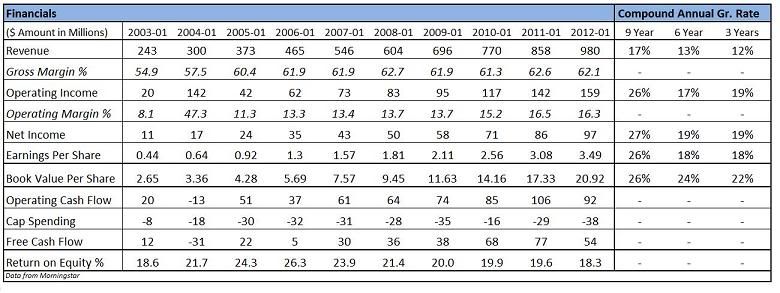
The table above is a summary of the company’s financials since 2003. Since that time, the company has grown revenue at a 17% compound annual growth rate (CAGR), 13% for six years, and 12% for three years. Net income and book value have a CAGR of around 25% for the 9 year period, and closer to 20% for the three and six year periods. Per share income growth is 1% lower than net income growth due to dilution from executive compensation. Gross and operating margins have stayed mostly consistent, at greater than 60% and 13%, respectively, for most periods. Return on equity has been close to 20% for all periods — if you factor out the significant amount of cash and cash equivalents the company has had on its balance sheet, return on equity is closer to 30-40% for the last three years. Revenue growth in FY 2011 came from a 7.6% increase in same store sales and the opening of 53 new stores. The company plans on opening 35-40 new stores in fiscal year 2012 (7% of existing stores).
JOSB has grown operating cash flow at a healthy rate as well, with a slight decline in 2011 due to replenishing inventories that had been depleted over the prior years, as well as weak sales for winter clothing as mentioned earlier, that have prevented the company from converting inventory to cash. Also, as the costs of raw materials have gone up, the company has had to spend more on inventory. Additionally, because of the slow-changing product offerings, the company purchased extra inventory in 2011 to deal with rising raw materials costs in the future.
For the majority of the years JOSB has also generated free cash flow at a healthy rate. The company is debt free.
Valuation
A brief summary of the company’s valuation measures as of May 24, 2012 are as follows:

When it comes to valuing JOSB, we can turn to The J. Crew Group (JCG) proxy statement filed on December 29, 2010, outlining the valuation methodology used in its acquisition by private equity firms TPG Capital and Leonard Green & Partners. Although the analysis was done in the latter part of 2010 and the deal was concluded in early 2011, the analysis should still prove valid as many members of the peer group trade at multiples that are similar compared to a year earlier. The purpose here is to identify what a private buyer would pay for a business similar to JOSB.
J. Crew and the other selected peer companies are very similar to JOSB since all of them mostly sell their own branded clothing in their retail stores. The only difference being that some may be more fashion focused than JOSB, and will generate more excitement amongst consumers. In other words, JOSB is considered a more “boring” business. Below is the section from the proxy describing the J. Crew transaction details:

This is followed by the direct peer group comparison:

And, actual specialty apparel transactions dating back to 2005:

Looking at the most recent J. Crew transaction data, and comparing it to current valuations and historical transactions of comparable firms, using an EV/EBITDA multiple of around 8.0x, and a P/E of about 19.0x seems reasonable, especially given JOSB’s strong balance sheet, cash generation abilities, and growth (see financials table above). Under this scenario, with net income of $97 million and EBITDA of $186m, the company’s operations are worth somewhere between $1.5 billion and $1.9 billion. The company also has cash and short term investments in the amount of $327 million (about 25% of market cap), and no debt, putting the total present value of JOSB between $1.83B and $2.23B, versus its current market cap of $1.3 billion. On a per share basis, this equates to a value between $66 and $80, versus a current share price of $47. If the company’s stock is to appreciate to its true value, this would result in a return between 30% and 70%. Even with a 20% margin of safety, JOSB is trading at about a $6 (13%) discount to the lower end of the range, and a $17 (36%) discount from the upper end of the range.
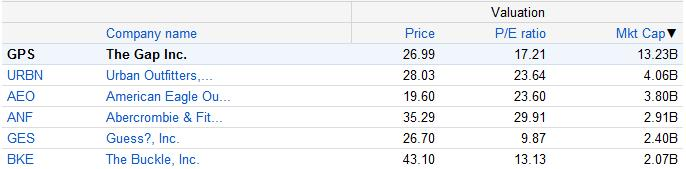
If one wishes to not use this private market valuation, the more conventional P/E metric can be used. Subtracting the $327 million cash from the $1.32 billion market cap, the company’s operations can be bought for about $1 billion at today’s market cap. With earnings of $97 million, this means the company is trading at a P/E of roughly 10x. This is what similar comps are trading for today:
This valuation is compelling because the company is stable; it has a strong history of positive earnings, earnings growth, free cash flow, and its future is somewhat predictable. Additionally, compared to many other firms, JOSB only operates in the United States, therefore its cash and cash equivalents balance is readily available and not subject to repatriation taxes that currently plague many domestic companies holding large amounts of cash overseas.
Potential Risks
Of course, the most important question to answer is where the potential risks and downside for any investment can come from. JOSB, like any other company, is not free of these.
For one, management compensation seems to be weighted very strongly toward the short-term versus the long-term, which provides cause to question if management objectives are aligned with those of shareholders. As an example, 86,000 restricted stock units were granted in fiscal year 2010 with none existing prior to that date, and another 66,000 granted in fiscal year 2011. During fiscal year 2011, 42,000 stock units had already vested. Meaning that up to half of the restricted stock units granted in fiscal year 2010 had already vested by fiscal year 2011. In fact, it was hard to find anything in SEC filings that indicates any type of long-term equity or cash compensation plan. Rather, most of the compensation is based on hitting annual (short-term) net income targets. Combining this with the fact that no executive owns more than 1% of the company raises some potential concerns.
The company also has a rights agreement (poison pill) in place, which allows shareholders the right to buy preferred shares should any party gain an ownership stake in the company of at least 20% (without management’s approval), thereby creating disincentive for a takeover attempt. In the event that management is performing poorly and a large shareholder wants to add influence, or the company becomes an attractive takeover target, the acquirer must negotiate with management first. Given management’s small ownership interest in the company, this may not be best for shareholders.
However, the management’s track record should mitigate some of these concerns. They have done a reasonable job of growing the company steadily (especially through some tough years for retail), with high returns on equity, and a strong balance sheet. However, for a long-term investor, it would be prudent to keep a look-out for whether the management could be sacrificing longer-term objectives to hit their short-term compensation objectives.
Conclusion
JOSB is a solid and stable company with a long history of being financially prudent. In recent years, the company has grown revenues and earnings consistently, and it looks to continue to do the same into the near future. Additionally, it sports a strong balance sheet with a lot of cash and no debt. These factors alone make it a strong consideration for a good investment.
The valuation of the company sweetens the deal even more. JOSB trades at a significant discount to its direct peers, and a significant discount to the transaction value based on what similar firms have been purchased for over the last seven years. Despite certain weaknesses pertaining to management’s long-term incentives, the company’s solid history and predictability of business results in the future should provide a significant return in the following years.
Operations
Jos. A. Bank Clothiers Inc. (JOSB) is a designer and retailer of its own brand of men’s tailored and casual clothing, along with its recent expansion in to the suit rental business. The company targets male professionals with classic style clothing and accessories; its stores and web page (www.josbank.com) sell tuxedos, suits, shirts, vests, ties, coats, pants, sportswear, golf wear, belts, socks, underwear and shoes. All items except for shoes (which account for 3% of sales) are branded as Jos. A. Bank. In fiscal year (FY) 2011 suits accounted for roughly 30% of JOSB’s overall sales and 25% of online sales. The company has categorized its products into three pricing tiers; the Executive collection, the Signature collection, and the Gold collection, from lowest to highest priced, respectively.
This business model provides the company with quite a bit of stability, because the focus on simple and classic styles eliminates the risks and costs associated with constantly having to design new products to be “in fashion.” A perfect example of this took place in 2011, where due to unusual warm weather conditions, the company’s cold weather line did not sell well causing these items to remain in inventory. However, because the company does not expect its style offerings to change much in the near future, it does not have to liquidate these items and can sell them at full price next year. Even with this fashion stability, about 35% of the company’s sales and 50% of net income occur in the fourth quarter of each year due to the increased holiday spending and high promotional activity by the company during this period.
The company generates revenues through two divisions; its 556 retail stores (516 company operated full-line stores, 25 Outlet and Factory Stores and 15 franchised stores) and direct marketing efforts (internet and call center catalog). The company has recently expanded its online offerings by adding big and tall sizes, as well as international shipping to better serve customers that need products and suits while they are abroad. The physical stores average about 4,600 sq. ft. with about 80% dedicated to sales activities, and the other 20% dedicated to storage and on-site tailoring. The breakdown of sales for fiscal year 2011 is presented in the diagram below, with the majority of direct marketing sales (undisclosed) coming from the internet:
The Finances
The table above is a summary of the company’s financials since 2003. Since that time, the company has grown revenue at a 17% compound annual growth rate (CAGR), 13% for six years, and 12% for three years. Net income and book value have a CAGR of around 25% for the 9 year period, and closer to 20% for the three and six year periods. Per share income growth is 1% lower than net income growth due to dilution from executive compensation. Gross and operating margins have stayed mostly consistent, at greater than 60% and 13%, respectively, for most periods. Return on equity has been close to 20% for all periods — if you factor out the significant amount of cash and cash equivalents the company has had on its balance sheet, return on equity is closer to 30-40% for the last three years. Revenue growth in FY 2011 came from a 7.6% increase in same store sales and the opening of 53 new stores. The company plans on opening 35-40 new stores in fiscal year 2012 (7% of existing stores).
JOSB has grown operating cash flow at a healthy rate as well, with a slight decline in 2011 due to replenishing inventories that had been depleted over the prior years, as well as weak sales for winter clothing as mentioned earlier, that have prevented the company from converting inventory to cash. Also, as the costs of raw materials have gone up, the company has had to spend more on inventory. Additionally, because of the slow-changing product offerings, the company purchased extra inventory in 2011 to deal with rising raw materials costs in the future.
For the majority of the years JOSB has also generated free cash flow at a healthy rate. The company is debt free.
Valuation
A brief summary of the company’s valuation measures as of May 24, 2012 are as follows:
When it comes to valuing JOSB, we can turn to The J. Crew Group (JCG) proxy statement filed on December 29, 2010, outlining the valuation methodology used in its acquisition by private equity firms TPG Capital and Leonard Green & Partners. Although the analysis was done in the latter part of 2010 and the deal was concluded in early 2011, the analysis should still prove valid as many members of the peer group trade at multiples that are similar compared to a year earlier. The purpose here is to identify what a private buyer would pay for a business similar to JOSB.
J. Crew and the other selected peer companies are very similar to JOSB since all of them mostly sell their own branded clothing in their retail stores. The only difference being that some may be more fashion focused than JOSB, and will generate more excitement amongst consumers. In other words, JOSB is considered a more “boring” business. Below is the section from the proxy describing the J. Crew transaction details:
This is followed by the direct peer group comparison:
And, actual specialty apparel transactions dating back to 2005:
Looking at the most recent J. Crew transaction data, and comparing it to current valuations and historical transactions of comparable firms, using an EV/EBITDA multiple of around 8.0x, and a P/E of about 19.0x seems reasonable, especially given JOSB’s strong balance sheet, cash generation abilities, and growth (see financials table above). Under this scenario, with net income of $97 million and EBITDA of $186m, the company’s operations are worth somewhere between $1.5 billion and $1.9 billion. The company also has cash and short term investments in the amount of $327 million (about 25% of market cap), and no debt, putting the total present value of JOSB between $1.83B and $2.23B, versus its current market cap of $1.3 billion. On a per share basis, this equates to a value between $66 and $80, versus a current share price of $47. If the company’s stock is to appreciate to its true value, this would result in a return between 30% and 70%. Even with a 20% margin of safety, JOSB is trading at about a $6 (13%) discount to the lower end of the range, and a $17 (36%) discount from the upper end of the range.
If one wishes to not use this private market valuation, the more conventional P/E metric can be used. Subtracting the $327 million cash from the $1.32 billion market cap, the company’s operations can be bought for about $1 billion at today’s market cap. With earnings of $97 million, this means the company is trading at a P/E of roughly 10x. This is what similar comps are trading for today:
This valuation is compelling because the company is stable; it has a strong history of positive earnings, earnings growth, free cash flow, and its future is somewhat predictable. Additionally, compared to many other firms, JOSB only operates in the United States, therefore its cash and cash equivalents balance is readily available and not subject to repatriation taxes that currently plague many domestic companies holding large amounts of cash overseas.
Potential Risks
Of course, the most important question to answer is where the potential risks and downside for any investment can come from. JOSB, like any other company, is not free of these.
For one, management compensation seems to be weighted very strongly toward the short-term versus the long-term, which provides cause to question if management objectives are aligned with those of shareholders. As an example, 86,000 restricted stock units were granted in fiscal year 2010 with none existing prior to that date, and another 66,000 granted in fiscal year 2011. During fiscal year 2011, 42,000 stock units had already vested. Meaning that up to half of the restricted stock units granted in fiscal year 2010 had already vested by fiscal year 2011. In fact, it was hard to find anything in SEC filings that indicates any type of long-term equity or cash compensation plan. Rather, most of the compensation is based on hitting annual (short-term) net income targets. Combining this with the fact that no executive owns more than 1% of the company raises some potential concerns.
The company also has a rights agreement (poison pill) in place, which allows shareholders the right to buy preferred shares should any party gain an ownership stake in the company of at least 20% (without management’s approval), thereby creating disincentive for a takeover attempt. In the event that management is performing poorly and a large shareholder wants to add influence, or the company becomes an attractive takeover target, the acquirer must negotiate with management first. Given management’s small ownership interest in the company, this may not be best for shareholders.
However, the management’s track record should mitigate some of these concerns. They have done a reasonable job of growing the company steadily (especially through some tough years for retail), with high returns on equity, and a strong balance sheet. However, for a long-term investor, it would be prudent to keep a look-out for whether the management could be sacrificing longer-term objectives to hit their short-term compensation objectives.
Conclusion
JOSB is a solid and stable company with a long history of being financially prudent. In recent years, the company has grown revenues and earnings consistently, and it looks to continue to do the same into the near future. Additionally, it sports a strong balance sheet with a lot of cash and no debt. These factors alone make it a strong consideration for a good investment.
The valuation of the company sweetens the deal even more. JOSB trades at a significant discount to its direct peers, and a significant discount to the transaction value based on what similar firms have been purchased for over the last seven years. Despite certain weaknesses pertaining to management’s long-term incentives, the company’s solid history and predictability of business results in the future should provide a significant return in the following years.