
PR Newswire
CHICAGO, Aug. 3, 2023
Resilient business line revenues drove performance as pullback in transaction activity continued into Q2
CHICAGO, Aug. 3, 2023 /PRNewswire/ -- Jones Lang LaSalle Incorporated (NYSE: JLL) today reported operating income of $149.2 million for the second quarter of 2023. Diluted earnings per share were $0.05 and adjusted diluted earnings per share1 were $0.50 for the quarter; both included a loss of $1.69 per diluted share associated with equity losses. In the prior-year quarter, equity earnings contributed earnings of $0.89 per diluted share.
- Second-quarter revenue was $5.1 billion, down 4% in local currency1, and fee revenue1 was $1.8 billion, down 13% in local currency1
- Market-wide transaction slowdown and extended interest rate uncertainty continued to impact Capital Markets volumes
- Lower Leasing activity across asset classes and most geographies overshadowed Property Management growth within Markets Advisory
- Project Management demand continued in several geographies, more than offsetting lower Portfolio Services revenues in Work Dynamics
- Margin contraction was driven by lower transaction-based revenues, particularly in United States and Europe, and a non-cash change in equity earnings/losses primarily associated with two JLL Technologies investments
- Annual run-rate savings rose $70 million to $210 million in total; recent cost reduction actions mostly offset investments to drive future growth
- Generated year-over-year improvement in Q2 cash provided by operating activities despite transaction-based revenue headwinds
"Our second quarter financial results reflect continued growth in our resilient revenues. While investment sales and leasing volumes remained muted across the industry this quarter, we are beginning to see recovery signs as credit spreads narrow and asset prices adjust to the current rate environment," said Christian Ulbrich, JLL CEO. "We continue to make progress on our long-term plan to improve operating efficiency while also making targeted investments in our brokerage teams that will drive profitable growth as market conditions improve. We are well positioned to provide exceptional service to our clients globally and capitalize on the significant growth opportunities we see in the years ahead."
Summary Financial Results ($ in millions, except per share data, "LC" = local currency) | Three Months Ended June 30, | Six Months Ended June 30, | |||||||||
2023 | 2022 | % Change | % Change | 2023 | 2022 | % Change | % Change | ||||
Revenue | $ 5,052.5 | $ 5,278.4 | (4) % | (4) % | $ 9,768.0 | $ 10,079.8 | (3) % | (2) % | |||
Fee revenue1 | 1,847.3 | 2,138.8 | (14) | (13) | 3,431.3 | 4,039.3 | (15) | (14) | |||
Net income (loss) attributable to common shareholders | $ 2.5 | $ 193.9 | (99) % | (99) % | $ (6.7) | $ 339.5 | (102) % | (104) % | |||
Adjusted net income attributable to common shareholders1 | 24.2 | 222.4 | (89) | (89) | 55.5 | 399.3 | (86) | (88) | |||
Diluted earnings (loss) per share | $ 0.05 | $ 3.90 | (99) % | (99) % | $ (0.14) | $ 6.75 | (102) % | (104) % | |||
Adjusted diluted earnings per share1 | 0.50 | 4.48 | (89) | (89) | 1.15 | 7.94 | (86) | (87) | |||
Adjusted EBITDA1 | $ 116.1 | $ 359.0 | (68) % | (68) % | $ 225.1 | $ 632.6 | (64) % | (65) % | |||
Free Cash Flow5 | $ 198.1 | $ 136.7 | 45 % | n/a | $ (567.5) | $ (626.3) | 9 % | n/a | |||
Note: For discussion and reconciliation of non-GAAP financial measures, see the Notes following the Financial Statements in this news release. | |||||||||||
Consolidated Second-Quarter 2023 Performance Highlights: | |||||||||||||||
Consolidated | Three Months Ended June 30, | % Change in USD | % Change in LC | Six Months Ended June 30, | % Change in USD | % Change in LC | |||||||||
2023 | 2022 | 2023 | 2022 | ||||||||||||
Markets Advisory | $ 1,025.4 | $ 1,118.2 | (8) % | (7) % | $ 1,931.8 | $ 2,117.7 | (9) % | (7) % | |||||||
Capital Markets | 448.0 | 684.5 | (35) | (34) | 805.1 | 1,285.1 | (37) | (36) | |||||||
Work Dynamics | 3,374.6 | 3,310.5 | 2 | 3 | 6,650.8 | 6,344.1 | 5 | 7 | |||||||
JLL Technologies | 60.6 | 50.7 | 20 | 20 | 122.0 | 100.1 | 22 | 22 | |||||||
LaSalle | 143.9 | 114.5 | 26 | 26 | 258.3 | 232.8 | 11 | 13 | |||||||
Total revenue | $ 5,052.5 | $ 5,278.4 | (4) % | (4) % | $ 9,768.0 | $ 10,079.8 | (3) % | (2) % | |||||||
Gross contract costs1 | (3,205.8) | (3,128.4) | 2 | 3 | (6,339.1) | (6,032.9) | 5 | 7 | |||||||
Net non-cash MSR and mortgage banking | 0.6 | (11.2) | (105) | (106) | 2.4 | (7.6) | (132) | (132) | |||||||
Total fee revenue1 | $ 1,847.3 | $ 2,138.8 | (14) % | (13) % | $ 3,431.3 | $ 4,039.3 | (15) % | (14) % | |||||||
Markets Advisory | 741.1 | 855.8 | (13) | (13) | 1,368.4 | 1,597.0 | (14) | (13) | |||||||
Capital Markets | 435.5 | 660.7 | (34) | (34) | 785.1 | 1,252.2 | (37) | (36) | |||||||
Work Dynamics | 477.8 | 467.0 | 2 | 3 | 919.8 | 877.5 | 5 | 7 | |||||||
JLL Technologies | 56.5 | 48.0 | 18 | 18 | 114.3 | 93.3 | 23 | 23 | |||||||
LaSalle | 136.4 | 107.3 | 27 | 28 | 243.7 | 219.3 | 11 | 14 | |||||||
Operating income | $ 149.2 | $ 235.1 | (37) % | (37) % | $ 167.0 | $ 410.8 | (59) % | (61) % | |||||||
Equity (losses) earnings | $ (103.5) | $ 53.6 | (293) % | (293) % | $ (106.1) | $ 72.1 | (247) % | (247) % | |||||||
Adjusted EBITDA1 | $ 116.1 | $ 359.0 | (68) % | (68) % | $ 225.1 | $ 632.6 | (64) % | (65) % | |||||||
Net income (loss) margin attributable to | — % | 3.7 % | (370) bps | n/a | (0.1) % | 3.4 % | (350) bps | n/a | |||||||
Adjusted EBITDA margin (local currency basis) | 6.2 % | 16.8 % | (1,050) bps | (1,060) bps | 6.3 % | 15.7 % | (910) bps | (940) bps | |||||||
Adjusted EBITDA margin (USD basis) | 6.3 % | 6.6 % | |||||||||||||
Note: For discussion and reconciliation of non-GAAP financial measures, see the Notes following the Financial Statements in this news release. Percentage variances in the Performance Highlights below are calculated and presented on a local currency basis, unless otherwise noted. | |||||||||||||||
Revenue
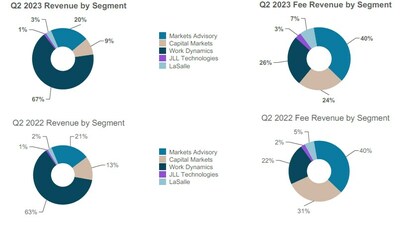
Revenue and fee revenue decreased 4% and 13%, respectively, compared with the prior-year quarter. Businesses with resilient revenues continued to deliver fee revenue growth for the quarter, as JLL Technologies was up 18%; Property Management, within Markets Advisory, grew 9%; and Workplace Management, within Work Dynamics, grew 2%. Consistent with the first quarter, economic headwinds and continued interest rate uncertainty adversely impacted most of the transaction-based businesses, notably Investment Sales and Debt/Equity Advisory within Capital Markets, Leasing within Markets Advisory, and Portfolio Services and Other within Work Dynamics. However, Project Management, within Work Dynamics, was up 8% due to continued project demand in several geographies. LaSalle's double-digit top-line growth was attributable to higher incentive fees.
Refer to segment performance highlights for additional detail. The following charts reflect the segment proportion of revenue and fee revenue for the current and prior-year quarters.
Net income (loss), Adjusted EBITDA and Margin Performance
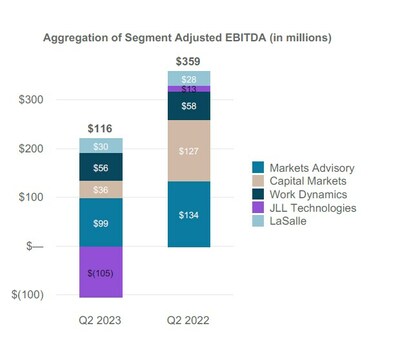
Net income attributable to common shareholders for the second quarter was $2.5 million, compared with $193.9 million in 2022, and Adjusted EBITDA was $116.1 million, compared with $359.0 million last year. The current quarter included $103.5 million of equity losses compared with $53.6 million of equity earnings in the prior-year quarter. In addition, interest expense, net of interest income, increased $24.8 million, compared with the prior year, due to an increase in the average outstanding borrowings under our credit facilities and a higher effective interest rate.
Diluted earnings per share for the second quarter were $0.05, down from $3.90 in 2022; adjusted diluted earnings per share were $0.50, compared with $4.48 last year.
Approximately 740 basis points, or 70%, of the adjusted EBITDA margin contraction was driven by the change in equity earnings/losses, net of carried interest. The residual decline was primarily due to lower transaction-based revenue, specifically Investment Sales, Debt/Equity Advisory, and Leasing. In addition, recent cost reduction actions mostly offset investments in the business to drive future growth.
The six months ended June 30, 2023, had a net loss attributable to common shareholders of $6.7 million, compared with income of $339.5 million last year, and Adjusted EBITDA was $225.1 million this year, compared with $632.6 million in 2022. Diluted loss per share was $0.14 for the six months ended June 30, 2023, down from diluted earnings per share of $6.75 in 2022; adjusted diluted earnings per share were $1.15, compared with $7.94 last year.
Cash Flows and Capital Allocation:
Net cash provided by operating activities was $237.0 million for the second quarter of 2023, compared with $177.0 million in the comparative quarter. Free Cash Flow5 was an inflow of $198.1 million this quarter, compared with $136.7 million in the second quarter of 2022. Incremental cash flows associated with net reimbursables and trade receivables outpaced a decline in cash provided by earnings. The year-over-year decline in cash provided by earnings and lower cash outflows associated with commission payments for the second quarter were largely driven by the Capital Markets and Markets Advisory change in business performance.
In the second quarter of 2023, the company resumed its share repurchase program, buying back 139,295 shares for $20.0 million. In the second quarter of 2022, 1,397,900 shares were repurchased, returning $297.7 million to shareholders. As of June 30, 2023, $1,135.6 million remained authorized for repurchase under the share repurchase program.
Net Debt, Leverage and Liquidity5: | |||||
June 30, 2023 | March 31, 2023 | June 30, 2022 | |||
Total Net Debt (in millions) | $ 1,941.5 | $ 2,099.3 | $ 1,575.9 | ||
Net Leverage Ratio | 2.3x | 1.9x | 1.0x | ||
Corporate Liquidity (in billions) | $ 1.9 | $ 1.7 | $ 1.9 | ||
The decrease in Net Debt from March 31, 2023, was primarily due to positive cash flow from operating activities in the second quarter. The higher leverage ratio was entirely driven by a decline in the trailing twelve month Adjusted EBITDA (which includes the impact of equity losses this quarter).
Markets Advisory Second-Quarter 2023 Performance Highlights: | |||||||||||||||
Markets Advisory
| Three Months Ended June 30, | % Change in USD | % Change in LC | Six Months Ended June 30, | % Change in USD | % Change in LC | |||||||||
2023 | 2022 | 2023 | 2022 | ||||||||||||
Revenue | $ 1,025.4 | $ 1,118.2 | (8) % | (7) % | $ 1,931.8 | $ 2,117.7 | (9) % | (7) % | |||||||
Gross contract costs1 | (284.3) | (262.4) | 8 | 10 | (563.4) | (520.7) | 8 | 11 | |||||||
Fee revenue1 | $ 741.1 | $ 855.8 | (13) % | (13) % | $ 1,368.4 | $ 1,597.0 | (14) % | (13) % | |||||||
Leasing | 588.0 | 703.5 | (16) | (16) | 1,070.5 | 1,300.4 | (18) | (17) | |||||||
Property Management | 131.0 | 122.2 | 7 | 9 | 258.1 | 240.8 | 7 | 10 | |||||||
Advisory, Consulting and Other | 22.1 | 30.1 | (27) | (25) | 39.8 | 55.8 | (29) | (26) | |||||||
Segment operating income | $ 84.0 | $ 116.2 | (28) % | (28) % | $ 139.6 | $ 207.6 | (33) % | (33) % | |||||||
Adjusted EBITDA1 | $ 99.4 | $ 134.0 | (26) % | (26) % | $ 171.0 | $ 245.2 | (30) % | ||||||||