

Present market conditions now match 6 other instances in history: August 1929 (followed by the 85% market decline of the Great Depression), November 1972 (followed by a market plunge in excess of 50%), August 1987 (followed by a market crash in excess of 30%), March 2000 (followed by a market plunge in excess of 50%), May 2007 (followed by a market plunge in excess of 50%), and January 2011 (followed by a market decline limited to just under 20% as a result of central bank intervention). These conditions represent a syndrome of overvalued, overbought, overbullish, rising yield conditions that has emerged near the most significant market peaks – and preceded the most severe market declines – in history:
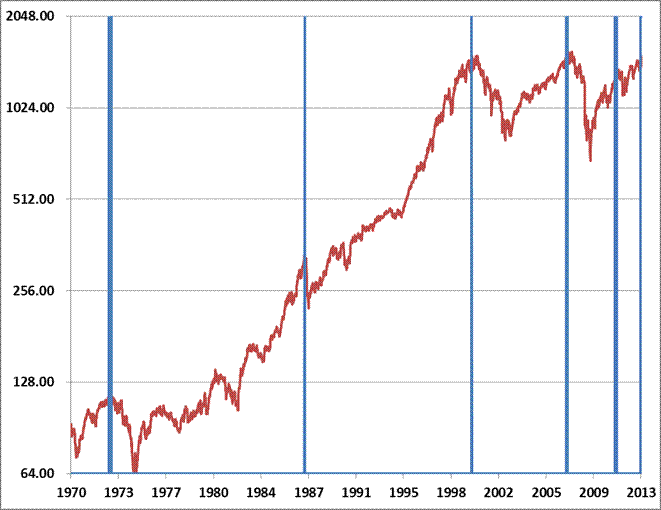
I can’t stress enough the importance of seeing the larger picture here – it would have been easy to miss the forest and get lost in the weeds and trees of daily and weekly market advances at each point identified in the chart above. Pursuing short-term returns in those environments would have been a mistake, because the initial losses typically came in the form of vertical “air pockets.”
I’m keenly aware that the reflexive answer to these concerns is to disregard the messenger. After all, here's a guy who had compiled a great record by early-2009 (anticipating a market loss which incidentally erased every bit of return achieved by the S&P 500 in excess of Treasury bills, all the way back to June 1995), and yet, seemingly unable to invest his way out of a paper bag during the recent bull market advance. Fair enough – I don’t deny for a second that my insistence on making our discipline robust to extreme economic and financial uncertainties also shot us in the foot in the recent bull market upswing – but that unfortunately doesn't alter the objective evidence, or the severity of present conditions.
For the record, our experience since 2009 largely reflects the miss that resulted after stress-testing our approach against Depression-era data, remaining defensive until I was satisfied that we could navigate a far wider range of future market and economic outcomes than investors presently seem to contemplate (see Notes on an Extraordinary Market Cycle for details on how that challenge was addressed). But again, none of that alters the fact that the period since March 2012 has been among the most negative 1% of historical instances on our measures. Our defensiveness during this period has been every bit reflective of what we would have advised in similar conditions throughout history (and in fact advised during similar conditions in 2000 and 2007). The S&P 500, after an entirely uncorrected advance and well over a year without a 10% retreat, is presently 6.8% above its March 2012 high. It’s an open question whether that gain will prove to be durable.
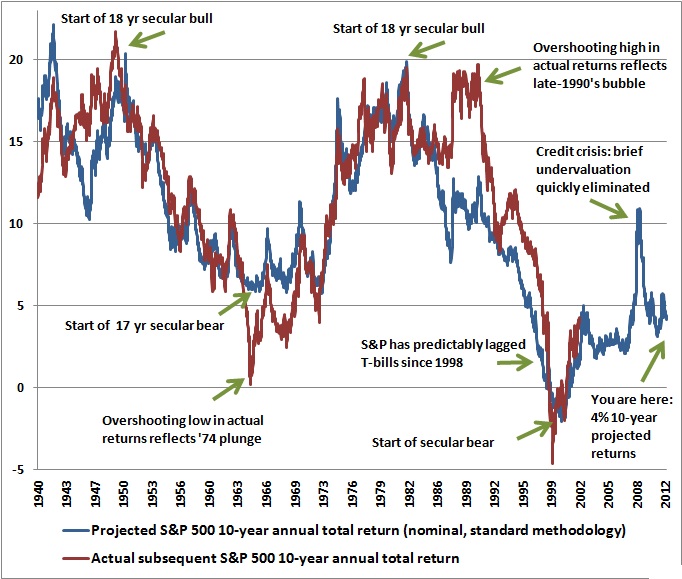
It’s a good reminder that the average bear market loss represents a run-of-the-mill market retreat of about 32% and wipes out more than half of the preceding bull market advance. An average bear market within a “secular” bear market period (a period generally about 17-18 years, where valuations begin at rich levels and achieve progressively lower levels over the course of 3-4 separate bull-bear cycles) is about 39%, and wipes out about 80% of the preceding bull market advance. The following chart (from Too Little to Lock In) provides a view of the sort of valuations we typically see at the beginning of secular bull market advances, versus where we are at present.
It’s interesting that even among investors who embrace the evidence regarding present overvalued, overbought, overbullish, rising-yield conditions, we see a sudden focus on short-term considerations – commercial paper yields are still a few basis points below their 10-month average, economic conditions seem to have briefly shifted from threatening to merely tepid, and so forth. Moreover, investors unanimously point to the Fed, believing that it will be safe to hold stocks until the instant some signal occurs that inflation is picking up or the Fed is stepping back, and assuming that tens of millions of investors can simultaneously exit stocks at that point, into what would surely be a vacuum of demand. This is like standing by a window at a party, seeing an oncoming wrecking ball, and reasoning that the prevailing wind will slow the ball down long enough to eat another cupcake and still beat the crowd down the stairs the moment the glass breaks. Historically, widely embraced strategies like “don’t fight the Fed” and “don’t fight the tape” have performed poorly, on average, once overvalued, overbought, overbullish, rising-yield conditions have emerged.
Read the complete commentary
Also check out:
- S&P 500 Index overvalued, with the Shiller P/E (S&P 500 divided by the 10-year average of inflation-adjusted earnings) greater than 18. The present multiple is actually 22.6.
- S&P 500 Index overbought, with the index more than 7% above its 52-week smoothing, at least 50% above its 4-year low, and within 3% of its upper Bollinger bands (2 standard deviations above the 20-period moving average) at daily, weekly, and monthly resolutions. Presently, the S&P 500 is either at or slightly through each of those bands.
- Investor sentiment overbullish (Investors Intelligence), with the 2-week average of advisory bulls greater than 52% and bearishness below 28%. The most recent weekly figures were 54.3% vs. 22.3%. The sentiment figures we use for 1929 are imputed using the extent and volatility of prior market movements, which explains a significant amount of variation in investor sentiment over time.
- Yields rising, with the 10-year Treasury yield higher than 6 months earlier.
I can’t stress enough the importance of seeing the larger picture here – it would have been easy to miss the forest and get lost in the weeds and trees of daily and weekly market advances at each point identified in the chart above. Pursuing short-term returns in those environments would have been a mistake, because the initial losses typically came in the form of vertical “air pockets.”
I’m keenly aware that the reflexive answer to these concerns is to disregard the messenger. After all, here's a guy who had compiled a great record by early-2009 (anticipating a market loss which incidentally erased every bit of return achieved by the S&P 500 in excess of Treasury bills, all the way back to June 1995), and yet, seemingly unable to invest his way out of a paper bag during the recent bull market advance. Fair enough – I don’t deny for a second that my insistence on making our discipline robust to extreme economic and financial uncertainties also shot us in the foot in the recent bull market upswing – but that unfortunately doesn't alter the objective evidence, or the severity of present conditions.
For the record, our experience since 2009 largely reflects the miss that resulted after stress-testing our approach against Depression-era data, remaining defensive until I was satisfied that we could navigate a far wider range of future market and economic outcomes than investors presently seem to contemplate (see Notes on an Extraordinary Market Cycle for details on how that challenge was addressed). But again, none of that alters the fact that the period since March 2012 has been among the most negative 1% of historical instances on our measures. Our defensiveness during this period has been every bit reflective of what we would have advised in similar conditions throughout history (and in fact advised during similar conditions in 2000 and 2007). The S&P 500, after an entirely uncorrected advance and well over a year without a 10% retreat, is presently 6.8% above its March 2012 high. It’s an open question whether that gain will prove to be durable.
It’s a good reminder that the average bear market loss represents a run-of-the-mill market retreat of about 32% and wipes out more than half of the preceding bull market advance. An average bear market within a “secular” bear market period (a period generally about 17-18 years, where valuations begin at rich levels and achieve progressively lower levels over the course of 3-4 separate bull-bear cycles) is about 39%, and wipes out about 80% of the preceding bull market advance. The following chart (from Too Little to Lock In) provides a view of the sort of valuations we typically see at the beginning of secular bull market advances, versus where we are at present.
It’s interesting that even among investors who embrace the evidence regarding present overvalued, overbought, overbullish, rising-yield conditions, we see a sudden focus on short-term considerations – commercial paper yields are still a few basis points below their 10-month average, economic conditions seem to have briefly shifted from threatening to merely tepid, and so forth. Moreover, investors unanimously point to the Fed, believing that it will be safe to hold stocks until the instant some signal occurs that inflation is picking up or the Fed is stepping back, and assuming that tens of millions of investors can simultaneously exit stocks at that point, into what would surely be a vacuum of demand. This is like standing by a window at a party, seeing an oncoming wrecking ball, and reasoning that the prevailing wind will slow the ball down long enough to eat another cupcake and still beat the crowd down the stairs the moment the glass breaks. Historically, widely embraced strategies like “don’t fight the Fed” and “don’t fight the tape” have performed poorly, on average, once overvalued, overbought, overbullish, rising-yield conditions have emerged.
Read the complete commentary
Also check out: