

Wyndham Hotels & Resorts Inc (WH, Financial) recently saw a daily gain of 11.09%, and a 3-month gain of 4.11%. The company's Earnings Per Share (EPS) stands at 3.35. But is the stock fairly valued? In this article, we will conduct a comprehensive analysis of Wyndham Hotels & Resorts' valuation. Let's delve into the details.
Introduction to Wyndham Hotels & Resorts Inc (WH, Financial)
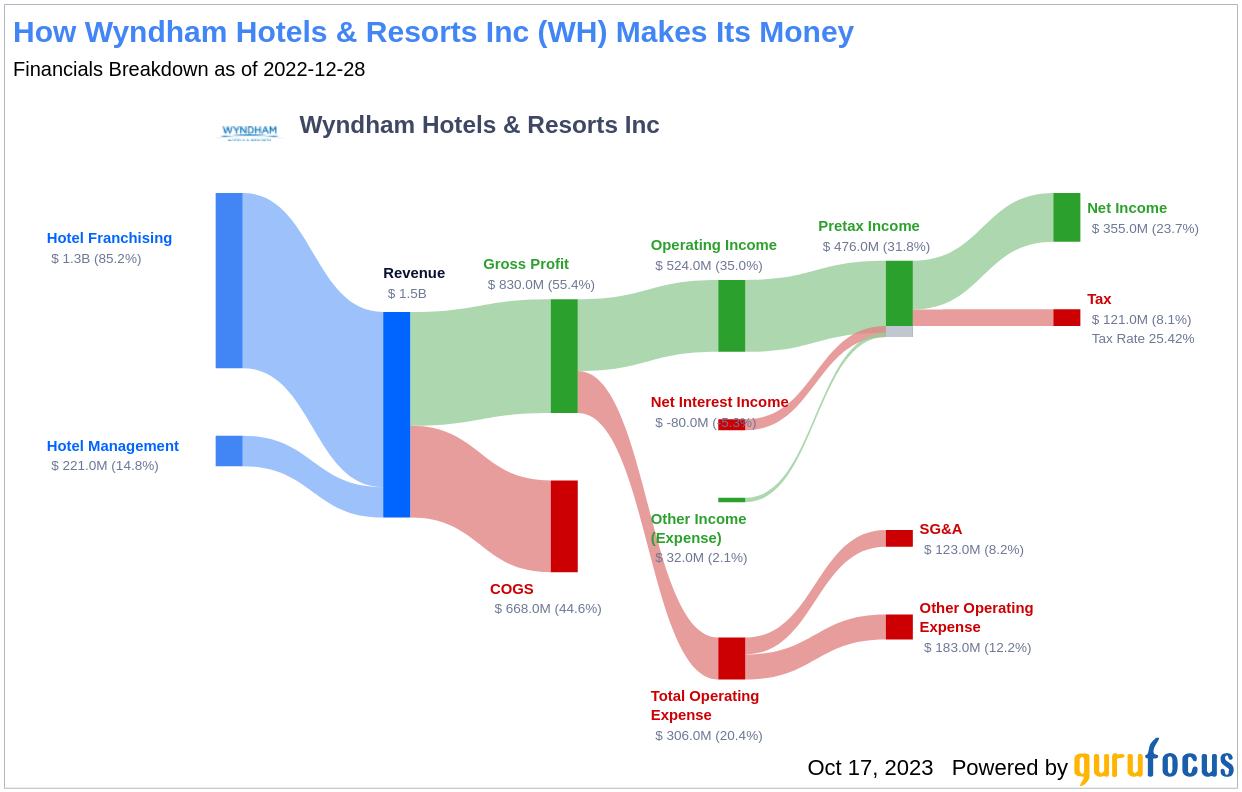
As of Dec. 31, 2022, Wyndham Hotels & Resorts operates 843,000 rooms across more than 20 brands predominantly in the economy and midscale segments. The United States represents roughly 60% of total rooms. The company's current stock price is $76.76, and the market cap stands at $6.50 billion. We will compare this with the GF Value, an estimation of fair value, to evaluate the company's market value.
Understanding the GF Value of Wyndham Hotels & Resorts
The GF Value is a unique measure of a stock's intrinsic value, computed based on historical trading multiples, a GuruFocus adjustment factor, and future business performance estimates. The GF Value Line on our summary page gives an overview of the fair value that the stock should be traded at.
According to GuruFocus Value calculation, Wyndham Hotels & Resorts (WH, Financial) appears to be fairly valued. At its current price of $76.76 per share and the market cap of $6.50 billion, Wyndham Hotels & Resorts stock appears to be fairly valued. Because Wyndham Hotels & Resorts is fairly valued, the long-term return of its stock is likely to be close to the rate of its business growth.

Link: These companies may deliever higher future returns at reduced risk.
Assessing Wyndham Hotels & Resorts' Financial Strength
Investing in companies with low financial strength could result in permanent capital loss. Wyndham Hotels & Resorts has a cash-to-debt ratio of 0.03, which ranks worse than 93.6% of 813 companies in the Travel & Leisure industry. Based on this, GuruFocus ranks Wyndham Hotels & Resorts's financial strength as 4 out of 10, suggesting poor balance sheet.

Evaluating Wyndham Hotels & Resorts' Profitability and Growth
Investing in profitable companies carries less risk. Wyndham Hotels & Resorts has been profitable 7 years over the past 10 years. Its operating margin of 34.96% is better than 95.33% of 814 companies in the Travel & Leisure industry. Overall, GuruFocus ranks Wyndham Hotels & Resorts's profitability as fair.
Growth is probably the most important factor in the valuation of a company. The 3-year average annual revenue growth of Wyndham Hotels & Resorts is -8.1%, which ranks worse than 66.32% of 760 companies in the Travel & Leisure industry. The 3-year average EBITDA growth rate is 17.3%, which ranks better than 66.72% of 604 companies in the Travel & Leisure industry.
ROIC vs WACC
One can also evaluate a company's profitability by comparing its return on invested capital (ROIC) to its weighted average cost of capital (WACC). Return on invested capital (ROIC) measures how well a company generates cash flow relative to the capital it has invested in its business. The weighted average cost of capital (WACC) is the rate that a company is expected to pay on average to all its security holders to finance its assets. If the return on invested capital exceeds the weighted average cost of capital, the company is likely creating value for its shareholders. During the past 12 months, Wyndham Hotels & Resorts's ROIC is 9.92 while its WACC came in at 8.75.

Conclusion
In conclusion, the stock of Wyndham Hotels & Resorts (WH, Financial) appears to be fairly valued. The company's financial condition is poor and its profitability is fair. Its growth ranks better than 66.72% of 604 companies in the Travel & Leisure industry. To learn more about Wyndham Hotels & Resorts stock, you can check out its 30-Year Financials here.
To find out the high quality companies that may deliever above average returns, please check out GuruFocus High Quality Low Capex Screener.
This article, generated by GuruFocus, is designed to provide general insights and is not tailored financial advice. Our commentary is rooted in historical data and analyst projections, utilizing an impartial methodology, and is not intended to serve as specific investment guidance. It does not formulate a recommendation to purchase or divest any stock and does not consider individual investment objectives or financial circumstances. Our objective is to deliver long-term, fundamental data-driven analysis. Be aware that our analysis might not incorporate the most recent, price-sensitive company announcements or qualitative information. GuruFocus holds no position in the stocks mentioned herein.