

Investors are often on the lookout for stocks that show significant daily gains or losses, as these can be indicative of a company's current market sentiment and potential future performance. Pampa Energia SA (PAM, Financial) recently experienced a substantial daily gain of 17.92%, yet its 3-month performance shows a slight loss of 2.61%. With an impressive Earnings Per Share (EPS) of 10.09, the question arises: is Pampa Energia SA significantly overvalued? This article aims to delve into the valuation analysis of Pampa Energia SA (PAM) to provide investors with a clearer picture of its true market value.
Company Introduction
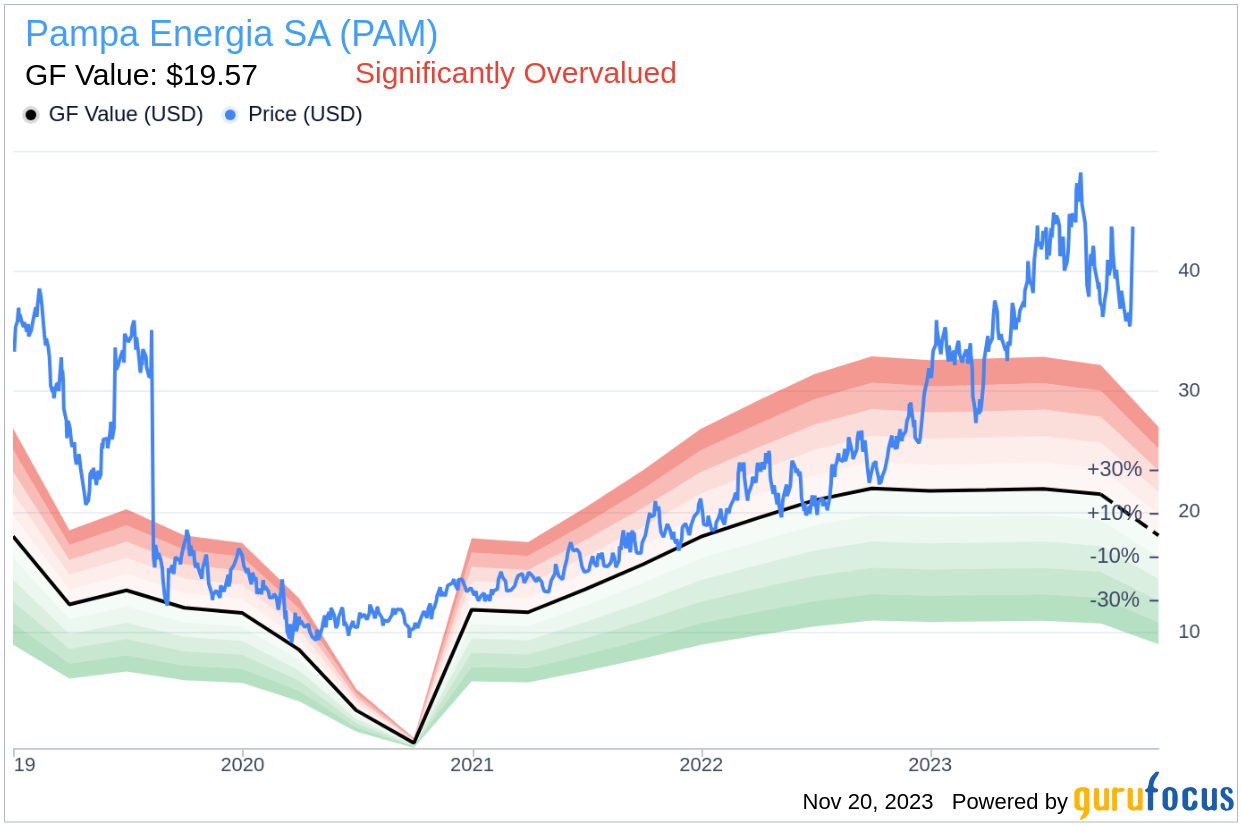
Pampa Energia SA and its subsidiaries are a force to be reckoned with in the Energy sector, with operations encompassing electricity generation, distribution, oil and gas, petrochemicals, and other business segments. The company's primary revenue stream stems from the distribution of energy. When evaluating the stock's price of $43.7 against the GF Value of $19.57, a measure of intrinsic value, it becomes evident that a deeper analysis is necessary to understand the company's valuation fully.

Summarize GF Value
The GF Value is a unique valuation tool that provides an estimate of a stock's fair value by considering historical trading multiples, a GuruFocus adjustment factor based on past performance and growth, and future business performance estimates. According to this method, Pampa Energia SA (PAM, Financial) appears to be significantly overvalued. The stock price is considerably higher than the GF Value Line, suggesting that its future return may fall short of the company's business growth. This discrepancy indicates that investors should exercise caution, as the long-term return on Pampa Energia SA's stock could be much lower than expected.
Financial Strength
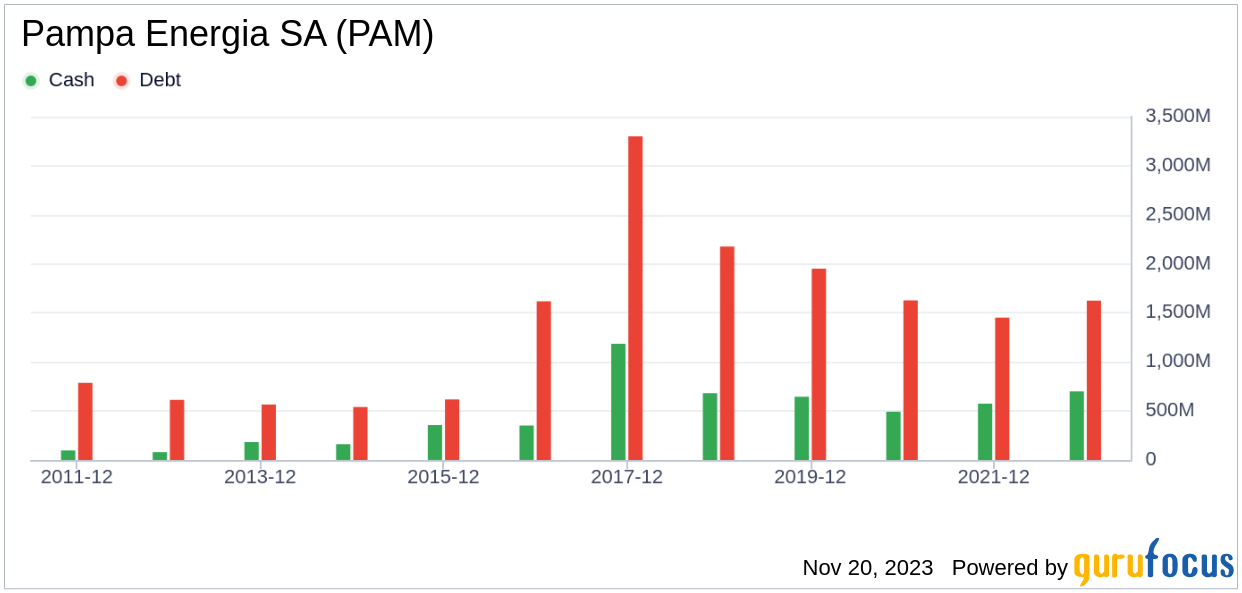
Investing in companies with robust financial strength is crucial to mitigate the risk of capital loss. Pampa Energia SA boasts a cash-to-debt ratio of 0.59, outperforming 69.64% of its peers in the Utilities - Independent Power Producers industry. This fair financial strength, with a GuruFocus ranking of 5 out of 10, suggests that the company stands on stable financial footing.
Profitability and Growth
Profitable companies, especially those with a track record of consistent profitability, are generally safer investments. Pampa Energia SA has maintained profitability for 9 of the past 10 years, with a solid operating margin of 25.89% that ranks well within its industry. The company's strong profitability score of 8 out of 10 by GuruFocus underscores its robust financial health.
Growth is a vital indicator of a company's valuation. Pampa Energia SA's 3-year average revenue growth rate surpasses that of 91.74% of its industry counterparts, and its EBITDA growth rate of 63.6% is higher than 88.95% of the companies in the Utilities - Independent Power Producers industry, indicating promising growth prospects.
ROIC vs. WACC
Comparing a company's Return on Invested Capital (ROIC) to its Weighted Average Cost of Capital (WACC) is another way to gauge profitability. Pampa Energia SA's ROIC of 10.31 indicates that it is generating cash flow effectively, though it is currently just below its cost of capital at 11.78, suggesting room for improvement in creating shareholder value.

Conclusion
In summary, Pampa Energia SA (PAM, Financial) is currently priced above its fair value, which may lead to a lower-than-anticipated long-term return. However, the company's financial condition is fair, and its profitability is strong, with growth rates that are impressive within its industry. To gain a more comprehensive understanding of Pampa Energia SA's financials, interested parties can visit 30-Year Financials here.
To discover high-quality companies that may deliver above-average returns, please check out the GuruFocus High Quality Low Capex Screener.
This article, generated by GuruFocus, is designed to provide general insights and is not tailored financial advice. Our commentary is rooted in historical data and analyst projections, utilizing an impartial methodology, and is not intended to serve as specific investment guidance. It does not formulate a recommendation to purchase or divest any stock and does not consider individual investment objectives or financial circumstances. Our objective is to deliver long-term, fundamental data-driven analysis. Be aware that our analysis might not incorporate the most recent, price-sensitive company announcements or qualitative information. GuruFocus holds no position in the stocks mentioned herein.