

Value-focused investors constantly seek stocks trading below their intrinsic value. Guardant Health Inc (GH, Financial) is a stock that demands attention in this context. With its current price at $25.22 and having experienced a significant loss of 9.61% in a single day, alongside a 3-month decrease of 8.02%, it appears to be an intriguing case. The stock's fair valuation according to the GF Value is $66.47, suggesting a substantial undervaluation.
Understanding GF Value
The GF Value is an intrinsic value estimate based on an exclusive method that combines historical trading multiples, a GuruFocus adjustment factor, and future business performance estimates. If the stock price hovers significantly below the GF Value Line, it typically indicates that the stock may yield a higher future return. Conversely, a price well above the GF Value Line often signals overvaluation and a potentially poor future return.
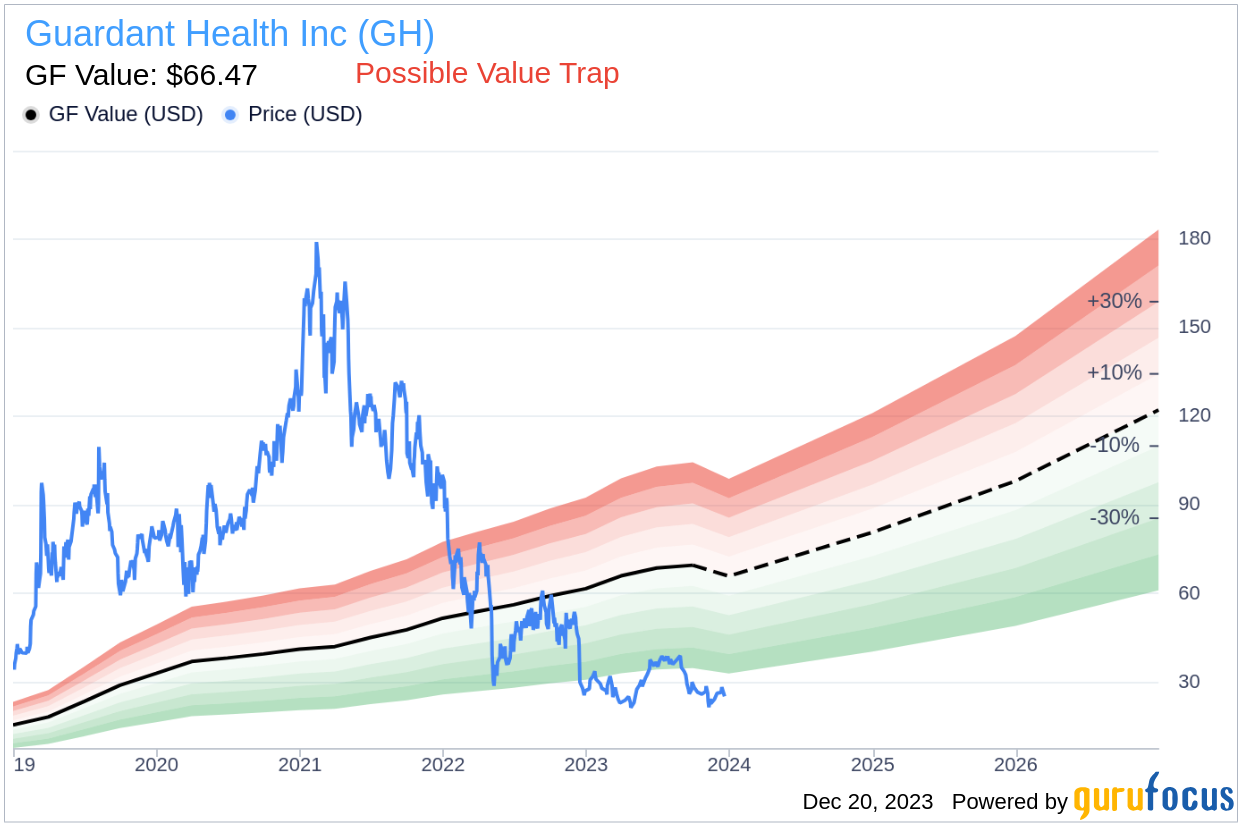
However, a deeper analysis is crucial before making an investment decision. Despite Guardant Health's seemingly attractive valuation, investors must weigh certain risk factors. These risks are reflected through its low Altman Z-score of 0, which suggests that Guardant Health, despite its apparent undervaluation, might be a potential value trap. This complexity underscores the importance of thorough due diligence in investment decision-making.
Financial Health Indicators
The Piotroski F-score is a metric used to assess a company's financial health, with scores ranging from 0 to 9. Guardant Health's low score indicates potential financial issues, which is a red flag for investors. The Altman Z-score, predicting the likelihood of bankruptcy, further compounds the concern with a score below the critical threshold of 1.8 for Guardant Health.
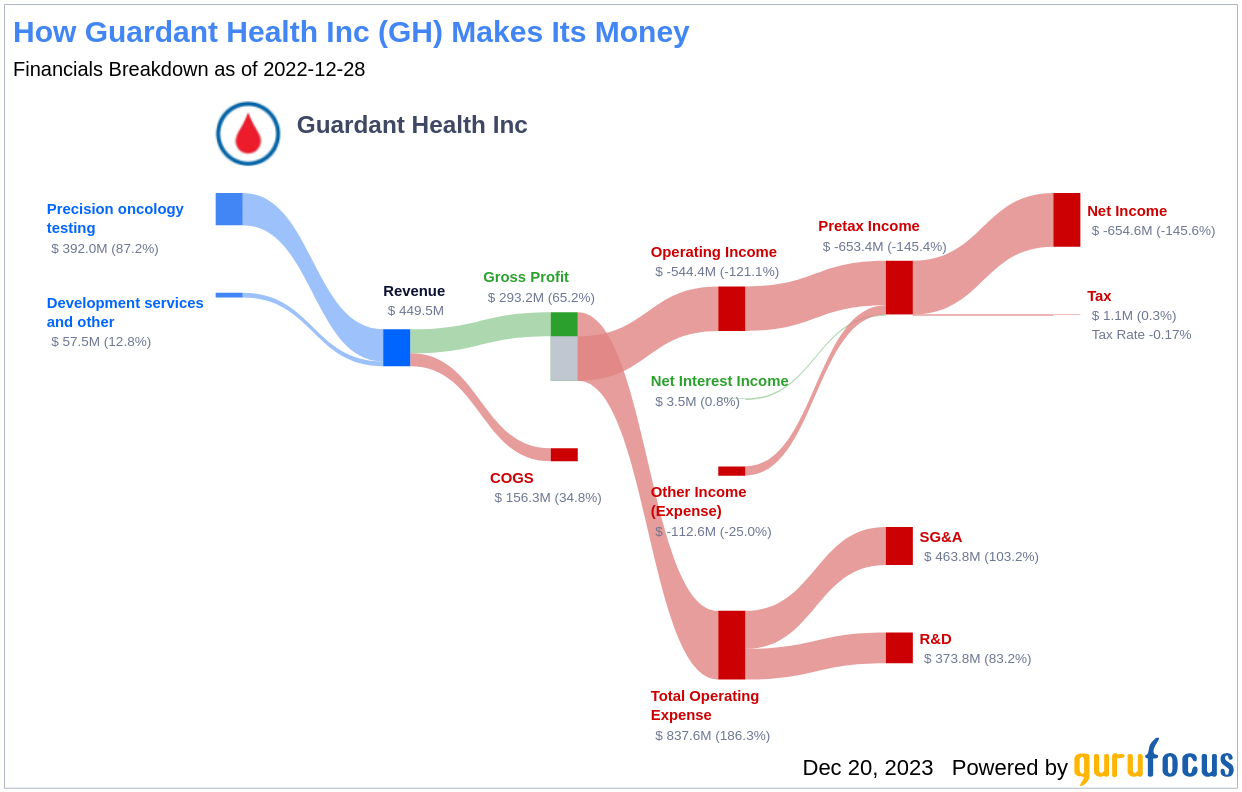
Company Profile and Financials
Guardant Health Inc, headquartered in Redwood City, California, is at the forefront of liquid biopsy cancer tests for both clinical and research applications. With innovative products like Guardant360 LDT and the FDA-approved Guardant360 CDx, the company is a key player in the oncology field. Its recent launches, Reveal and Shield, expand its portfolio into molecular residual disease testing and colorectal cancer screening. Despite its pioneering work and a market cap of $3 billion, Guardant Health's financials reveal a Loss Per Share of $4.06 and a concerning operating margin of -95.81%. These figures, coupled with the company's ROIC of -92.87% and a WACC of 7.69%, paint a picture of financial strain.
Guardant Health's Financial Distress Signals
An analysis of Guardant Health's financial ratios reveals a troubling trend. The company's Retained Earnings to Total Assets ratio has deteriorated from -0.41 in 2021 to -1.09 in 2023, indicating a weakening ability to reinvest profits or manage debt effectively. This decline is a significant contributor to Guardant Health's low Altman Z-score and raises concerns about its long-term financial stability.
Conclusion: The Value Trap Scenario
While Guardant Health's stock may seem undervalued based on GF Value, the company's financial health indicators, including a low Piotroski F-score and Altman Z-score, suggest that it could be a value trap. The risk of financial distress cannot be overlooked, and investors should exercise caution. For those seeking more secure investment opportunities, GuruFocus Premium members have access to tools like the Piotroski F-score screener and the Walter Schloss Screen to identify stocks with strong financial health indicators. Is Guardant Health a diamond in the rough, or a mirage in the desert of investment options? That's the million-dollar question for value investors.
This article, generated by GuruFocus, is designed to provide general insights and is not tailored financial advice. Our commentary is rooted in historical data and analyst projections, utilizing an impartial methodology, and is not intended to serve as specific investment guidance. It does not formulate a recommendation to purchase or divest any stock and does not consider individual investment objectives or financial circumstances. Our objective is to deliver long-term, fundamental data-driven analysis. Be aware that our analysis might not incorporate the most recent, price-sensitive company announcements or qualitative information. GuruFocus holds no position in the stocks mentioned herein.