

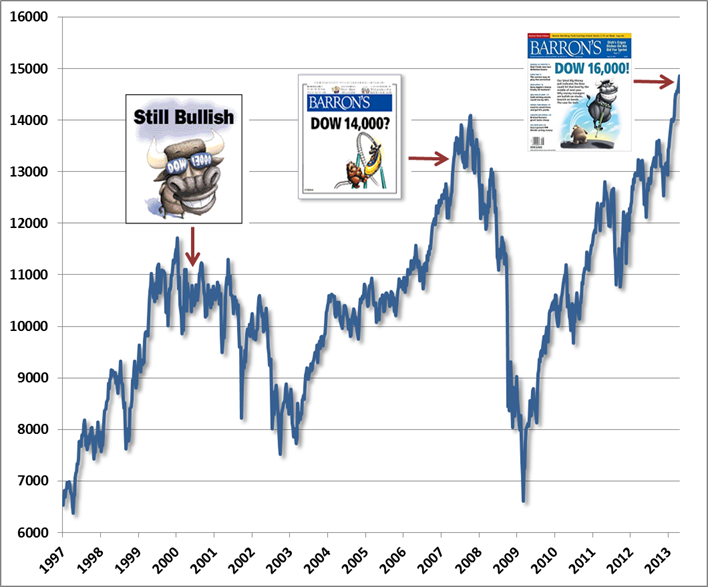
“The stock market isn't the only thing that has set records this spring. Barron's semiannual Big Money poll of professional investors also is setting a record -- for bullishness, that is. In our latest survey, 74% of money managers identify themselves as bullish or very bullish about the prospects for U.S. stocks -- an all-time high for Big Money, going back more than 20 years.” “Dow 16000!” – Barron’s Magazine Big Money Poll 4/20/2013
A few reminders…
“Still Bullish! (Dow 13000)” – Barron’s Magazine Big Money Poll, May 1, 2000
The May 2000 Big Money Poll was published with the Dow Jones Industrial Average at 10733.91. The Dow had already peaked nearly a thousand points higher in January of 2000, and would go on to lose about 40% of its value in the 2000-2002 bear market, with the S&P 500 and Nasdaq faring far worse.
“Dow 14000?” – Barron’s Magazine Big Money Poll, May 2, 2007
The May 2007 Big Money Poll was published with the Dow at 13264.62. The Dow did advance another 6% to reach 14000 by October 2007. By November (the poll is semi-annual), bulls were outnumbering bears by 2-to-1, and the headline ran “The Party’s Not Over.” In fact, the market had already peaked, and proceeded to lose over half its value in the 2007-2009 bear market.
...
Rule o’ Thumb: When the cover of a major financial magazine features a cartoon of a bull leaping through the air on a pogo stick, it’s probably about time to cash in the chips.
While the attention of investors is focused on the short-run market outlook in what is already a mature bull market advance, it’s crucial to understand the endgame to this overvalued, overbought, overbullish, overleveraged episode of market history. That endgame will be forced liquidation, as declining prices force leveraged investors to sell – voluntarily or otherwise. I noted back in January that margin debt had surged above 2% of GDP for the fourth time in history (the other three being 2000, 2007, and February 2011 - less severe, but still followed by an 18% market correction). In February, NYSE margin debt (the amount that investors have borrowed to purchase NYSE-traded stocks on margin) reached $366 billion, and there’s a fair chance that given the continuation of that advance in the subsequent weeks, more recent margin debt will have accumulated to a total that eclipses the July 2007 record of $381 billion.
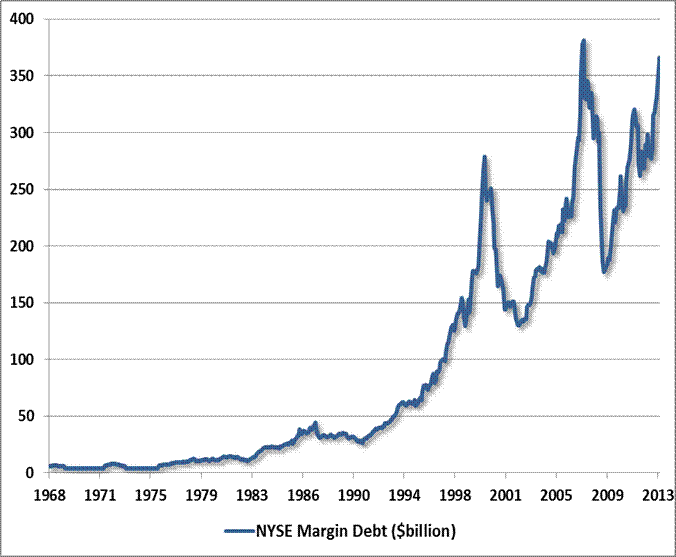
Clearly, the dollar value of margin debt has experienced a secular increase over time, so the levels aren’t as important as the cyclical variations. In particular, note that rapid and nearly parabolic increases in leverage tend to appear as the market approaches major peaks and bullishness feeds on itself. There are a number of series that can be used to normalize the long-term uptrend and to put the amount of margin debt in context. Notice that one would not want to normalize using the market value of stocks themselves. The reason is that margin debt surges near market peaks and collapses at market troughs, so to divide by the level of prices at those points would actually destroy much of the information content of margin debt (though you still typically observe debt rising much faster than prices as the market peaks).
Read the complete commentary
A few reminders…
“Still Bullish! (Dow 13000)” – Barron’s Magazine Big Money Poll, May 1, 2000
The May 2000 Big Money Poll was published with the Dow Jones Industrial Average at 10733.91. The Dow had already peaked nearly a thousand points higher in January of 2000, and would go on to lose about 40% of its value in the 2000-2002 bear market, with the S&P 500 and Nasdaq faring far worse.
“Dow 14000?” – Barron’s Magazine Big Money Poll, May 2, 2007
The May 2007 Big Money Poll was published with the Dow at 13264.62. The Dow did advance another 6% to reach 14000 by October 2007. By November (the poll is semi-annual), bulls were outnumbering bears by 2-to-1, and the headline ran “The Party’s Not Over.” In fact, the market had already peaked, and proceeded to lose over half its value in the 2007-2009 bear market.
...
Rule o’ Thumb: When the cover of a major financial magazine features a cartoon of a bull leaping through the air on a pogo stick, it’s probably about time to cash in the chips.
While the attention of investors is focused on the short-run market outlook in what is already a mature bull market advance, it’s crucial to understand the endgame to this overvalued, overbought, overbullish, overleveraged episode of market history. That endgame will be forced liquidation, as declining prices force leveraged investors to sell – voluntarily or otherwise. I noted back in January that margin debt had surged above 2% of GDP for the fourth time in history (the other three being 2000, 2007, and February 2011 - less severe, but still followed by an 18% market correction). In February, NYSE margin debt (the amount that investors have borrowed to purchase NYSE-traded stocks on margin) reached $366 billion, and there’s a fair chance that given the continuation of that advance in the subsequent weeks, more recent margin debt will have accumulated to a total that eclipses the July 2007 record of $381 billion.
Clearly, the dollar value of margin debt has experienced a secular increase over time, so the levels aren’t as important as the cyclical variations. In particular, note that rapid and nearly parabolic increases in leverage tend to appear as the market approaches major peaks and bullishness feeds on itself. There are a number of series that can be used to normalize the long-term uptrend and to put the amount of margin debt in context. Notice that one would not want to normalize using the market value of stocks themselves. The reason is that margin debt surges near market peaks and collapses at market troughs, so to divide by the level of prices at those points would actually destroy much of the information content of margin debt (though you still typically observe debt rising much faster than prices as the market peaks).
Read the complete commentary